x Energy Analysis of Underground Coal Gasification with

 Air CO, CO 2, H 2 O, CH 4, N 2 Water (Steam)")

 Coal (56%) Ref: Dellucci, 2003; Except the CCS")


 P:")

 Composition (dry basis) H 2 0. 46 CO 2")
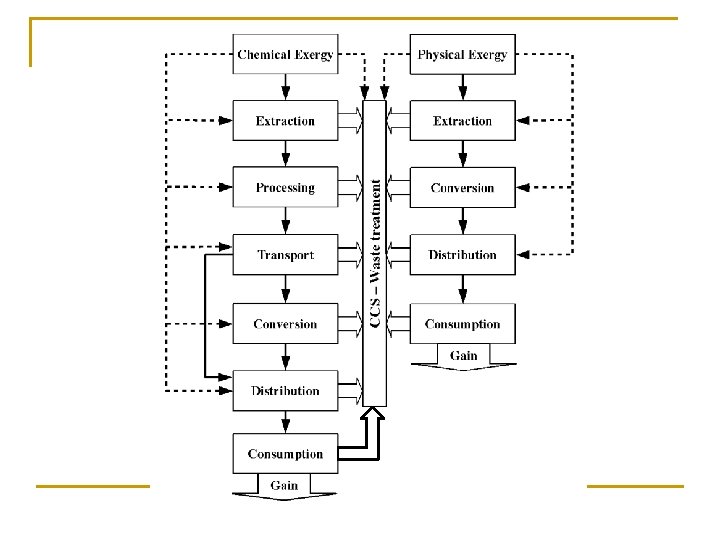
 E 5 E 1 ERes E 2 Egain E 4")
 Theoretical Practical")
 Recovery factor (%) Theoretical, practical, and zero-emission recovery of coal")
")


- Slides: 20
x Energy Analysis of Underground Coal Gasification with Simultaneous Storage of Carbon Dioxide Ali Akbar Eftekhari Hans Bruining
(Enriched) Air CO, CO 2, H 2 O, CH 4, N 2 Water (Steam) C + 2 H 2 O + Ca. O Ca. CO 3 + 2 H 2 + 87. 9 k. J/mol Exergy Analysis
Exergy Analysis of Energy Recovery Processes CO 2 Capture and Storage Energy CO 2 Capture and Storage Recovery Process Source Recovery Process Energy Consumption
Zero-emission recovery factor Natural Gas (62%) Coal (56%) Ref: Dellucci, 2003; Except the CCS data
UCG with mineral injection High Temperature: Ca. CO 3 Ca. O + CO 2 Volume Constraint: 5
Independent reactions n Combustion q n C + O 2 CO 2 + 393. 77 k. J/mol Gasification q Global reaction n q C + CO 2 2 CO – 172. 58 k. J/mol Shift reaction n q C + 2 H 2 O + Ca. O Ca. CO 3 + 2 H 2 + 87. 9 k. J/mol Boudouard reaction n q Exothermic Endothermic CO + H 2 O CO 2 + H 2 – 41. 98 k. J/mol Methanation n C + 2 H 2 CH 4 + 74. 90 k. J/mol Very Slow
Equilibrium relations yi: gas phase mole fraction P 0: standard pressure (1 bar) P: system pressure Kj: equilibrium constant of reaction j vi, j: stoichiometric coefficient of component i in reaction j Φi: fugacity coefficient of component i in a gas mixture
Temperature constraint at P=80 bar Volume constraint
Optimum composition (O 2 injection) Composition (dry basis) H 2 0. 46 CO 2 0. 08 CO 0. 32 CH 4 0. 14 Higher heating value (MJ/m 3) 14. 679 Lower heating value (MJ/m 3) 13. 286
Process flow diagram (1) E 5 E 1 ERes E 2 Egain E 4 E 3 η = (Egain - (∑Ei +ECCS ))/ERes ECCS
From theory to practice Zero-emission (Sustainable) Theoretical Practical
Results of PFD (1) Recovery factor (%) Theoretical, practical, and zero-emission recovery of coal energy (water to oxygen molar ratio of 3. 2)
Process flow diagram (2)
Sustainable recovery for other energy conversion processes
Conclusion n n In situ introduction of absorbent e. g. Ca. O is energetically expensive and with the current state of technology is not feasible Using naturally abundant minerals can improve the exergetic recovery of UCG process
Coal Zero-emission Recovery
Natural gas sustainable recovery
Formulation
Exergy? n n Energy = Exergy + Anergy Exergy is a portion of energy that potentially can be converted to mechanical work 1 k. J of Electricity = 1 k. J of Exergy + 0 k. J of Anergy 1 k. J of energy in hot water at 70 o. C = 0. 13 k. J Exergy + 0. 87 Anergy Energy is conserved; Exergy is consumed