
www swamicharts com Not Rocket Science An Intuitive


- Slides: 21
www. swamicharts. com Not Rocket Science – An Intuitive New Display John Ehlers
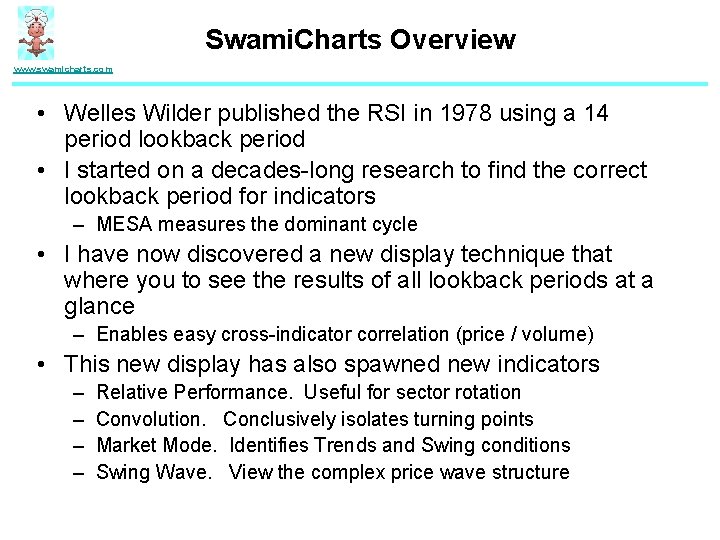
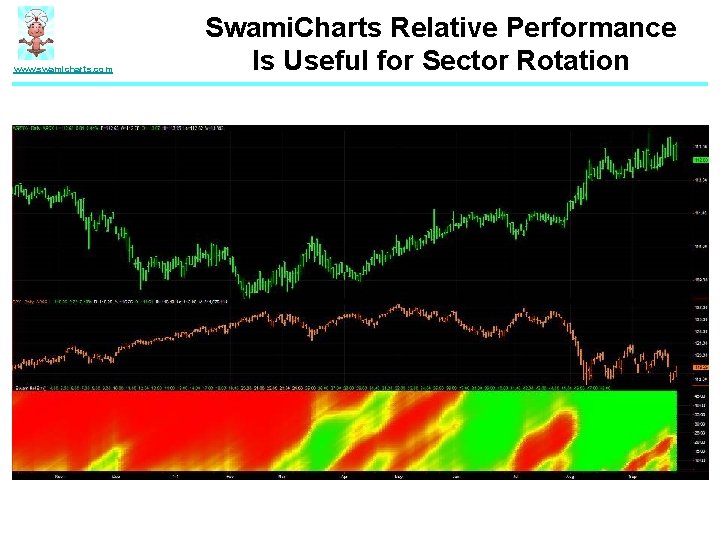
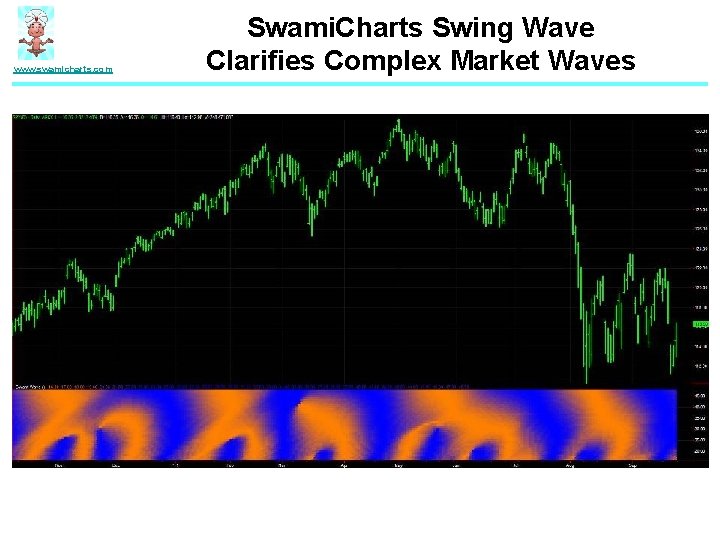
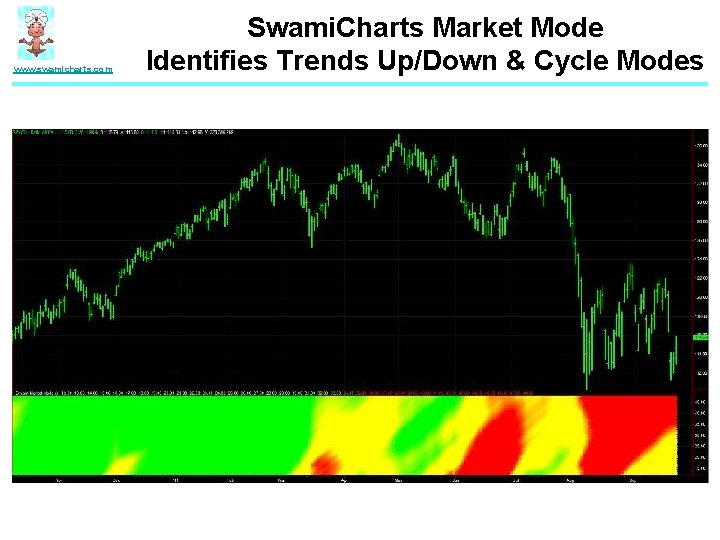
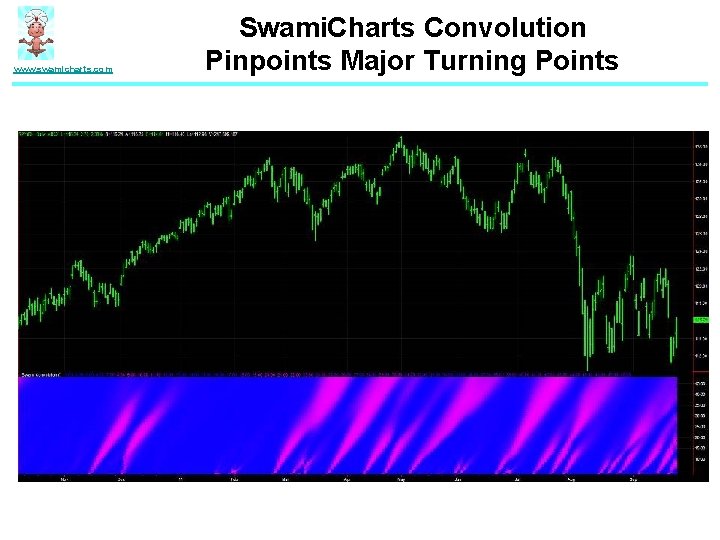
Swami. Charts Overview www. swamicharts. com • Welles Wilder published the RSI in 1978 using a 14 period lookback period • I started on a decades-long research to find the correct lookback period for indicators – MESA measures the dominant cycle • I have now discovered a new display technique that where you to see the results of all lookback periods at a glance – Enables easy cross-indicator correlation (price / volume) • This new display has also spawned new indicators – – Relative Performance. Useful for sector rotation Convolution. Conclusively isolates turning points Market Mode. Identifies Trends and Swing conditions Swing Wave. View the complex price wave structure
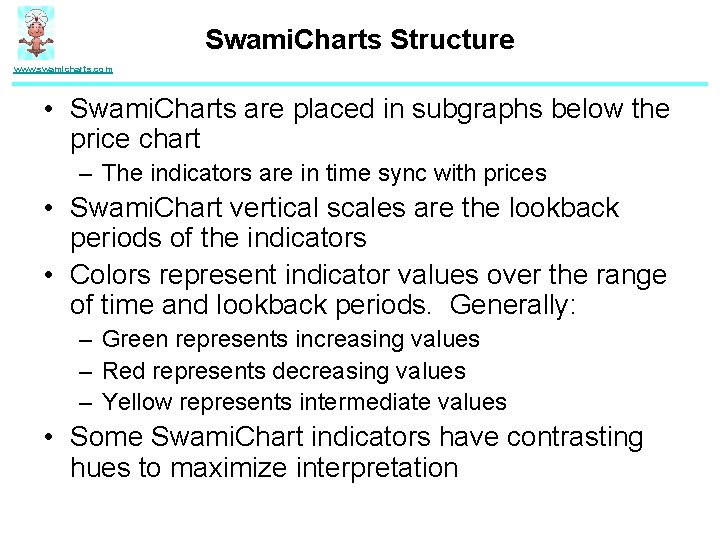
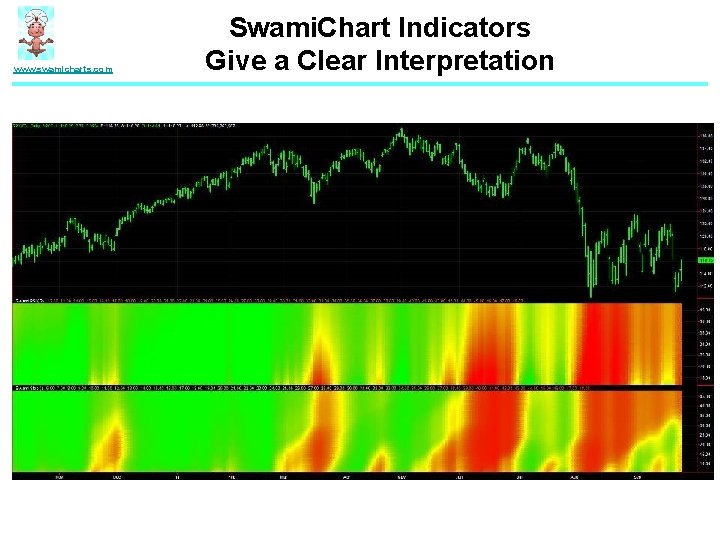
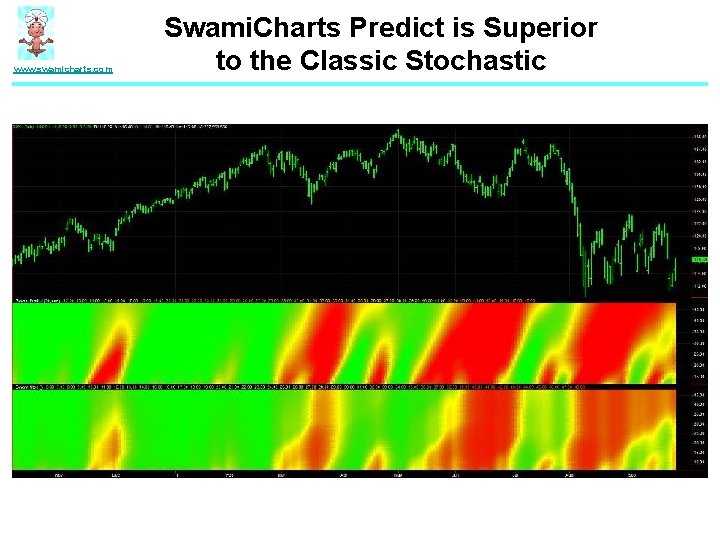
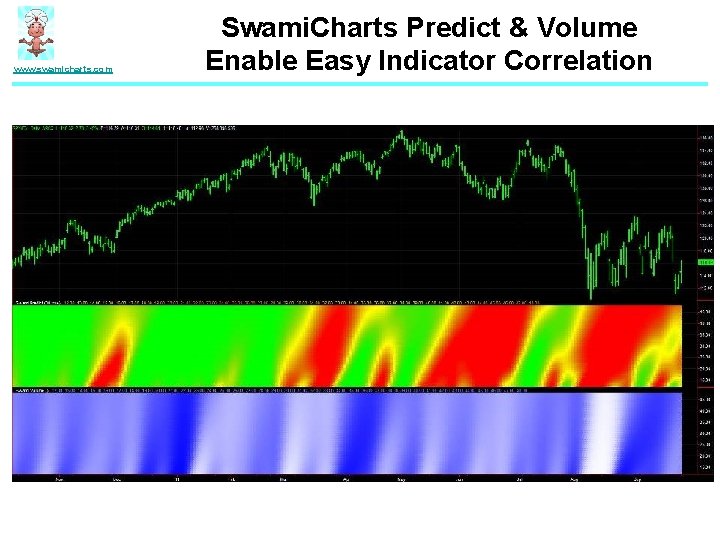
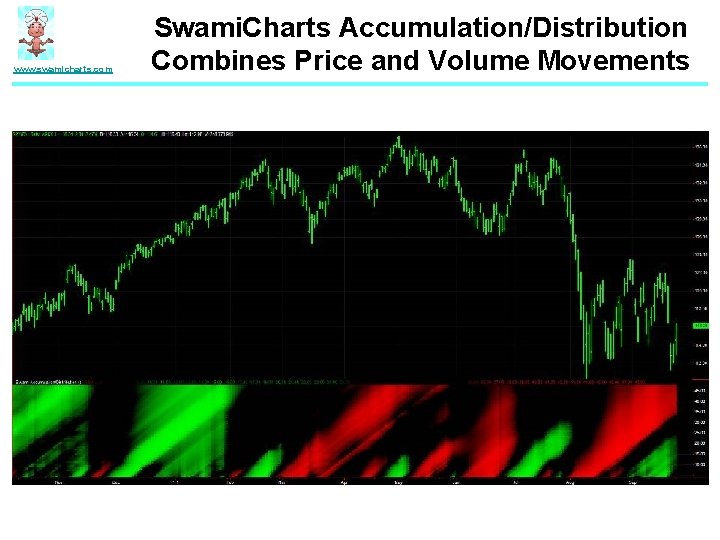
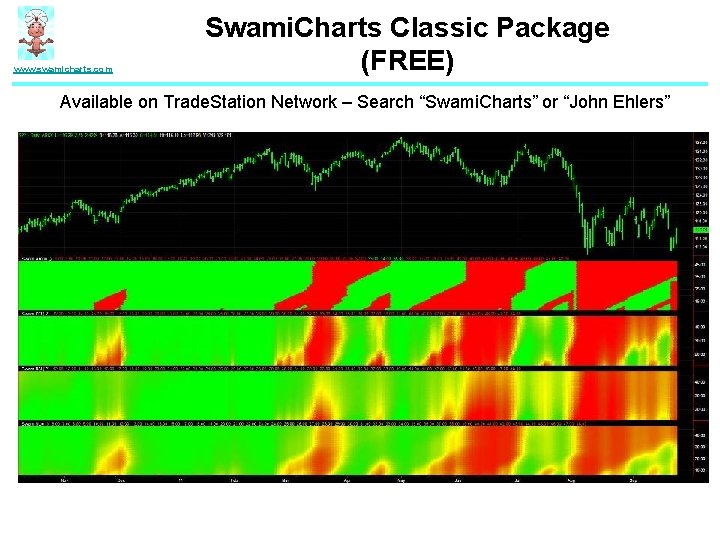
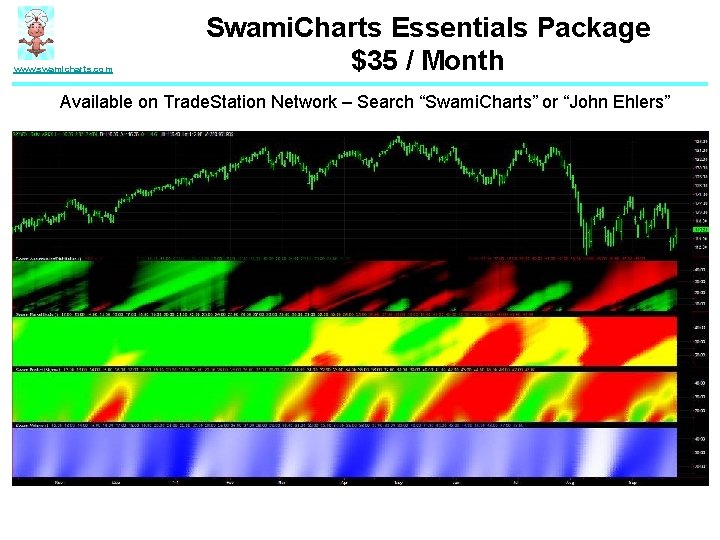
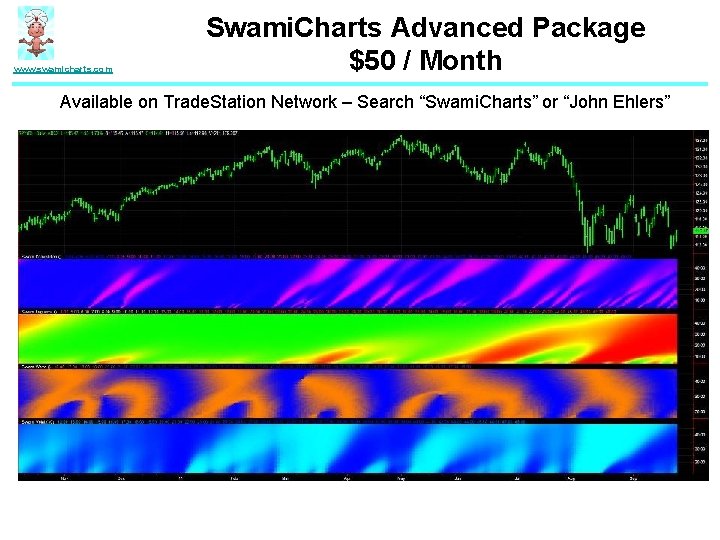
Swami. Charts Structure www. swamicharts. com • Swami. Charts are placed in subgraphs below the price chart – The indicators are in time sync with prices • Swami. Chart vertical scales are the lookback periods of the indicators • Colors represent indicator values over the range of time and lookback periods. Generally: – Green represents increasing values – Red represents decreasing values – Yellow represents intermediate values • Some Swami. Chart indicators have contrasting hues to maximize interpretation
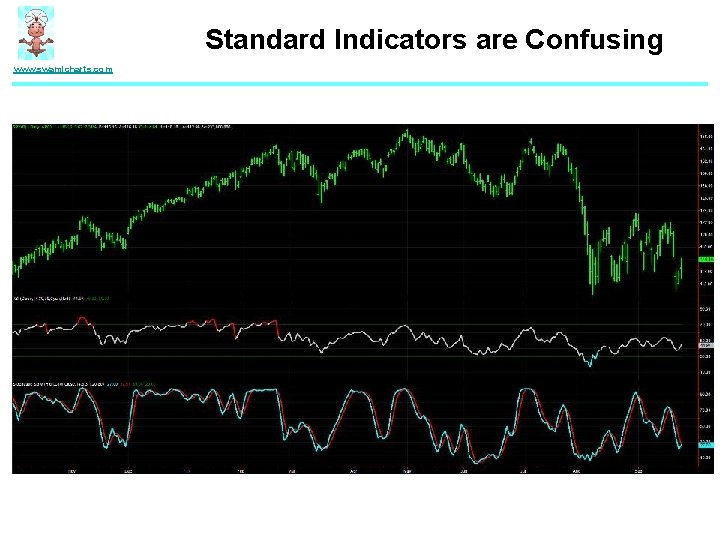
Standard Indicators are Confusing www. swamicharts. com
www. swamicharts. com Swami. Chart Indicators Give a Clear Interpretation
www. swamicharts. com Swami. Charts Predict is Superior to the Classic Stochastic
www. swamicharts. com Swami. Charts Predict & Volume Enable Easy Indicator Correlation
www. swamicharts. com Swami. Charts Accumulation/Distribution Combines Price and Volume Movements
www. swamicharts. com Swami. Charts Relative Performance Is Useful for Sector Rotation
www. swamicharts. com Swami. Charts Swing Wave Clarifies Complex Market Waves
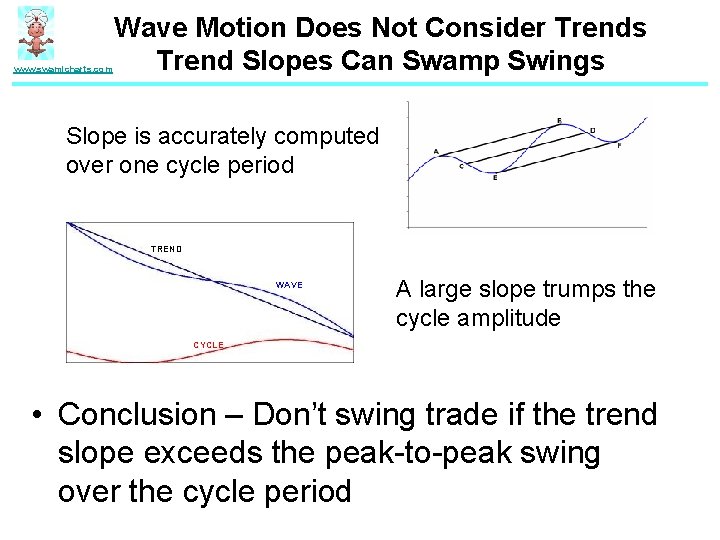
www. swamicharts. com Wave Motion Does Not Consider Trends Trend Slopes Can Swamp Swings Slope is accurately computed over one cycle period TREND WAVE A large slope trumps the cycle amplitude CYCLE • Conclusion – Don’t swing trade if the trend slope exceeds the peak-to-peak swing over the cycle period
www. swamicharts. com Swami. Charts Market Mode Identifies Trends Up/Down & Cycle Modes
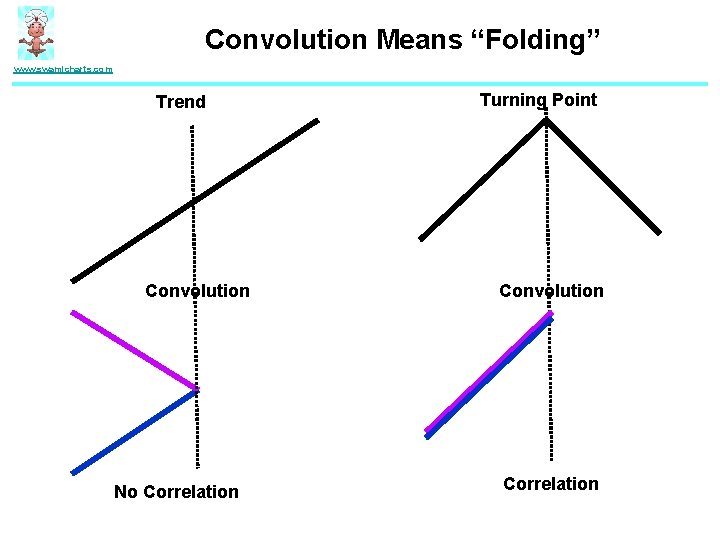
Convolution Means “Folding” www. swamicharts. com Trend Convolution No Correlation Turning Point Convolution Correlation
www. swamicharts. com Swami. Charts Convolution Pinpoints Major Turning Points
www. swamicharts. com Swami. Charts Classic Package (FREE) Available on Trade. Station Network – Search “Swami. Charts” or “John Ehlers”
www. swamicharts. com Swami. Charts Essentials Package $35 / Month Available on Trade. Station Network – Search “Swami. Charts” or “John Ehlers”
www. swamicharts. com Swami. Charts Advanced Package $50 / Month Available on Trade. Station Network – Search “Swami. Charts” or “John Ehlers”
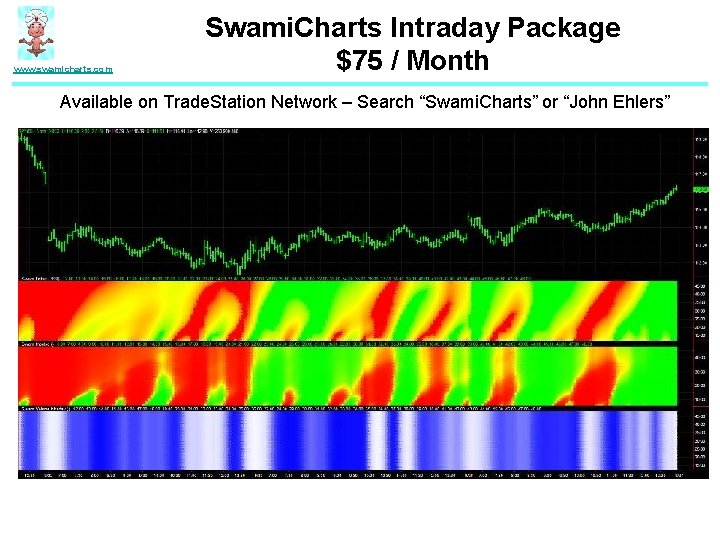
www. swamicharts. com Swami. Charts Intraday Package $75 / Month Available on Trade. Station Network – Search “Swami. Charts” or “John Ehlers”
www. swamicharts. com Your Portal to a New Trading Dimension
www. swamicharts. com
www. swamicharts. com