
www kdd uncc edu Polyphonic music information retrieval
- Slides: 57
www. kdd. uncc. edu Polyphonic music information retrieval based on multi-label cascade classification system http//: www. mir. uncc. edu presented by Zbigniew W. Ras University of North Carolina, Charlotte, NC College of Computing and Informatics
Polyphonic music information retrieval based on multi-label cascade classification system Student: Wenxin Jiang Advisor: Dr. Zbigniew W. Ras
Survey of MIRhttp: //mirsystems. info/index. php? id=mirsystems 43 MIR systems n Most are pitch estimation-based melody and rhythm match n n This presentation will focus on timbre estimation
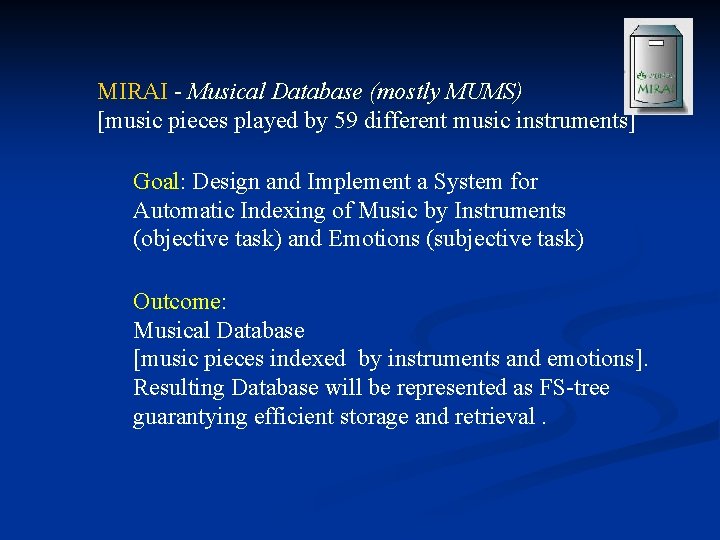
MIRAI - Musical Database (mostly MUMS) [music pieces played by 59 different music instruments] Goal: Design and Implement a System for Automatic Indexing of Music by Instruments (objective task) and Emotions (subjective task) Outcome: Musical Database [music pieces indexed by instruments and emotions]. Resulting Database will be represented as FS-tree guarantying efficient storage and retrieval.
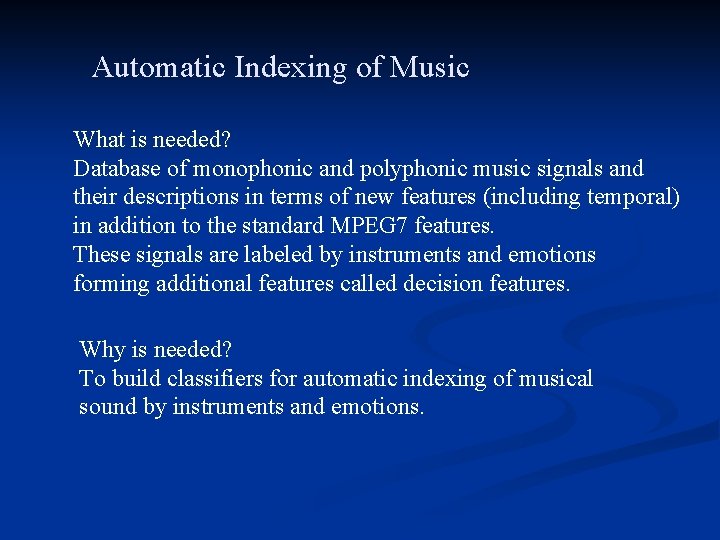
Automatic Indexing of Music What is needed? Database of monophonic and polyphonic music signals and their descriptions in terms of new features (including temporal) in addition to the standard MPEG 7 features. These signals are labeled by instruments and emotions forming additional features called decision features. Why is needed? To build classifiers for automatic indexing of musical sound by instruments and emotions.
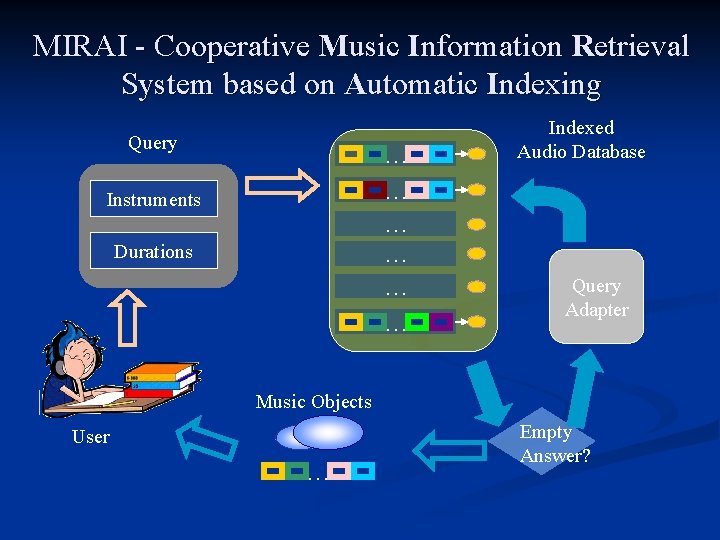
MIRAI - Cooperative Music Information Retrieval System based on Automatic Indexing Query … … … Instruments Durations Indexed Audio Database Query Adapter Music Objects User … Empty Answer?
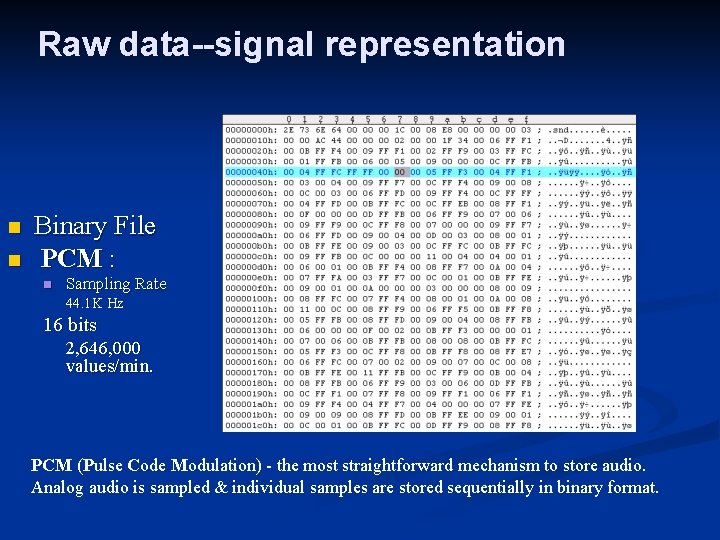
Raw data--signal representation n n Binary File PCM : n Sampling Rate 44. 1 K Hz 16 bits 2, 646, 000 values/min. PCM (Pulse Code Modulation) - the most straightforward mechanism to store audio. Analog audio is sampled & individual samples are stored sequentially in binary format.
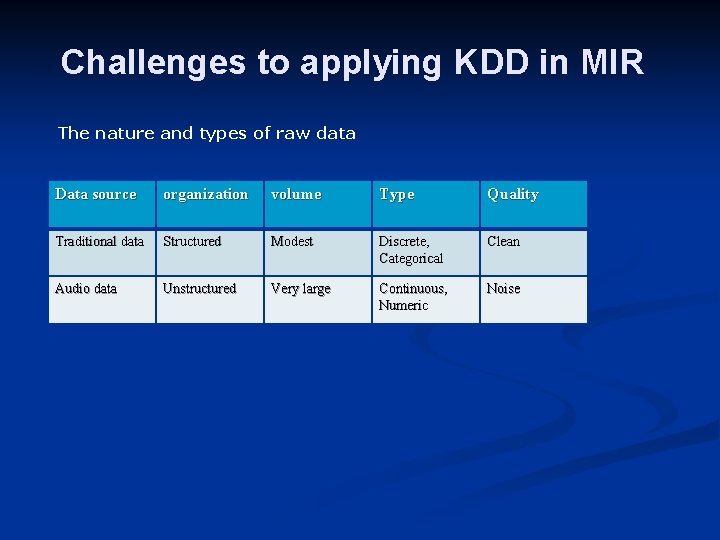
Challenges to applying KDD in MIR The nature and types of raw data Data source organization volume Type Quality Traditional data Structured Modest Discrete, Categorical Clean Audio data Unstructured Very large Continuous, Numeric Noise
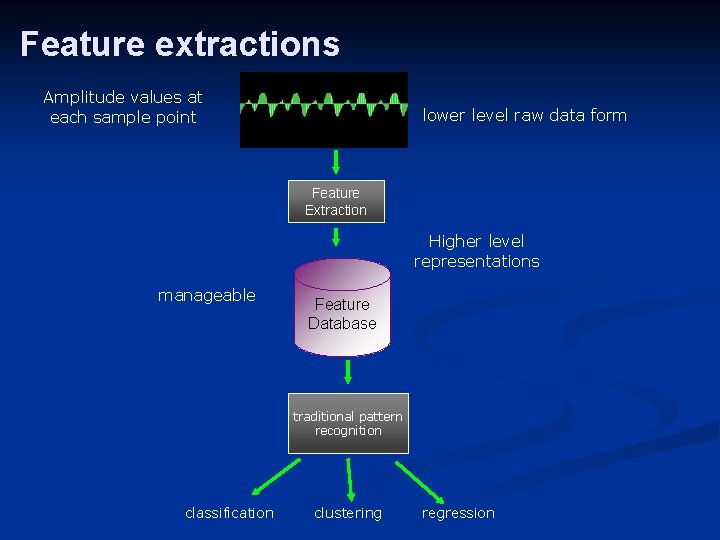
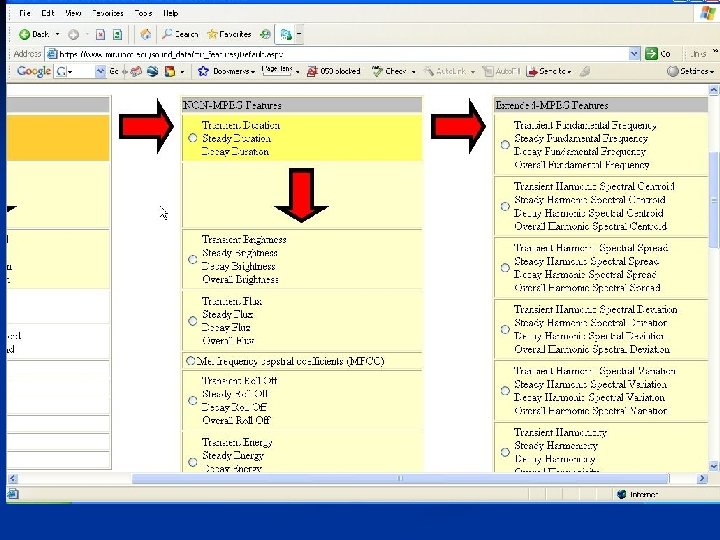
Feature extractions Amplitude values at each sample point lower level raw data form Feature Extraction Higher level representations manageable Feature Database traditional pattern recognition classification clustering regression
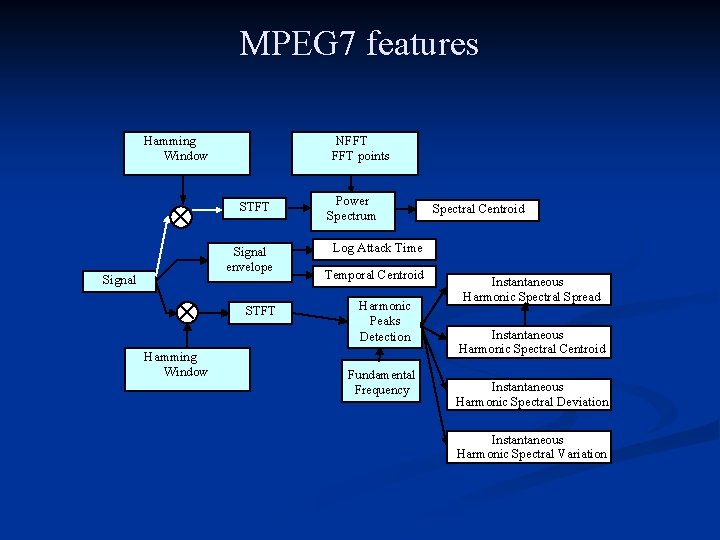
MPEG 7 features Hamming Window NFFT points STFT Signal envelope Signal STFT Hamming Window Power Spectrum Spectral Centroid Log Attack Time Temporal Centroid Harmonic Peaks Detection Fundamental Frequency Instantaneous Harmonic Spectral Spread Instantaneous Harmonic Spectral Centroid Instantaneous Harmonic Spectral Deviation Instantaneous Harmonic Spectral Variation
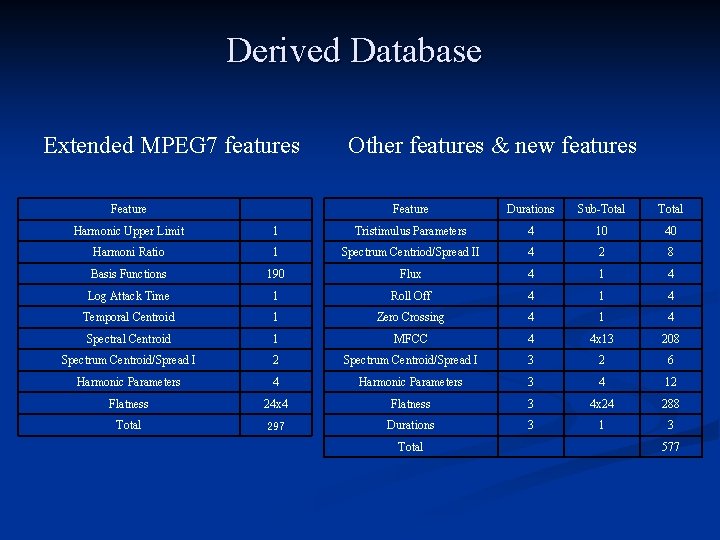
Derived Database Extended MPEG 7 features Feature Other features & new features Feature Durations Sub-Total Harmonic Upper Limit 1 Tristimulus Parameters 4 10 40 Harmoni Ratio 1 Spectrum Centriod/Spread II 4 2 8 Basis Functions 190 Flux 4 1 4 Log Attack Time 1 Roll Off 4 1 4 Temporal Centroid 1 Zero Crossing 4 1 4 Spectral Centroid 1 MFCC 4 4 x 13 208 Spectrum Centroid/Spread I 2 Spectrum Centroid/Spread I 3 2 6 Harmonic Parameters 4 Harmonic Parameters 3 4 12 Flatness 24 x 4 Flatness 3 4 x 24 288 Total 297 Durations 3 1 3 Total 577
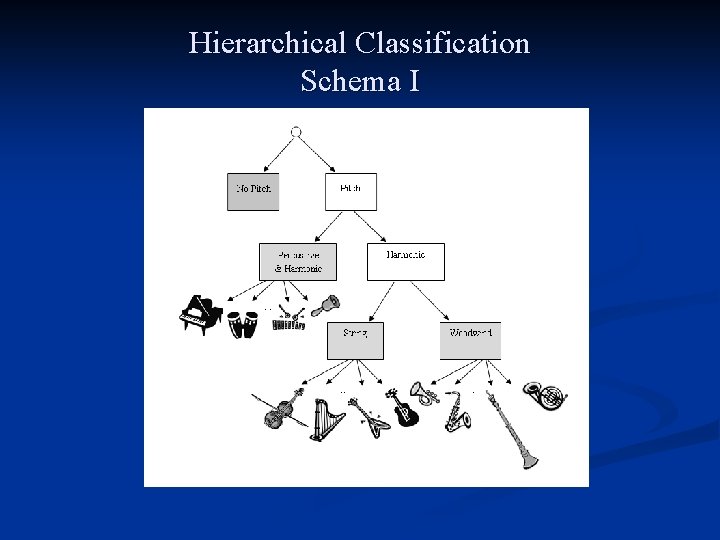
Hierarchical Classification Schema I
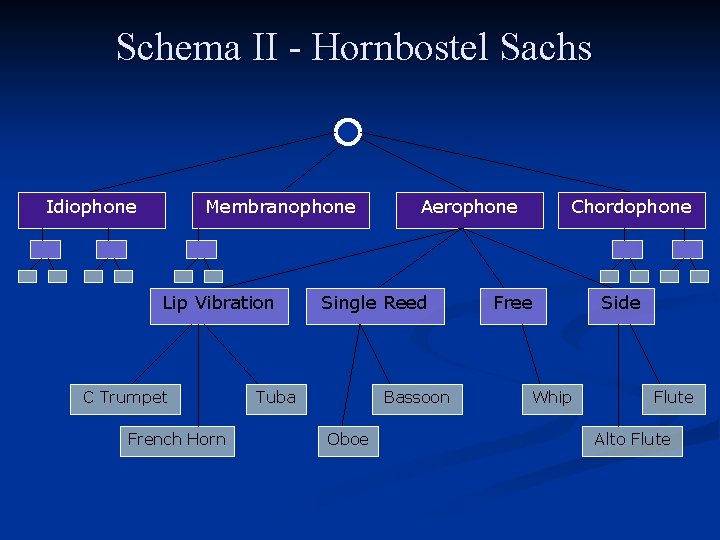
Schema II - Hornbostel Sachs Idiophone Membranophone Lip Vibration C Trumpet French Horn Aerophone Single Reed Tuba Bassoon Oboe Chordophone Free Whip Side Flute Alto Flute
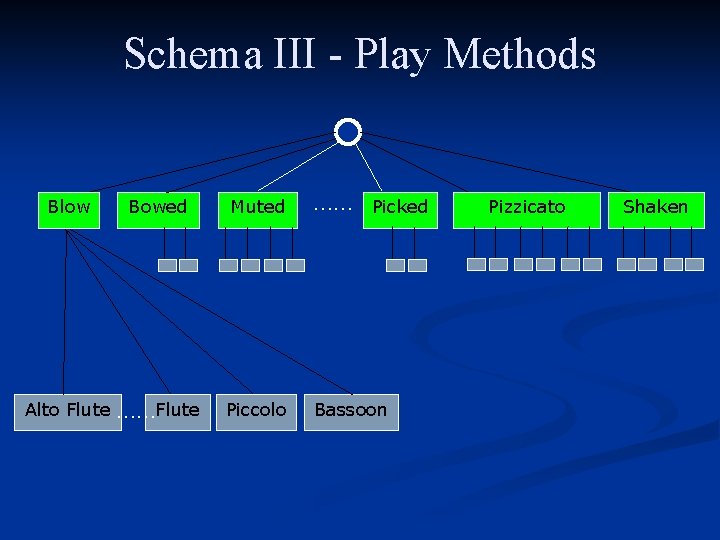
Schema III - Play Methods Blow Bowed Alto Flute ……Flute Muted …… Picked Piccolo Bassoon Pizzicato Shaken
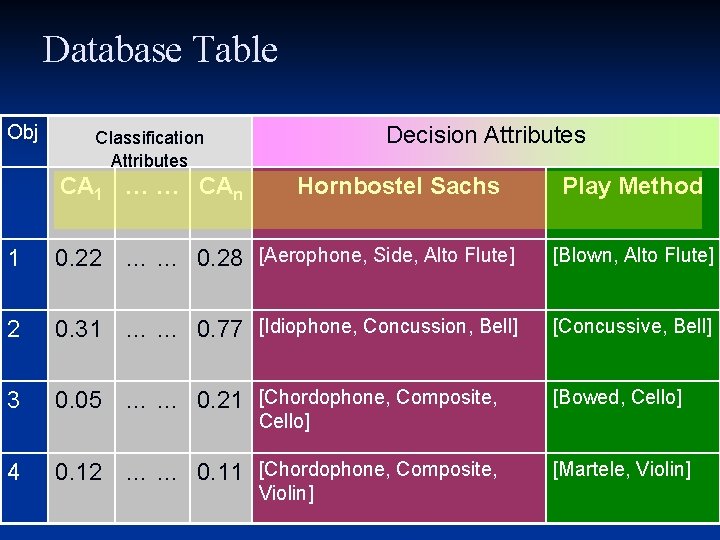
Database Table Obj Decision Attributes Classification Attributes CA 1 … … CAn Hornbostel Sachs Play Method 1 0. 22 … … 0. 28 [Aerophone, Side, Alto Flute] [Blown, Alto Flute] 2 0. 31 … … 0. 77 [Idiophone, Concussion, Bell] [Concussive, Bell] 3 0. 05 … … 0. 21 [Chordophone, Composite, [Bowed, Cello] 4 0. 12 … … 0. 11 [Chordophone, Composite, [Martele, Violin] Cello] Violin] 17 Xin Cynthia Zhang 17
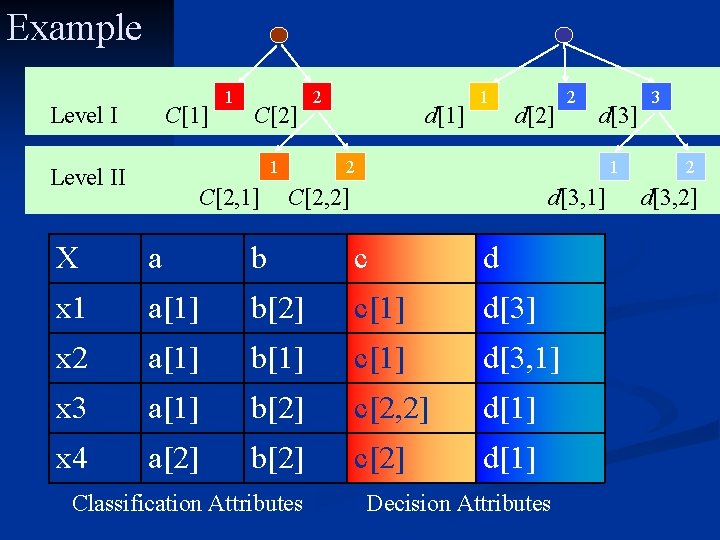
Example Level I C[1] 1 C[2] 1 Level II C[2, 1] 2 d[1] 1 d[2] 2 d[3] 2 1 C[2, 2] d[3, 1] X a b c d x 1 a[1] b[2] c[1] d[3] x 2 a[1] b[1] c[1] d[3, 1] x 3 a[1] b[2] c[2, 2] d[1] x 4 a[2] b[2] c[2] d[1] Classification Attributes Decision Attributes 3 2 d[3, 2]
Classification 90% training, 10% testing. l 10 folds. l Hierarchical (Schema I) vs none hierarchical. l Compare with different classifiers. – J 48 tree – Naïve Baysian l
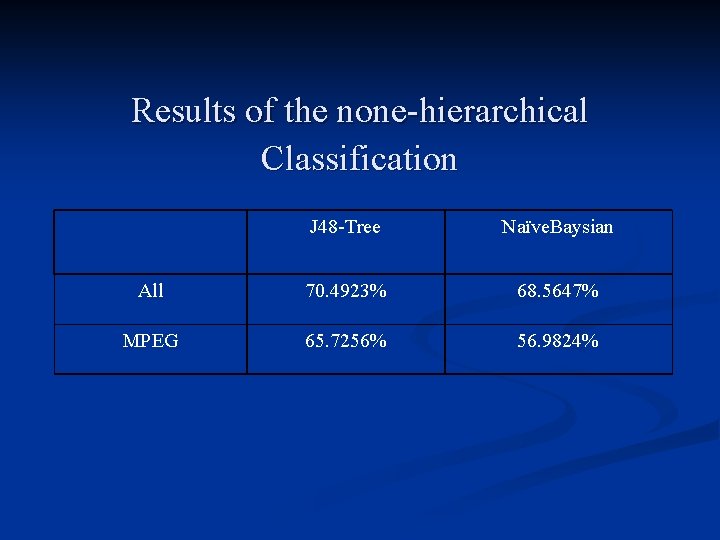
Results of the none-hierarchical Classification J 48 -Tree Naïve. Baysian All 70. 4923% 68. 5647% MPEG 65. 7256% 56. 9824%
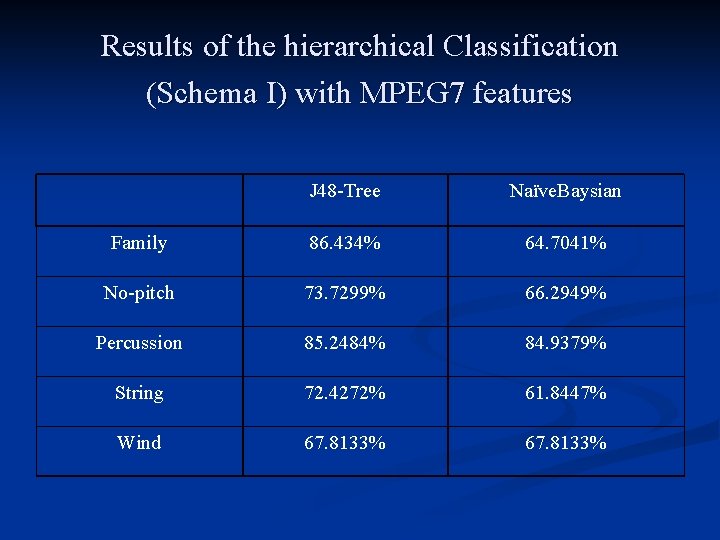
Results of the hierarchical Classification (Schema I) with MPEG 7 features J 48 -Tree Naïve. Baysian Family 86. 434% 64. 7041% No-pitch 73. 7299% 66. 2949% Percussion 85. 2484% 84. 9379% String 72. 4272% 61. 8447% Wind 67. 8133%
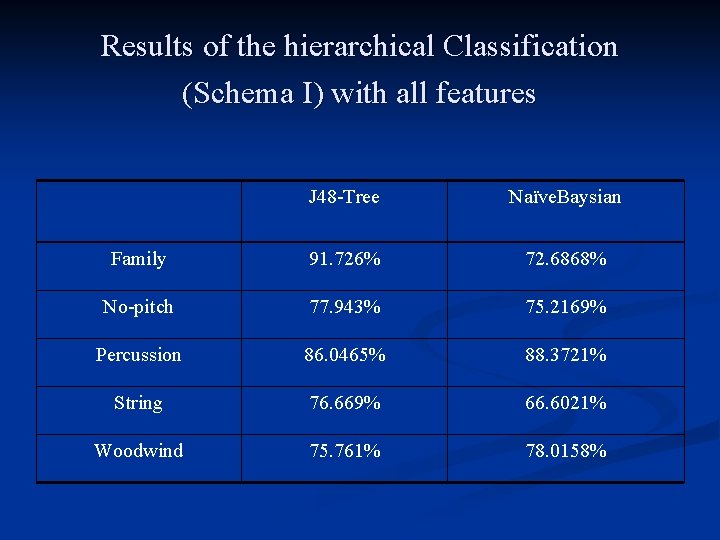
Results of the hierarchical Classification (Schema I) with all features J 48 -Tree Naïve. Baysian Family 91. 726% 72. 6868% No-pitch 77. 943% 75. 2169% Percussion 86. 0465% 88. 3721% String 76. 669% 66. 6021% Woodwind 75. 761% 78. 0158%
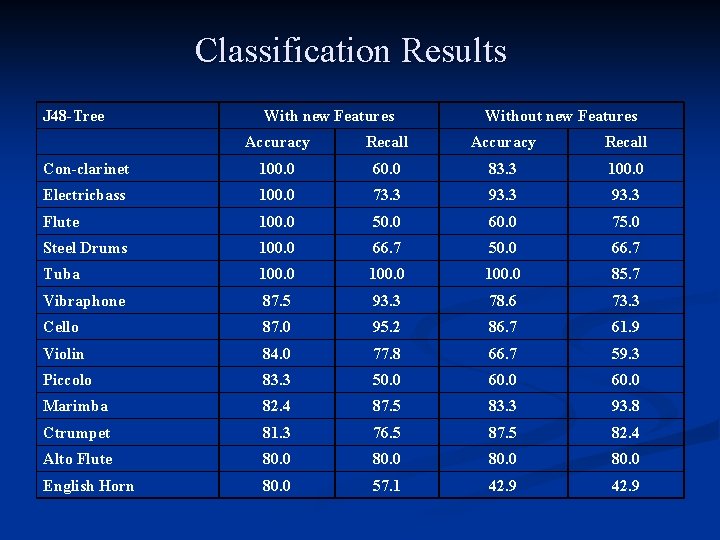
Classification Results J 48 -Tree With new Features Without new Features Accuracy Recall Con-clarinet 100. 0 60. 0 83. 3 100. 0 Electricbass 100. 0 73. 3 93. 3 Flute 100. 0 50. 0 60. 0 75. 0 Steel Drums 100. 0 66. 7 50. 0 66. 7 Tuba 100. 0 85. 7 Vibraphone 87. 5 93. 3 78. 6 73. 3 Cello 87. 0 95. 2 86. 7 61. 9 Violin 84. 0 77. 8 66. 7 59. 3 Piccolo 83. 3 50. 0 60. 0 Marimba 82. 4 87. 5 83. 3 93. 8 Ctrumpet 81. 3 76. 5 87. 5 82. 4 Alto Flute 80. 0 English Horn 80. 0 57. 1 42. 9
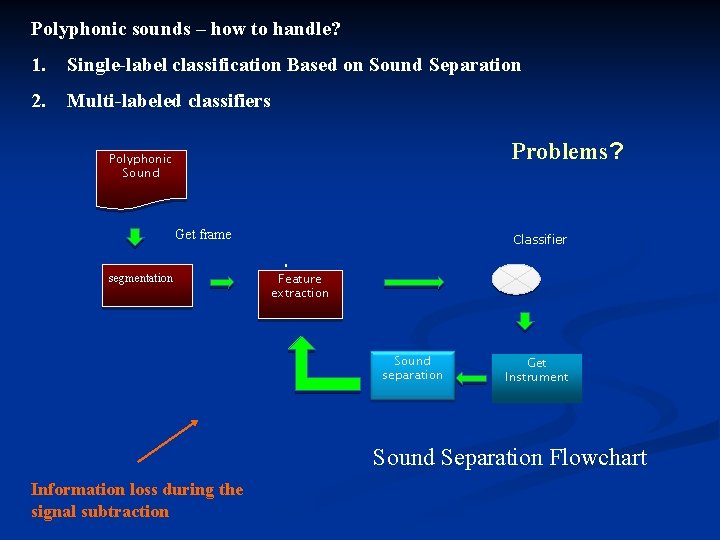
Polyphonic sounds – how to handle? 1. Single-label classification Based on Sound Separation 2. Multi-labeled classifiers Problems? Polyphonic Sound Get frame Classifier . segmentation Feature extraction Sound separation Get Instrument Sound Separation Flowchart Information loss during the signal subtraction
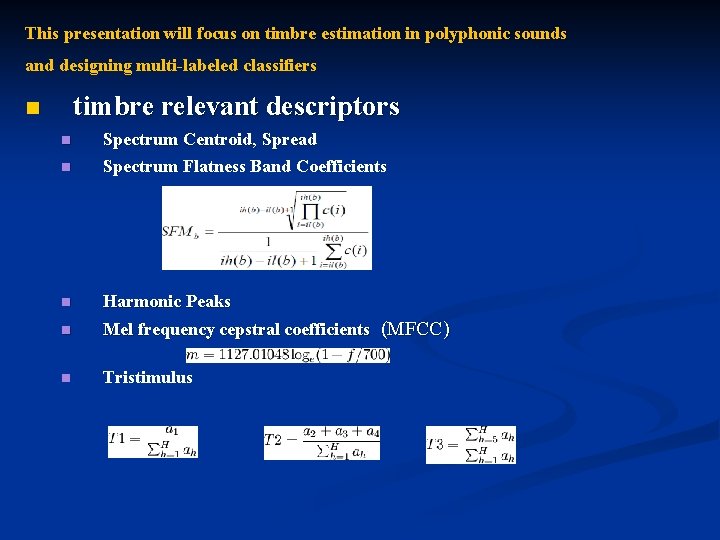
This presentation will focus on timbre estimation in polyphonic sounds and designing multi-labeled classifiers timbre relevant descriptors n n Spectrum Centroid, Spread Spectrum Flatness Band Coefficients n Harmonic Peaks n Mel frequency cepstral coefficients (MFCC) n Tristimulus n
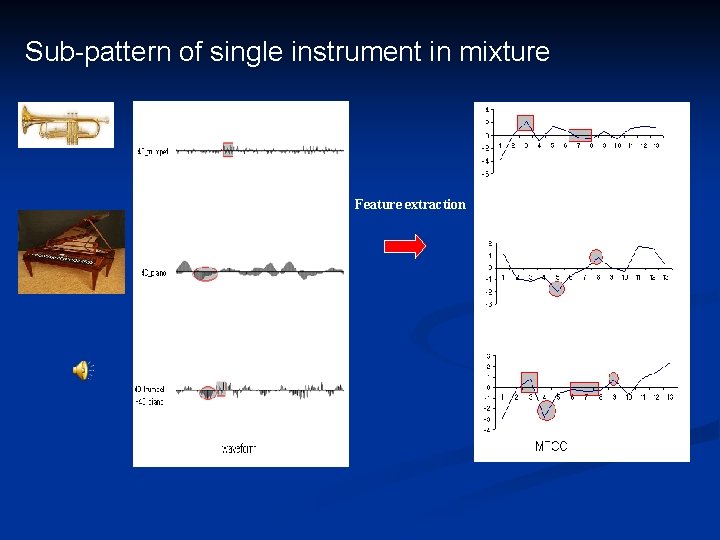
Sub-pattern of single instrument in mixture Feature extraction
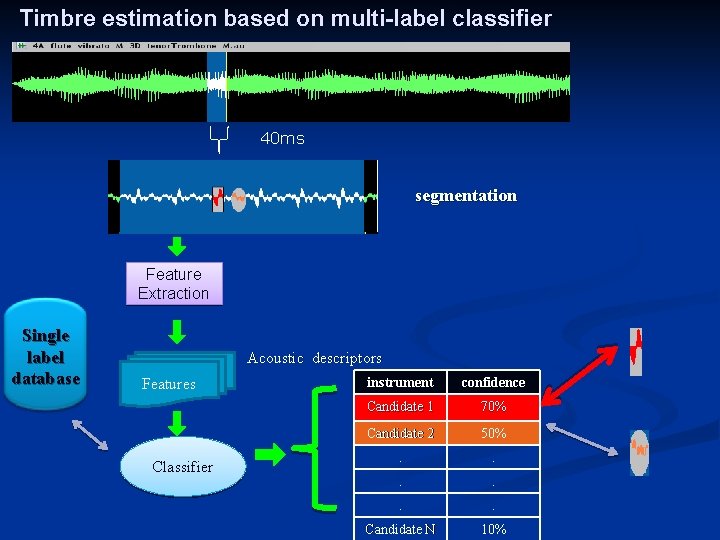
Timbre estimation based on multi-label classifier 40 ms segmentation Feature Extraction Single label database Acoustic descriptors Features Classifier instrument confidence Candidate 1 70% Candidate 2 50% . . . Candidate N 10%
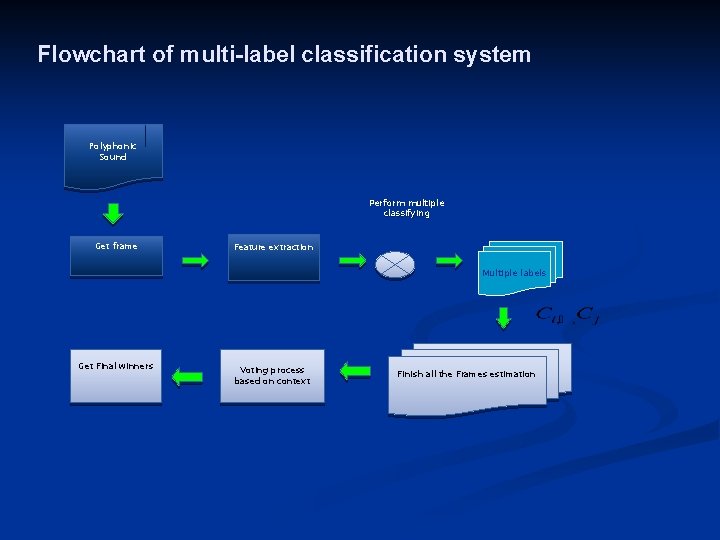
Flowchart of multi-label classification system Polyphonic Sound Perform multiple classifying Get frame Feature extraction Multiple labels Get Final winners Voting process based on context Finish all the Frames estimation
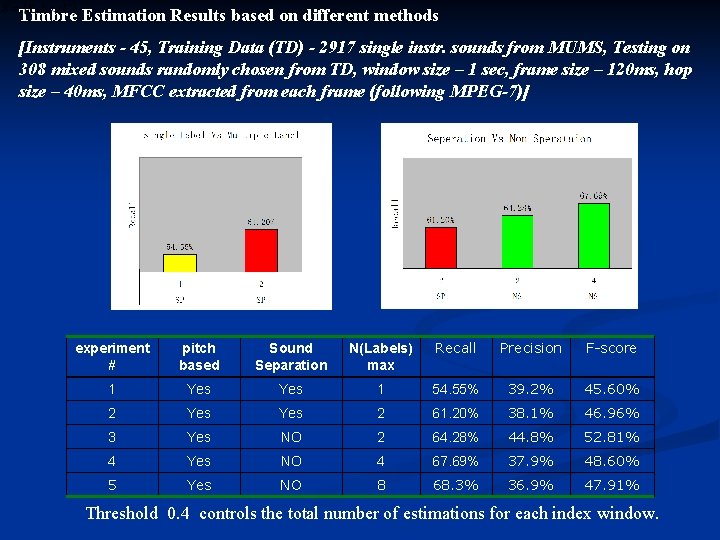
Timbre Estimation Results based on different methods [Instruments - 45, Training Data (TD) - 2917 single instr. sounds from MUMS, Testing on 308 mixed sounds randomly chosen from TD, window size – 1 sec, frame size – 120 ms, hop size – 40 ms, MFCC extracted from each frame (following MPEG-7)] experiment # pitch based Sound Separation N(Labels) max Recall Precision F-score 1 Yes 1 54. 55% 39. 2% 45. 60% 2 Yes 2 61. 20% 38. 1% 46. 96% 3 Yes NO 2 64. 28% 44. 8% 52. 81% 4 Yes NO 4 67. 69% 37. 9% 48. 60% 5 Yes NO 8 68. 3% 36. 9% 47. 91% Threshold 0. 4 controls the total number of estimations for each index window.
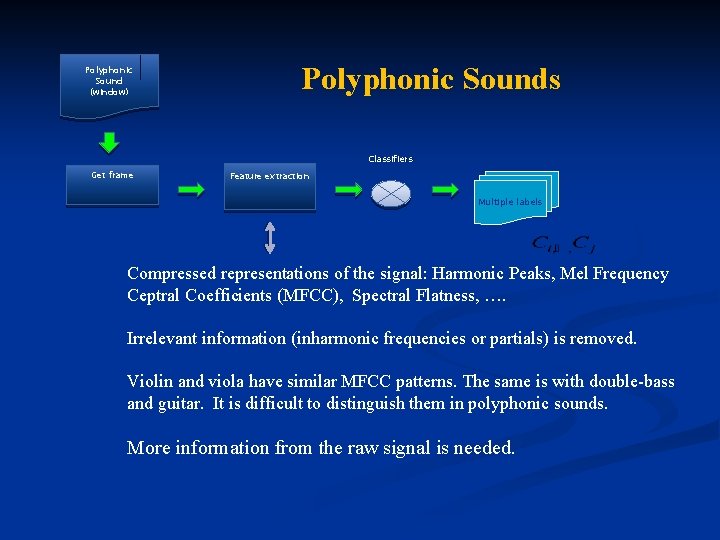
Polyphonic Sound (window) Polyphonic Sounds Classifiers Get frame Feature extraction Multiple labels Compressed representations of the signal: Harmonic Peaks, Mel Frequency Ceptral Coefficients (MFCC), Spectral Flatness, …. Irrelevant information (inharmonic frequencies or partials) is removed. Violin and viola have similar MFCC patterns. The same is with double-bass and guitar. It is difficult to distinguish them in polyphonic sounds. More information from the raw signal is needed.
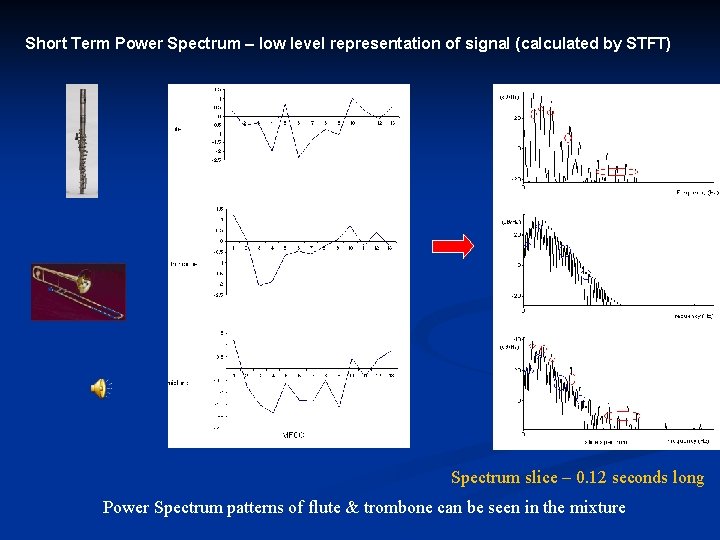
Short Term Power Spectrum – low level representation of signal (calculated by STFT) Spectrum slice – 0. 12 seconds long Power Spectrum patterns of flute & trombone can be seen in the mixture
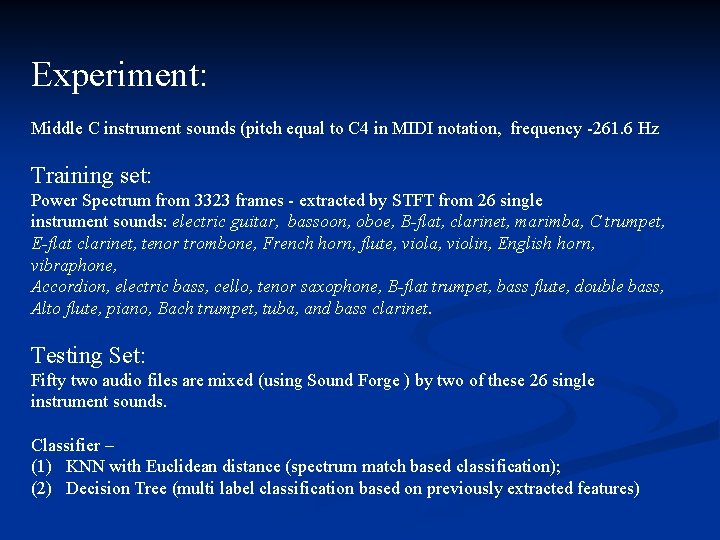
Experiment: Middle C instrument sounds (pitch equal to C 4 in MIDI notation, frequency -261. 6 Hz Training set: Power Spectrum from 3323 frames - extracted by STFT from 26 single instrument sounds: electric guitar, bassoon, oboe, B-flat, clarinet, marimba, C trumpet, E-flat clarinet, tenor trombone, French horn, flute, viola, violin, English horn, vibraphone, Accordion, electric bass, cello, tenor saxophone, B-flat trumpet, bass flute, double bass, Alto flute, piano, Bach trumpet, tuba, and bass clarinet. Testing Set: Fifty two audio files are mixed (using Sound Forge ) by two of these 26 single instrument sounds. Classifier – (1) KNN with Euclidean distance (spectrum match based classification); (2) Decision Tree (multi label classification based on previously extracted features)
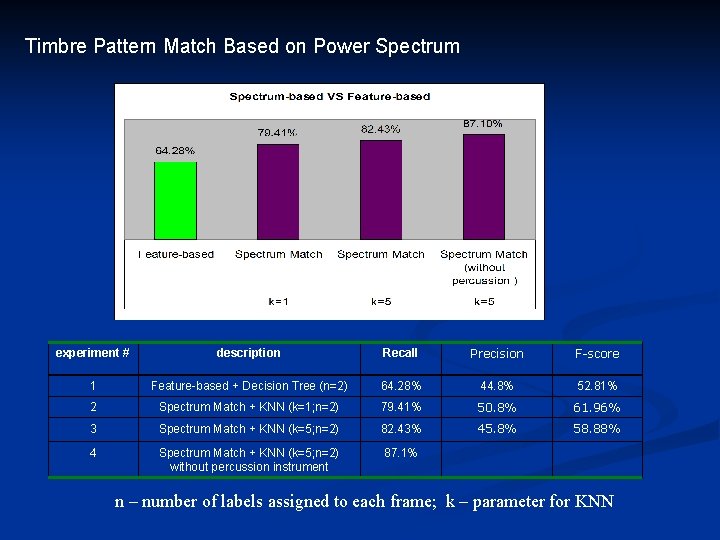
Timbre Pattern Match Based on Power Spectrum experiment # description Recall Precision F-score 1 Feature-based + Decision Tree (n=2) 64. 28% 44. 8% 52. 81% 2 Spectrum Match + KNN (k=1; n=2) 79. 41% 50. 8% 61. 96% 3 Spectrum Match + KNN (k=5; n=2) 82. 43% 45. 8% 58. 88% 4 Spectrum Match + KNN (k=5; n=2) without percussion instrument 87. 1% n – number of labels assigned to each frame; k – parameter for KNN
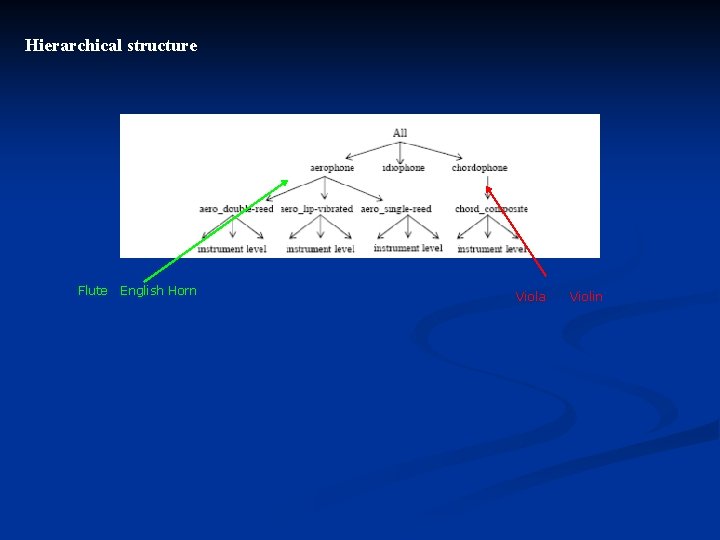
Hierarchical structure Flute English Horn Viola Violin
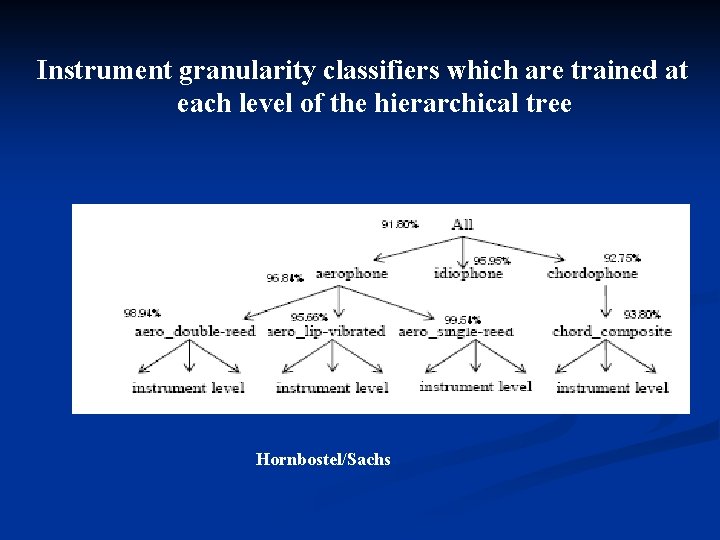
Instrument granularity classifiers which are trained at each level of the hierarchical tree Hornbostel/Sachs
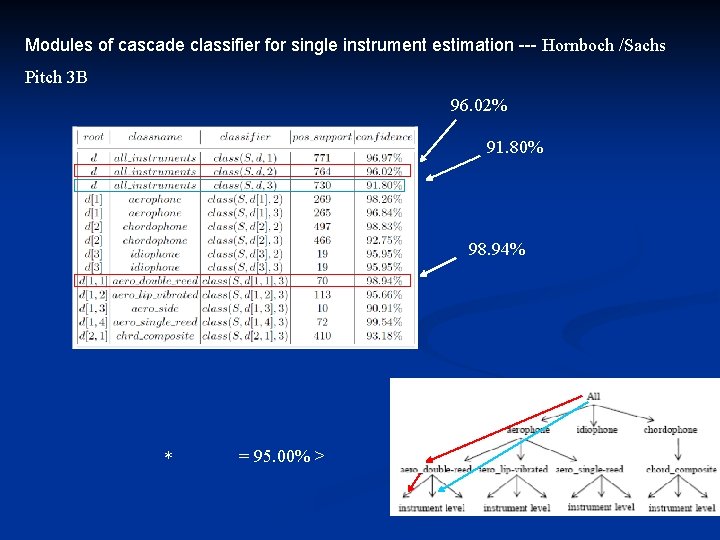
Modules of cascade classifier for single instrument estimation --- Hornboch /Sachs Pitch 3 B 96. 02% 91. 80% 98. 94% = 95. 00% > *
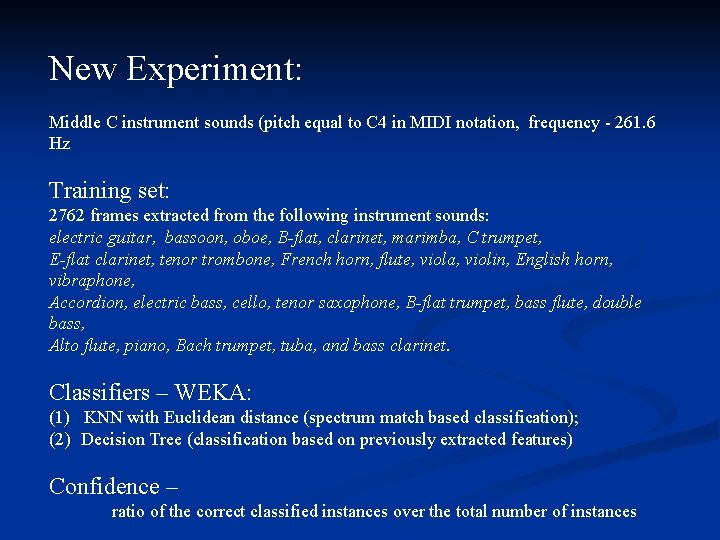
New Experiment: Middle C instrument sounds (pitch equal to C 4 in MIDI notation, frequency - 261. 6 Hz Training set: 2762 frames extracted from the following instrument sounds: electric guitar, bassoon, oboe, B-flat, clarinet, marimba, C trumpet, E-flat clarinet, tenor trombone, French horn, flute, viola, violin, English horn, vibraphone, Accordion, electric bass, cello, tenor saxophone, B-flat trumpet, bass flute, double bass, Alto flute, piano, Bach trumpet, tuba, and bass clarinet. Classifiers – WEKA: (1) KNN with Euclidean distance (spectrum match based classification); (2) Decision Tree (classification based on previously extracted features) Confidence – ratio of the correct classified instances over the total number of instances
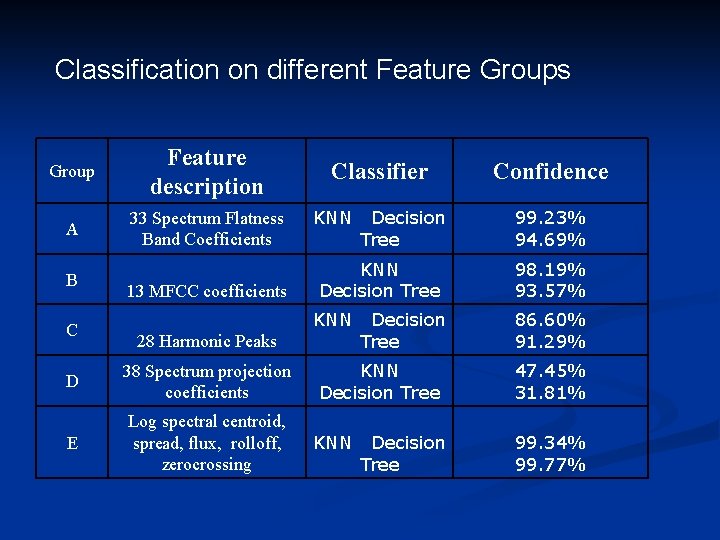
Classification on different Feature Groups Group Feature description A 33 Spectrum Flatness Band Coefficients B C 13 MFCC coefficients Classifier KNN Decision Tree KNN 28 Harmonic Peaks D 38 Spectrum projection coefficients E Log spectral centroid, spread, flux, rolloff, zerocrossing Decision Tree KNN Decision Tree Confidence 99. 23% 94. 69% 98. 19% 93. 57% 86. 60% 91. 29% 47. 45% 31. 81% 99. 34% 99. 77%
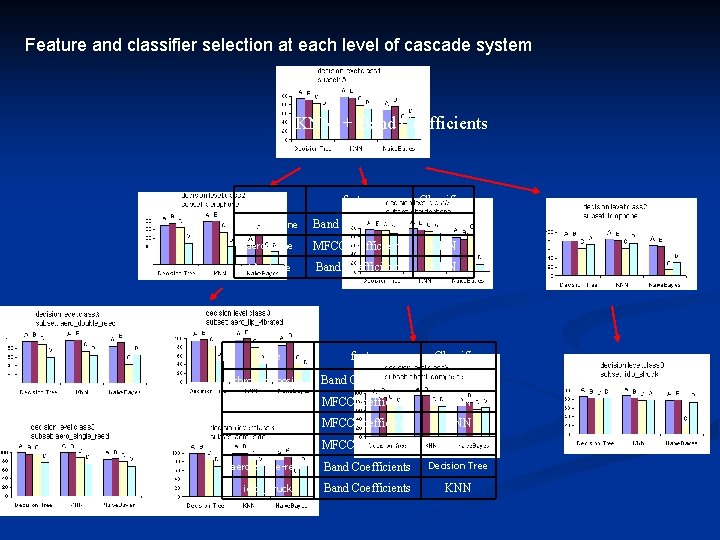
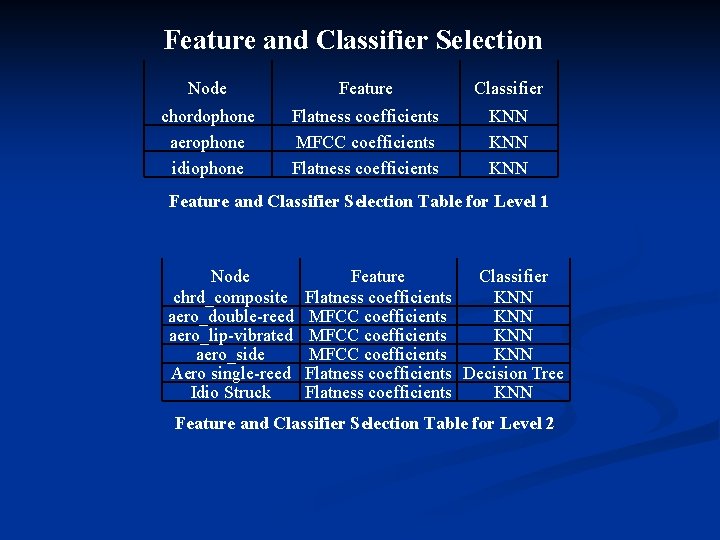
Feature and classifier selection at each level of cascade system KNN + Band Coefficients Node feature Classifier chordophone Band Coefficients KNN aerophone MFCC coefficients KNN idiophone Band Coefficients KNN Node feature Classifier chrd_composite Band Coefficients KNN aero_double-reed MFCC coefficients KNN aero_lip-vibrated MFCC coefficients KNN aero_side MFCC coefficients KNN aero_single-reed Band Coefficients Decision Tree idio_struck Band Coefficients KNN
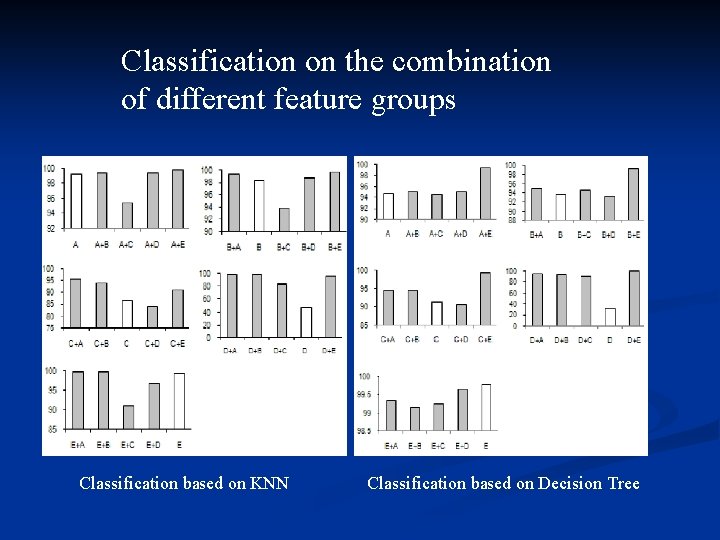
Classification on the combination of different feature groups Classification based on KNN Classification based on Decision Tree
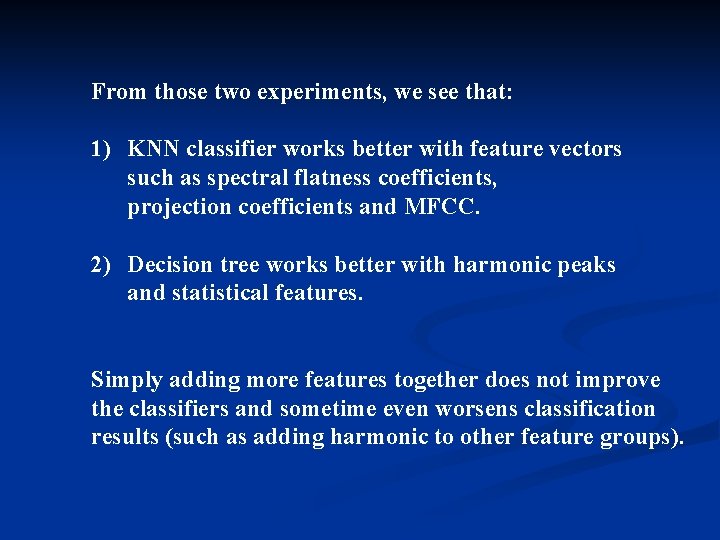
From those two experiments, we see that: 1) KNN classifier works better with feature vectors such as spectral flatness coefficients, projection coefficients and MFCC. 2) Decision tree works better with harmonic peaks and statistical features. Simply adding more features together does not improve the classifiers and sometime even worsens classification results (such as adding harmonic to other feature groups).
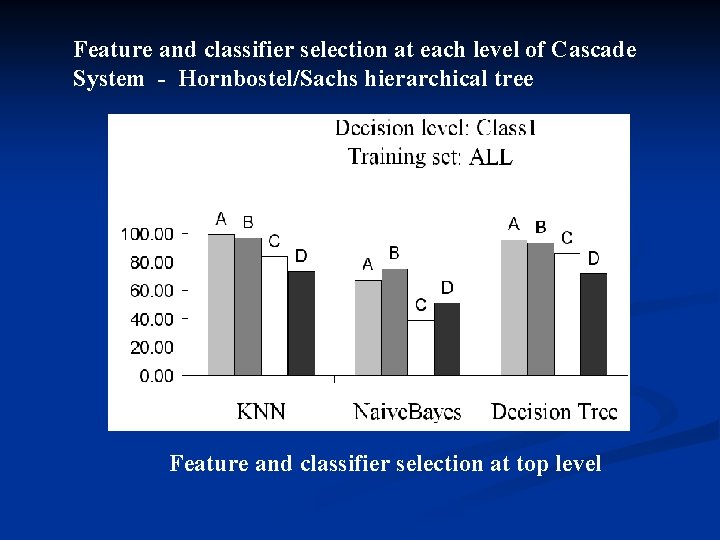
Feature and classifier selection at each level of Cascade System - Hornbostel/Sachs hierarchical tree Feature and classifier selection at top level
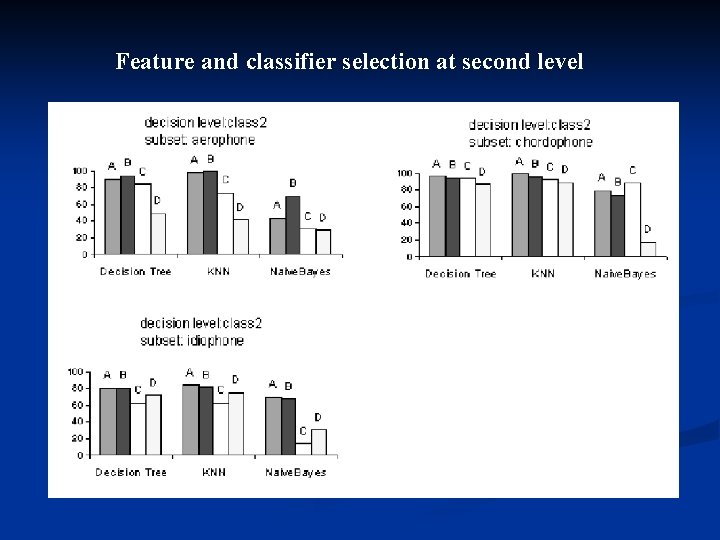
Feature and classifier selection at second level
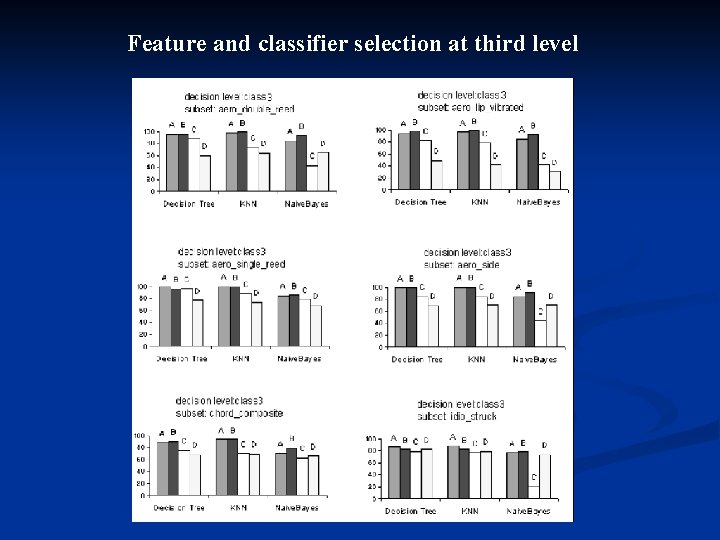
Feature and classifier selection at third level
Feature and Classifier Selection Node Feature Classifier chordophone aerophone idiophone Flatness coefficients MFCC coefficients Flatness coefficients KNN KNN Feature and Classifier Selection Table for Level 1 Node chrd_composite aero_double-reed aero_lip-vibrated aero_side Aero single-reed Idio Struck Feature Classifier Flatness coefficients KNN MFCC coefficients KNN Flatness coefficients Decision Tree Flatness coefficients KNN Feature and Classifier Selection Table for Level 2
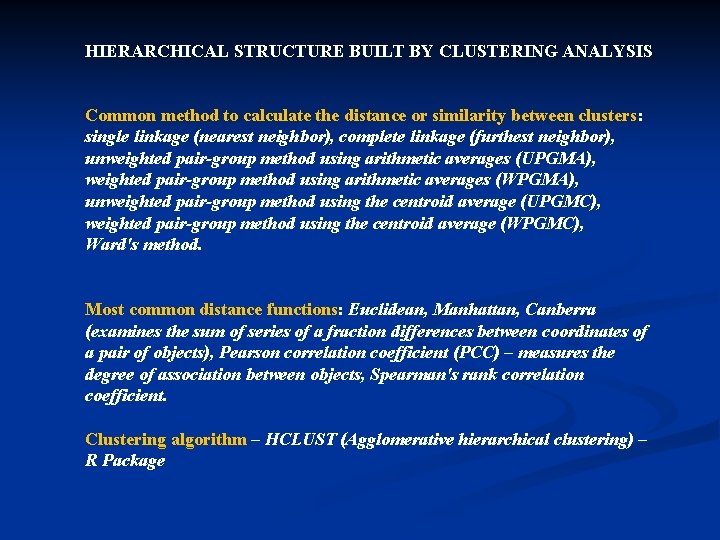
HIERARCHICAL STRUCTURE BUILT BY CLUSTERING ANALYSIS Common method to calculate the distance or similarity between clusters: single linkage (nearest neighbor), complete linkage (furthest neighbor), unweighted pair-group method using arithmetic averages (UPGMA), weighted pair-group method using arithmetic averages (WPGMA), unweighted pair-group method using the centroid average (UPGMC), weighted pair-group method using the centroid average (WPGMC), Ward's method. Most common distance functions: Euclidean, Manhattan, Canberra (examines the sum of series of a fraction differences between coordinates of a pair of objects), Pearson correlation coefficient (PCC) – measures the degree of association between objects, Spearman's rank correlation coefficient. Clustering algorithm – HCLUST (Agglomerative hierarchical clustering) – R Package
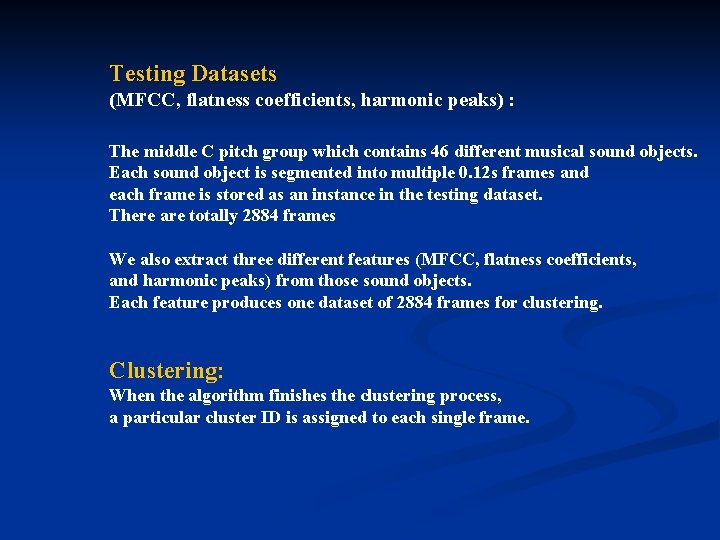
Testing Datasets (MFCC, flatness coefficients, harmonic peaks) : The middle C pitch group which contains 46 different musical sound objects. Each sound object is segmented into multiple 0. 12 s frames and each frame is stored as an instance in the testing dataset. There are totally 2884 frames We also extract three different features (MFCC, flatness coefficients, and harmonic peaks) from those sound objects. Each feature produces one dataset of 2884 frames for clustering. Clustering: When the algorithm finishes the clustering process, a particular cluster ID is assigned to each single frame.
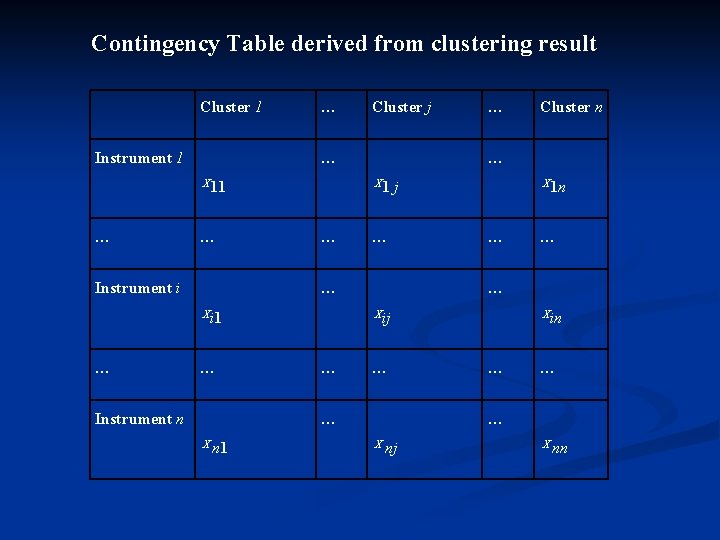
Contingency Table derived from clustering result Cluster 1 Instrument 1 … … X 11 … … Instrument i … j … … … Instrument n X 1 n … Xij … Cluster n … … X n 1 … … X 1 Xi 1 … Cluster j Xin … … … X nj X nn
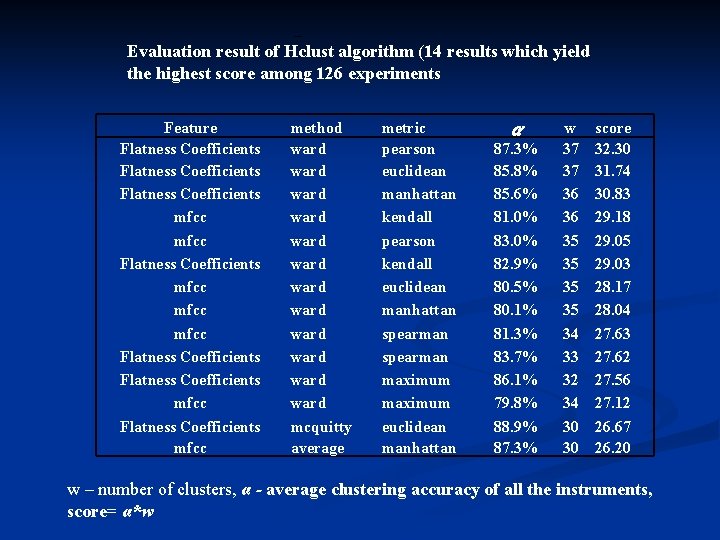
Evaluation result of Hclust algorithm (14 results which yield the highest score among 126 experiments Feature Flatness Coefficients mfcc mfcc Flatness Coefficients mfcc method ward ward ward mcquitty average metric pearson euclidean manhattan kendall pearson kendall euclidean manhattan spearman maximum euclidean manhattan α 87. 3% 85. 8% 85. 6% 81. 0% 83. 0% 82. 9% 80. 5% 80. 1% 81. 3% 83. 7% 86. 1% 79. 8% 88. 9% 87. 3% w 37 37 36 36 35 35 34 33 32 34 30 30 score 32. 30 31. 74 30. 83 29. 18 29. 05 29. 03 28. 17 28. 04 27. 63 27. 62 27. 56 27. 12 26. 67 26. 20 w – number of clusters, α - average clustering accuracy of all the instruments, score= α*w
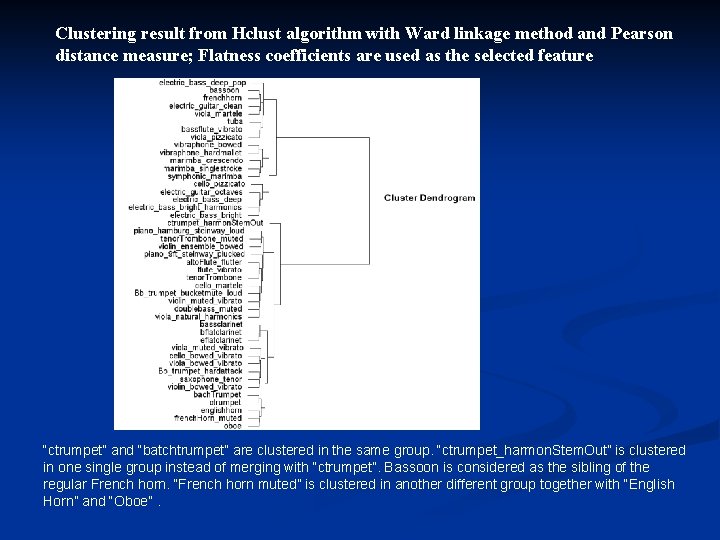
Clustering result from Hclust algorithm with Ward linkage method and Pearson distance measure; Flatness coefficients are used as the selected feature “ctrumpet” and “batchtrumpet” are clustered in the same group. “ctrumpet_harmon. Stem. Out” is clustered in one single group instead of merging with “ctrumpet”. Bassoon is considered as the sibling of the regular French horn. “French horn muted” is clustered in another different group together with “English Horn” and “Oboe”.
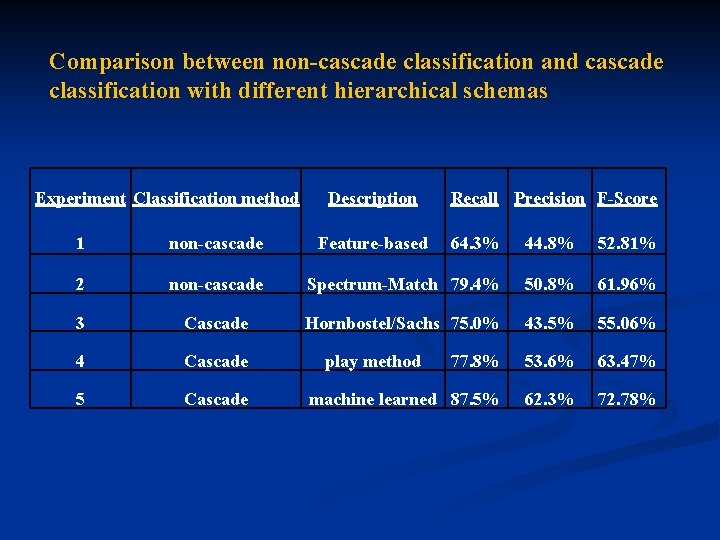
Comparison between non-cascade classification and cascade classification with different hierarchical schemas Experiment Classification method 1 non-cascade 2 Description Feature-based Recall Precision F-Score 64. 3% 44. 8% 52. 81% non-cascade Spectrum-Match 79. 4% 50. 8% 61. 96% 3 Cascade Hornbostel/Sachs 75. 0% 43. 5% 55. 06% 4 Cascade 77. 8% 53. 6% 63. 47% 5 Cascade machine learned 87. 5% 62. 3% 72. 78% play method
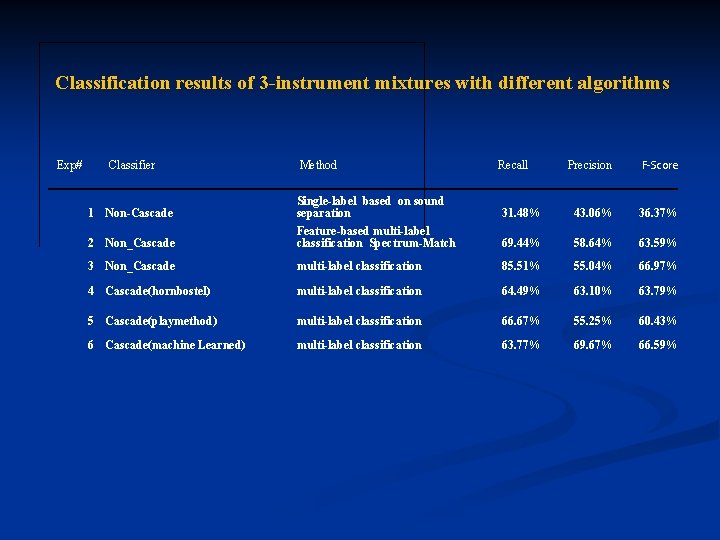
We evaluate the classification system by the mixture sounds which contain two single instrument sounds. We also create 49 polyphonic sounds by randomly selecting three different single instrument sounds and mixing them together. We then test those three-instrument mixtures with five different classification methods (experiment 2 to 6) which are described in the previous two-instrument mixture experiments. Single-label classification based on the sound separation method is also tested on the mixtures (experiment 1). KNN (k=3) is used as the classifier for each experiment.
Classification results of 3 -instrument mixtures with different algorithms Exp# Classifier Method Precision F-Score 31. 48% 43. 06% 36. 37% 69. 44% 58. 64% 63. 59% Recall 2 Non_Cascade Single-label based on sound separation Feature-based multi-label classification Spectrum-Match 3 Non_Cascade multi-label classification 85. 51% 55. 04% 66. 97% 4 Cascade(hornbostel) multi-label classification 64. 49% 63. 10% 63. 79% 5 Cascade(playmethod) multi-label classification 66. 67% 55. 25% 60. 43% 6 Cascade(machine Learned) multi-label classification 63. 77% 69. 67% 66. 59% 1 Non-Cascade
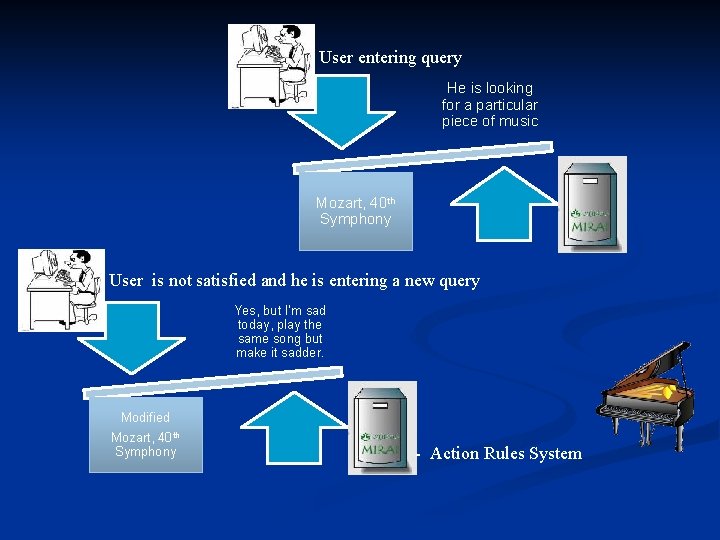
User entering query He is looking for a particular piece of music Mozart, 40 th Symphony User is not satisfied and he is entering a new query Yes, but I’m sad today, play the same song but make it sadder. Modified Mozart, 40 th Symphony - Action Rules System
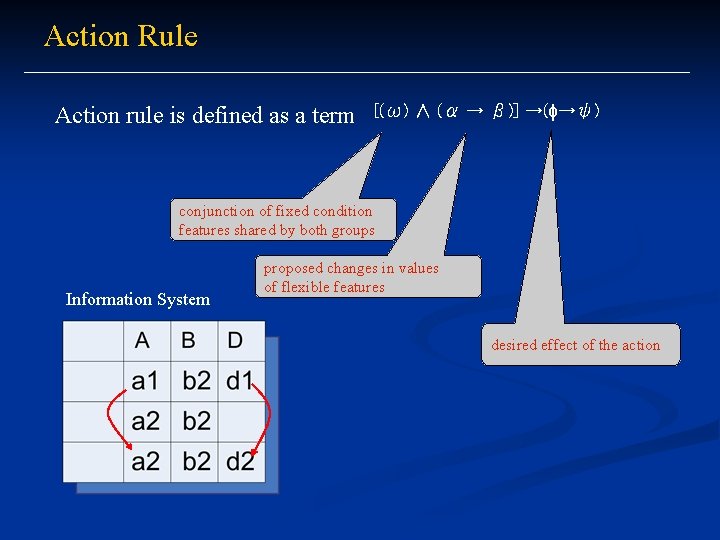
Action Rule Action rule is defined as a term [(ω) ∧ (α → β)] →(ϕ→ψ) conjunction of fixed condition features shared by both groups Information System proposed changes in values of flexible features desired effect of the action
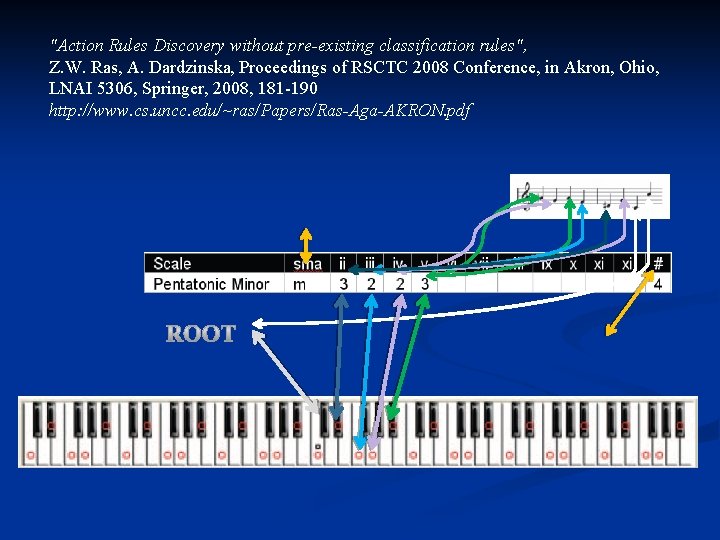
"Action Rules Discovery without pre-existing classification rules", Z. W. Ras, A. Dardzinska, Proceedings of RSCTC 2008 Conference, in Akron, Ohio, LNAI 5306, Springer, 2008, 181 -190 http: //www. cs. uncc. edu/~ras/Papers/Ras-Aga-AKRON. pdf
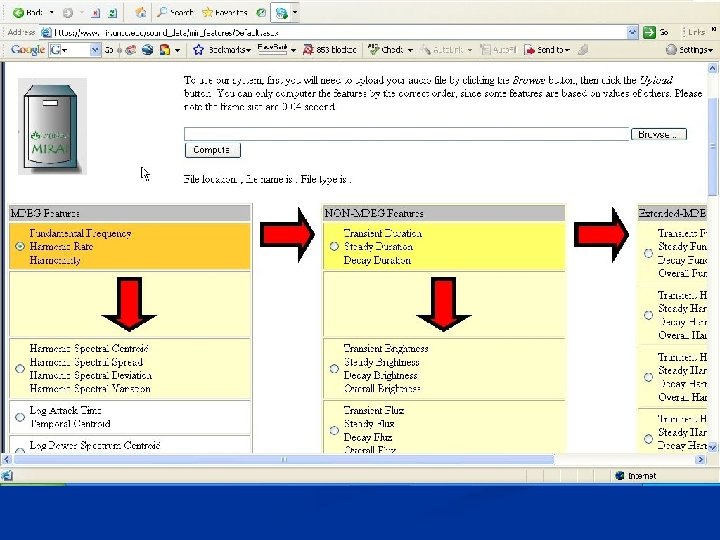
WWW. MIR. UNCC. EDU n Auto indexing system for musical instruments n intelligent query answering system for music instruments