
www isip piconepress com College of Engineering Temple
- Slides: 1
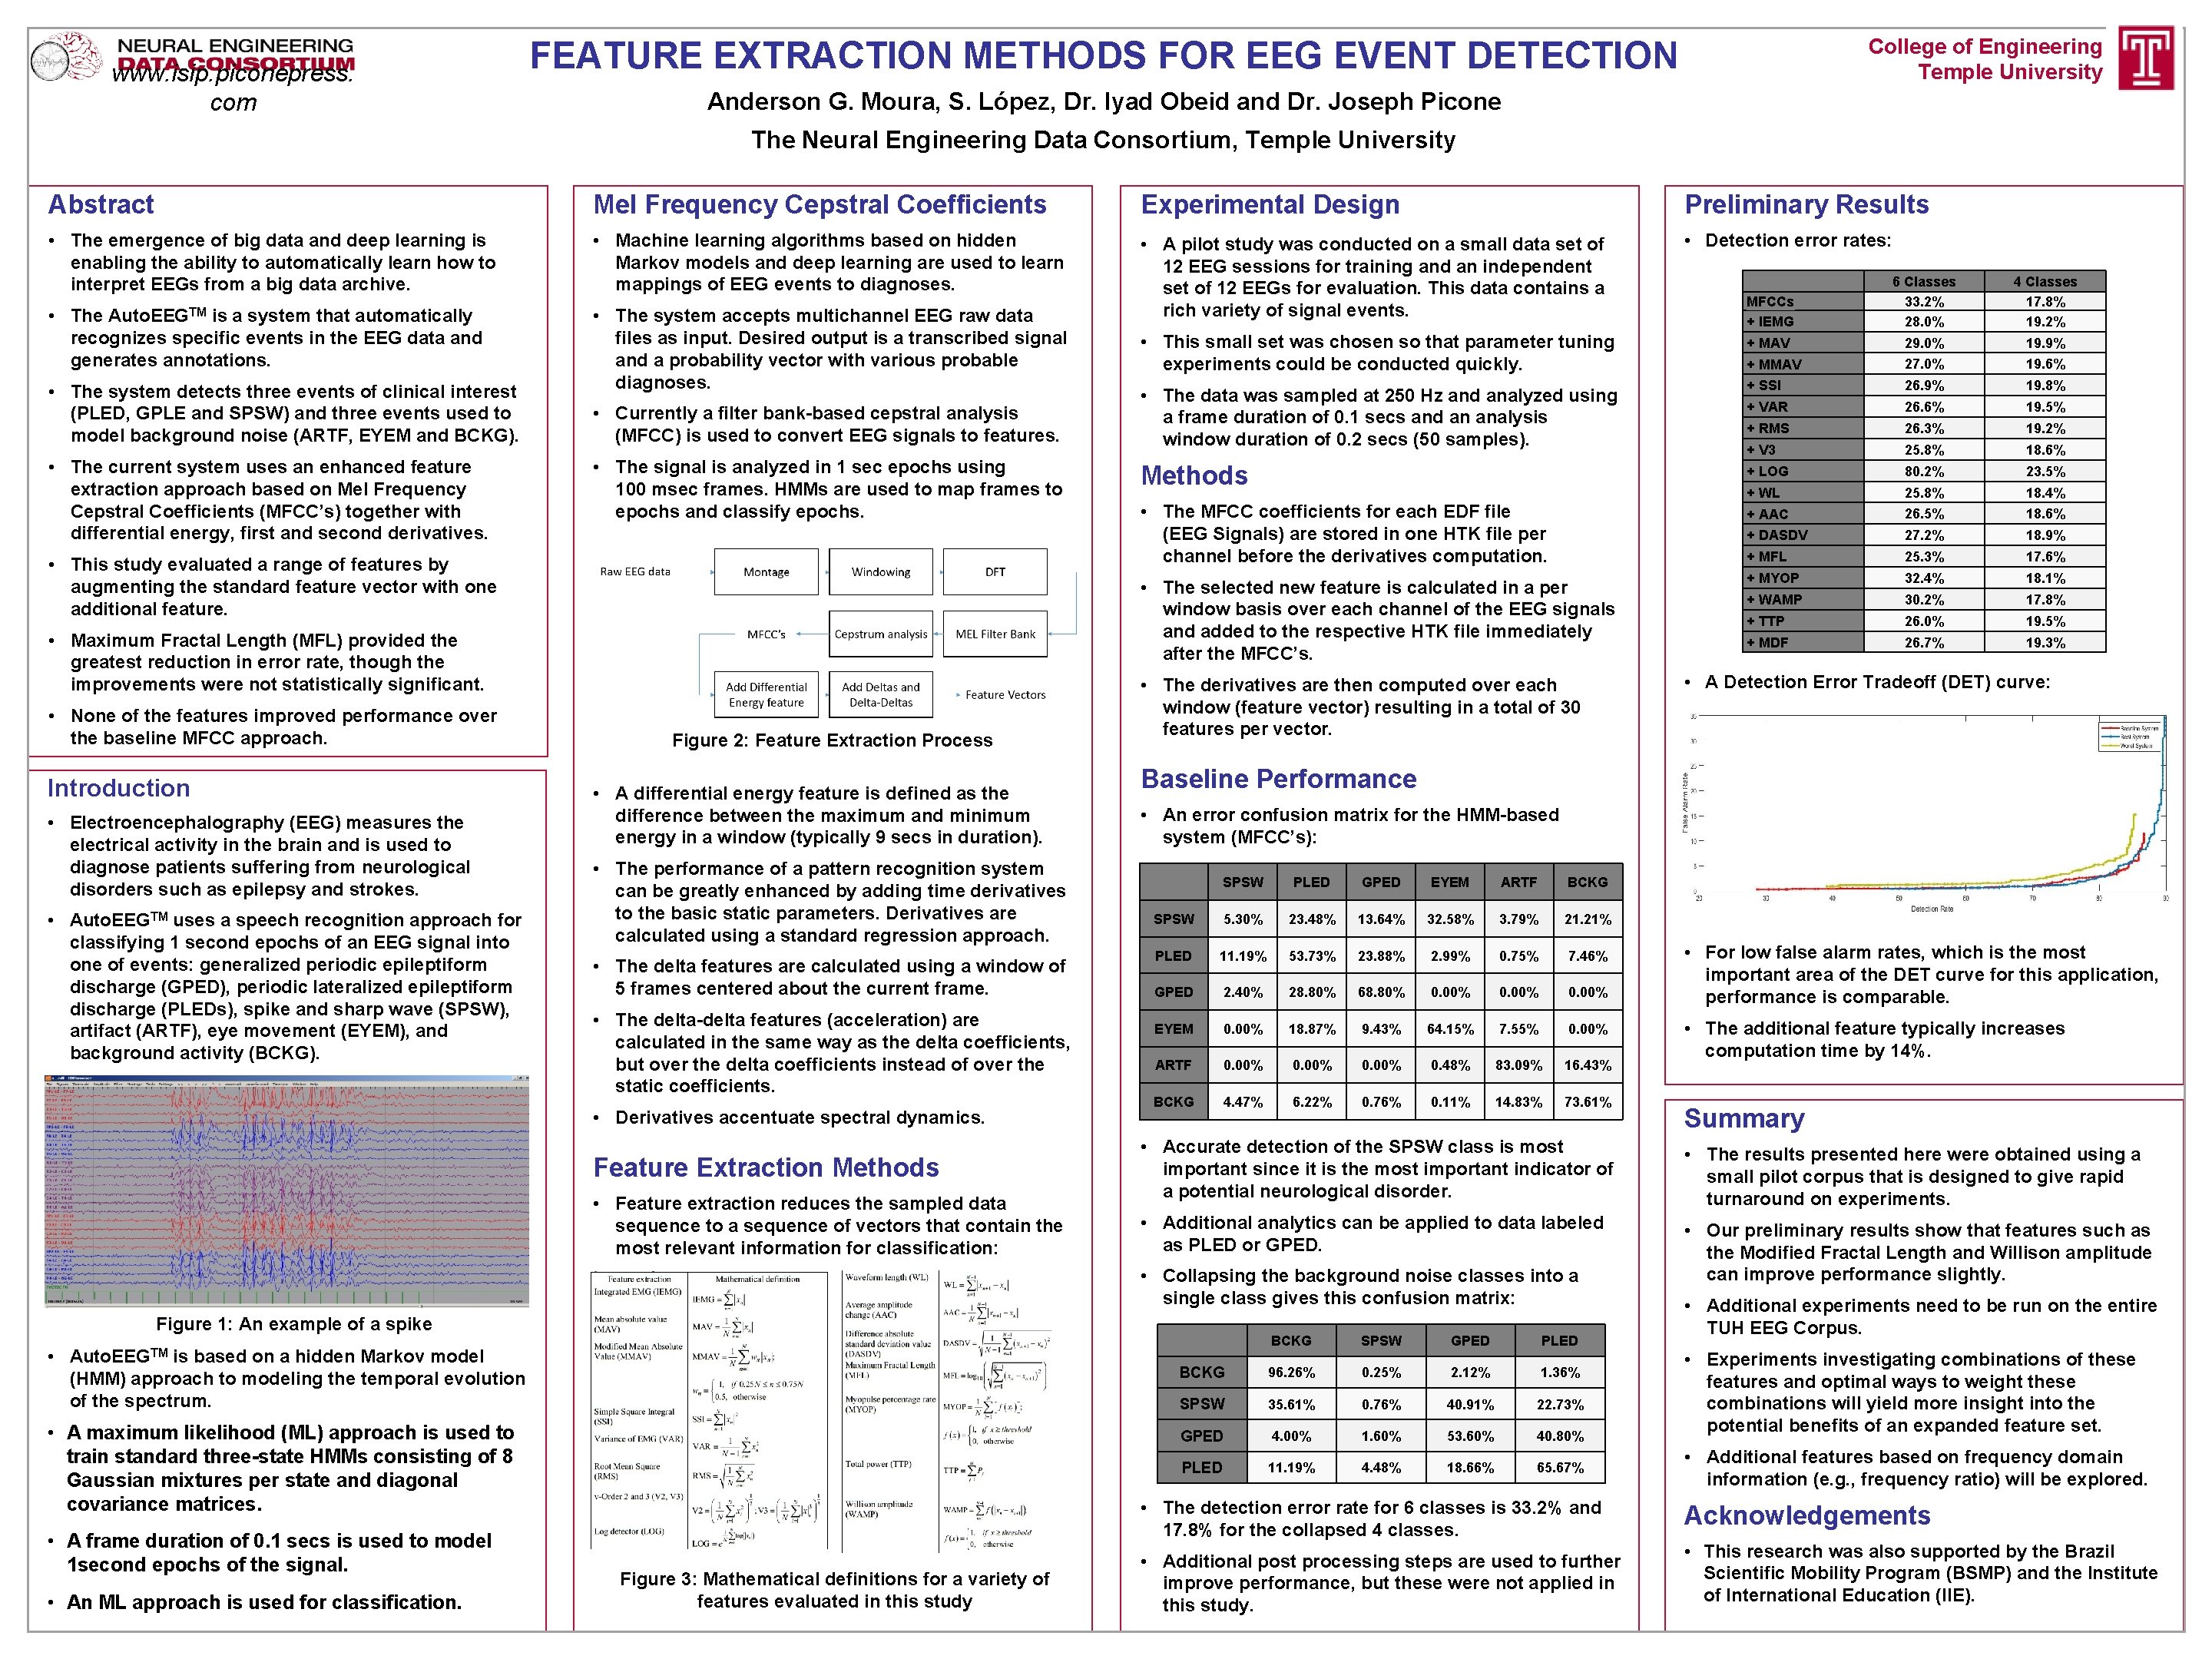
www. isip. piconepress. com College of Engineering Temple University FEATURE EXTRACTION METHODS FOR EEG EVENT DETECTION Anderson G. Moura, S. López, Dr. Iyad Obeid and Dr. Joseph Picone The Neural Engineering Data Consortium, Temple University Abstract Mel Frequency Cepstral Coefficients Experimental Design Preliminary Results • The emergence of big data and deep learning is enabling the ability to automatically learn how to interpret EEGs from a big data archive. • Machine learning algorithms based on hidden Markov models and deep learning are used to learn mappings of EEG events to diagnoses. • Detection error rates: • The Auto. EEGTM is a system that automatically recognizes specific events in the EEG data and generates annotations. • The system accepts multichannel EEG raw data files as input. Desired output is a transcribed signal and a probability vector with various probable diagnoses. • A pilot study was conducted on a small data set of 12 EEG sessions for training and an independent set of 12 EEGs for evaluation. This data contains a rich variety of signal events. • The system detects three events of clinical interest (PLED, GPLE and SPSW) and three events used to model background noise (ARTF, EYEM and BCKG). • The current system uses an enhanced feature extraction approach based on Mel Frequency Cepstral Coefficients (MFCC’s) together with differential energy, first and second derivatives. • Currently a filter bank-based cepstral analysis (MFCC) is used to convert EEG signals to features. • The signal is analyzed in 1 sec epochs using 100 msec frames. HMMs are used to map frames to epochs and classify epochs. • This study evaluated a range of features by augmenting the standard feature vector with one additional feature. • Maximum Fractal Length (MFL) provided the greatest reduction in error rate, though the improvements were not statistically significant. • None of the features improved performance over the baseline MFCC approach. Introduction • Electroencephalography (EEG) measures the electrical activity in the brain and is used to diagnose patients suffering from neurological disorders such as epilepsy and strokes. • Auto. EEGTM uses a speech recognition approach for classifying 1 second epochs of an EEG signal into one of events: generalized periodic epileptiform discharge (GPED), periodic lateralized epileptiform discharge (PLEDs), spike and sharp wave (SPSW), artifact (ARTF), eye movement (EYEM), and background activity (BCKG). Figure 2: Feature Extraction Process • A differential energy feature is defined as the difference between the maximum and minimum energy in a window (typically 9 secs in duration). • The performance of a pattern recognition system can be greatly enhanced by adding time derivatives to the basic static parameters. Derivatives are calculated using a standard regression approach. • The delta features are calculated using a window of 5 frames centered about the current frame. • The delta-delta features (acceleration) are calculated in the same way as the delta coefficients, but over the delta coefficients instead of over the static coefficients. • Derivatives accentuate spectral dynamics. Feature Extraction Methods • Feature extraction reduces the sampled data sequence to a sequence of vectors that contain the most relevant information for classification: MFCCs + IEMG 6 Classes 33. 2% 28. 0% 4 Classes 17. 8% 19. 2% • This small set was chosen so that parameter tuning experiments could be conducted quickly. + MAV 29. 0% 19. 9% + MMAV 27. 0% 19. 6% • The data was sampled at 250 Hz and analyzed using a frame duration of 0. 1 secs and an analysis window duration of 0. 2 secs (50 samples). + SSI 26. 9% 19. 8% + VAR 26. 6% 19. 5% + RMS 26. 3% 19. 2% + V 3 25. 8% 18. 6% Methods + LOG 80. 2% 23. 5% + WL 25. 8% 18. 4% • The MFCC coefficients for each EDF file (EEG Signals) are stored in one HTK file per channel before the derivatives computation. + AAC 26. 5% 18. 6% + DASDV 27. 2% 18. 9% + MFL 25. 3% 17. 6% • The selected new feature is calculated in a per window basis over each channel of the EEG signals and added to the respective HTK file immediately after the MFCC’s. + MYOP 32. 4% 18. 1% + WAMP 30. 2% 17. 8% + TTP 26. 0% 19. 5% + MDF 26. 7% 19. 3% • The derivatives are then computed over each window (feature vector) resulting in a total of 30 features per vector. Baseline Performance • An error confusion matrix for the HMM-based system (MFCC’s): SPSW PLED GPED EYEM ARTF BCKG SPSW 5. 30% 23. 48% 13. 64% 32. 58% 3. 79% 21. 21% PLED 11. 19% 53. 73% 23. 88% 2. 99% 0. 75% 7. 46% GPED 2. 40% 28. 80% 68. 80% 0. 00% EYEM 0. 00% 18. 87% 9. 43% 64. 15% 7. 55% 0. 00% ARTF 0. 00% 0. 48% 83. 09% 16. 43% BCKG 4. 47% 6. 22% 0. 76% 0. 11% 14. 83% 73. 61% • A frame duration of 0. 1 secs is used to model 1 second epochs of the signal. • An ML approach is used for classification. Summary • Additional analytics can be applied to data labeled as PLED or GPED. • Our preliminary results show that features such as the Modified Fractal Length and Willison amplitude can improve performance slightly. BCKG SPSW GPED PLED BCKG 96. 26% 0. 25% 2. 12% 1. 36% SPSW 35. 61% 0. 76% 40. 91% 22. 73% GPED 4. 00% 1. 60% 53. 60% 40. 80% PLED 11. 19% 4. 48% 18. 66% 65. 67% • The detection error rate for 6 classes is 33. 2% and 17. 8% for the collapsed 4 classes. Figure 3: Mathematical definitions for a variety of features evaluated in this study • The additional feature typically increases computation time by 14%. • The results presented here were obtained using a small pilot corpus that is designed to give rapid turnaround on experiments. Figure 1: An example of a spike • A maximum likelihood (ML) approach is used to train standard three-state HMMs consisting of 8 Gaussian mixtures per state and diagonal covariance matrices. • For low false alarm rates, which is the most important area of the DET curve for this application, performance is comparable. • Accurate detection of the SPSW class is most important since it is the most important indicator of a potential neurological disorder. • Collapsing the background noise classes into a single class gives this confusion matrix: • Auto. EEGTM is based on a hidden Markov model (HMM) approach to modeling the temporal evolution of the spectrum. • A Detection Error Tradeoff (DET) curve: • Additional post processing steps are used to further improve performance, but these were not applied in this study. • Additional experiments need to be run on the entire TUH EEG Corpus. • Experiments investigating combinations of these features and optimal ways to weight these combinations will yield more insight into the potential benefits of an expanded feature set. • Additional features based on frequency domain information (e. g. , frequency ratio) will be explored. Acknowledgements • This research was also supported by the Brazil Scientific Mobility Program (BSMP) and the Institute of International Education (IIE).