
www DLR de Chart 1 Medium Access Control







- Slides: 94
www. DLR. de • Chart 1 Medium Access Control Protocols in Mobile Ad-hoc Networks Using Beaconing> Cristina Rico > 18/10/12 Medium Access Control Protocols in Mobile Ad-hoc Networks Using Beaconing Cristina Rico García Promotionsvortrag Ulm, 18/10/2012
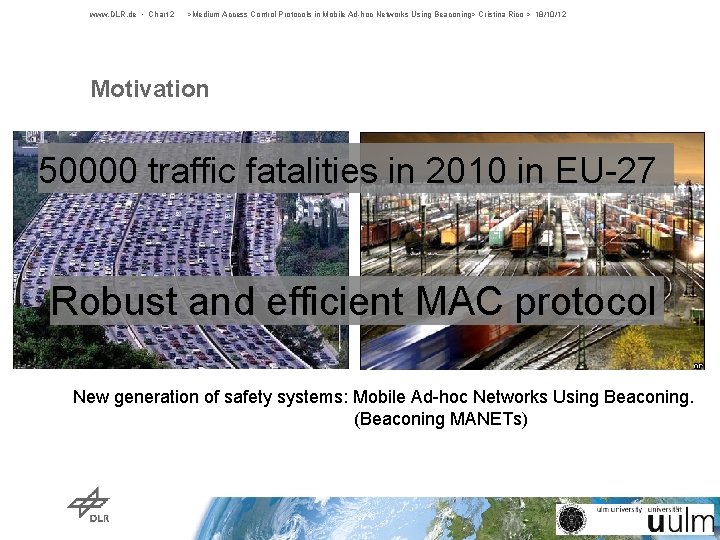
www. DLR. de • Chart 2 >Medium Access Control Protocols in Mobile Ad-hoc Networks Using Beaconing> Cristina Rico > 18/10/12 Motivation 50000 traffic fatalities in 2010 in EU-27 1. Introduction. M Robust and efficient MAC protocol New generation of safety systems: Mobile Ad-hoc Networks Using Beaconing. (Beaconing MANETs) Challenge: Coordination of transmissions. Goal: Robust Medium Access Control (MAC) protocol.
www. DLR. de • Chart 3 > Medium Access Control Protocols in Mobile Ad-hoc Networks Using Beaconing> Cristina Rico > 18/10/12 Outline 1. Update Delay: Novel metric for MAC protocols in beaconing MANETs 2. COMB: New two-layered protocol 3. Case Study: MAC design for the Railway Collision Avoidance System
www. DLR. de • Chart 4 > Medium Access Control Protocols in Mobile Ad-hoc Networks Using Beaconing> Cristina Rico > 18/10/12 Outline 1. Update Delay: Novel metric for MAC protocols in beaconing MANETs 2. COMB: New two-layered protocol 3. Case Study: MAC design for the Railway Collision Avoidance System
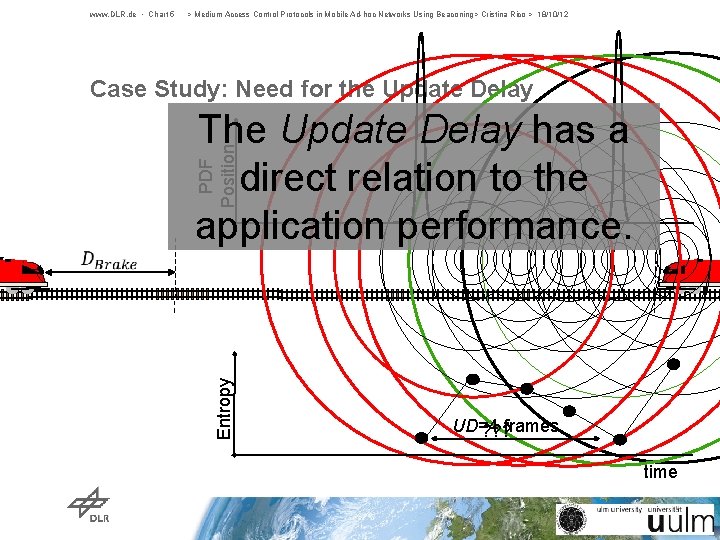
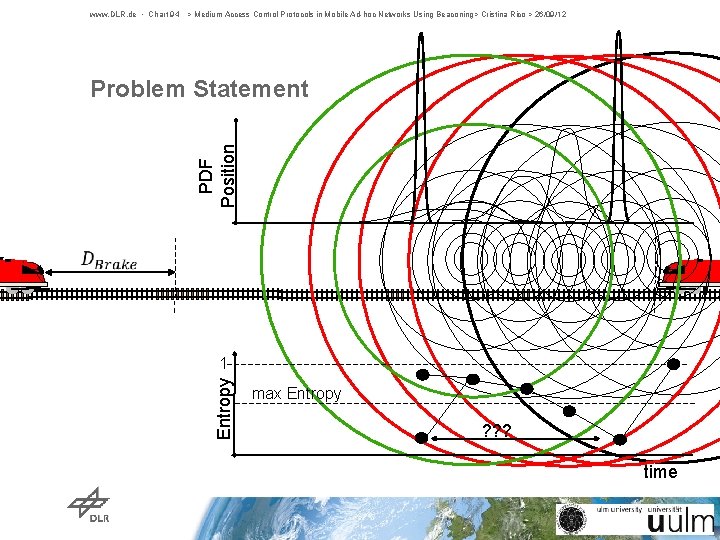
www. DLR. de • Chart 5 > Medium Access Control Protocols in Mobile Ad-hoc Networks Using Beaconing> Cristina Rico > 18/10/12 Case Study: Need for the Update Delay PDF Position The Update Delay has a direct relation to the application performance. Entropy UD=4 frames ? ? ? time
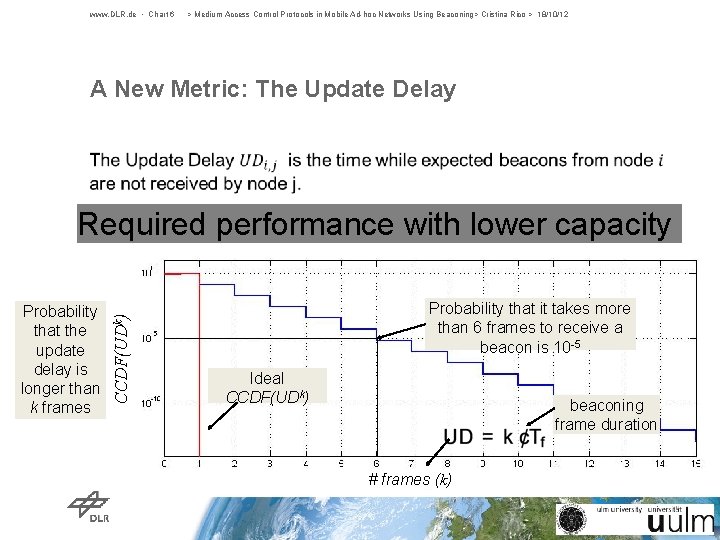
www. DLR. de • Chart 6 > Medium Access Control Protocols in Mobile Ad-hoc Networks Using Beaconing> Cristina Rico > 18/10/12 A New Metric: The Update Delay • Probability that the update delay is longer than k frames CCDF(UDk) Required performance with lower capacity Probability that it takes more than 6 frames to receive a beacon is 10 -5 Ideal CCDF(UDk) beaconing frame duration # frames (k)
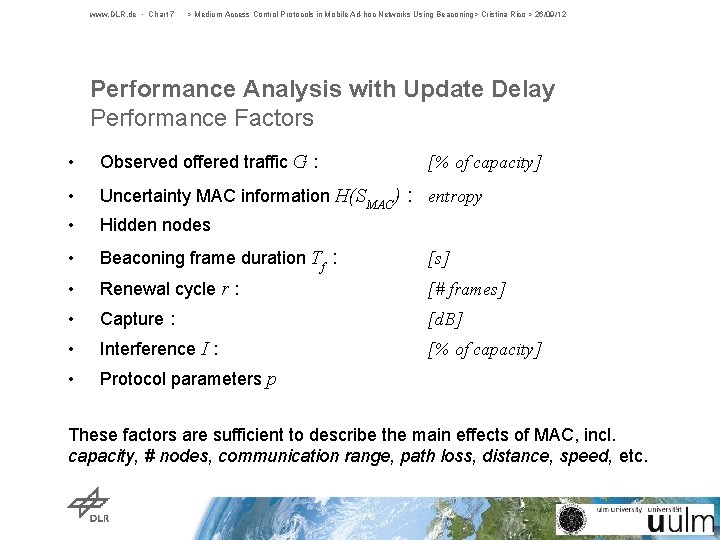
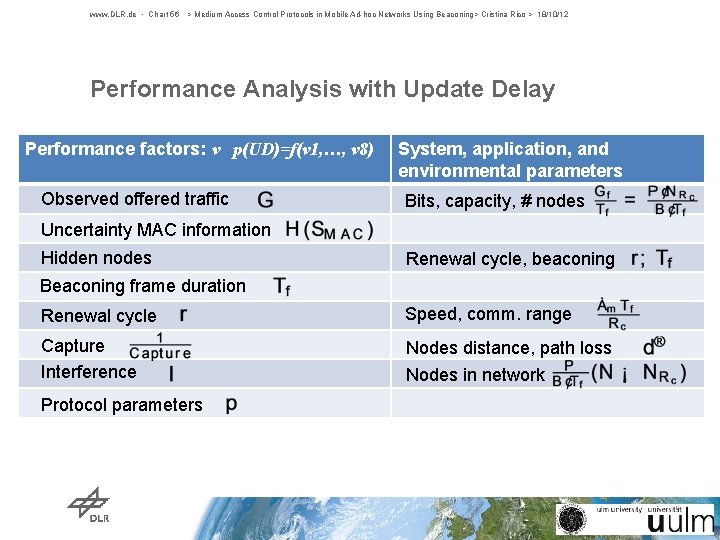
www. DLR. de • Chart 7 > Medium Access Control Protocols in Mobile Ad-hoc Networks Using Beaconing> Cristina Rico > 26/09/12 Performance Analysis with Update Delay Performance Factors • Observed offered traffic G : • Uncertainty MAC information H(SMAC) : entropy • Hidden nodes • Beaconing frame duration Tf : [s] • Renewal cycle r : [# frames] • Capture : [d. B] • Interference I : [% of capacity] • Protocol parameters p [% of capacity] These factors are sufficient to describe the main effects of MAC, incl. capacity, # nodes, communication range, path loss, distance, speed, etc.
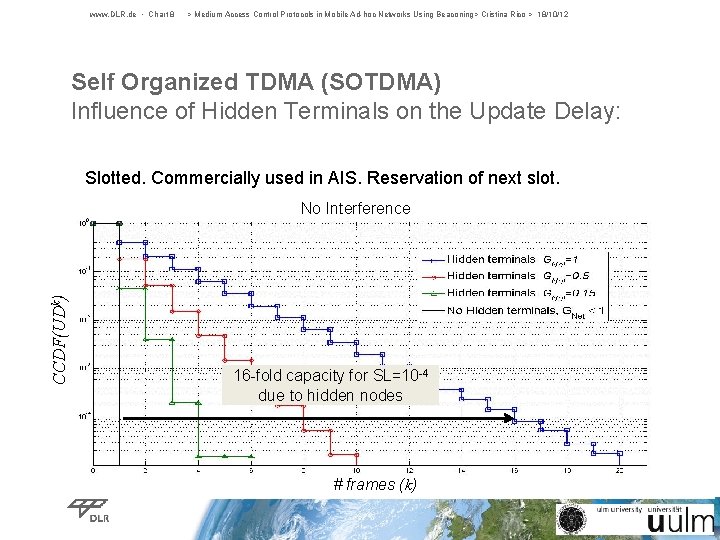
www. DLR. de • Chart 8 > Medium Access Control Protocols in Mobile Ad-hoc Networks Using Beaconing> Cristina Rico > 18/10/12 Self Organized TDMA (SOTDMA) Influence of Hidden Terminals on the Update Delay: Slotted. Commercially used in AIS. Reservation of next slot. CCDF(UDk) No Interference 16 -fold capacity for SL=10 -4 due to hidden nodes # frames (k)
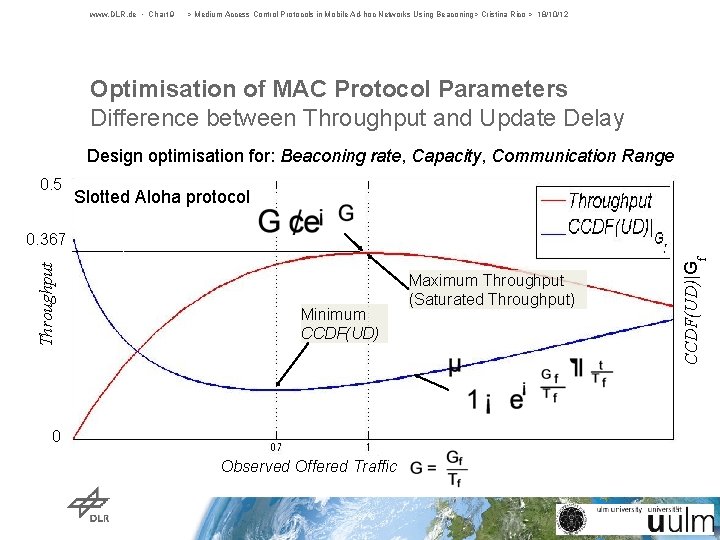
www. DLR. de • Chart 9 > Medium Access Control Protocols in Mobile Ad-hoc Networks Using Beaconing> Cristina Rico > 18/10/12 Optimisation of MAC Protocol Parameters Difference between Throughput and Update Delay Design optimisation for: Beaconing rate, Capacity, Communication Range 0. 5 Slotted Aloha protocol Minimum CCDF(UD) 0 Observed Offered Traffic Maximum Throughput (Saturated Throughput) CCDF(UD)|Gf Throughput 0. 367
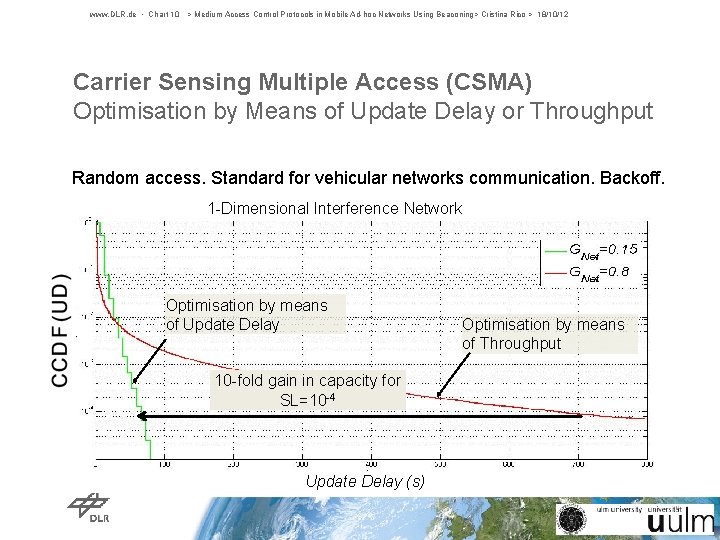
www. DLR. de • Chart 10 > Medium Access Control Protocols in Mobile Ad-hoc Networks Using Beaconing> Cristina Rico > 18/10/12 Carrier Sensing Multiple Access (CSMA) Optimisation by Means of Update Delay or Throughput Random access. Standard for vehicular networks communication. Backoff. 1 -Dimensional Interference Network Optimisation by means of Update Delay 10 -fold gain in capacity for SL=10 -4 Update Delay (s) Optimisation by means of Throughput
www. DLR. de • Chart 11 > Medium Access Control Protocols in Mobile Ad-hoc Networks Using Beaconing> Cristina Rico > 18/10/12 Outline 1. Update Delay: Novel metric for MAC protocols in beaconing MANETs 2. COMB: New two-layered protocol developed in this thesis. 3. Case Study: MAC design for the Railway Collision Avoidance System
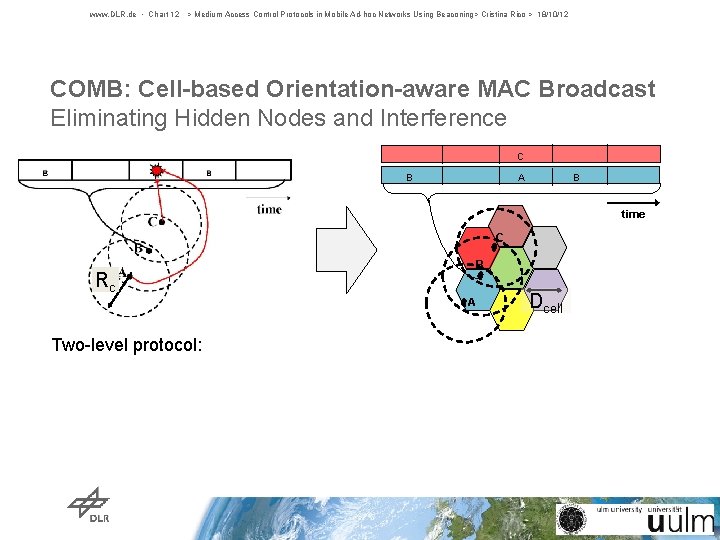
www. DLR. de • Chart 12 > Medium Access Control Protocols in Mobile Ad-hoc Networks Using Beaconing> Cristina Rico > 18/10/12 COMB: Cell-based Orientation-aware MAC Broadcast Eliminating Hidden Nodes and Interference C B A B time C B Rc A Dcell Two-level protocol: 1. A channel is assigned to every cell depending on its position. Hidden nodes transmitt in different channels: COMB condition: Dcell<Rc. 2. Inside cells the transmission moment is chosen dynamically with any protocol using MAC information (SOTDMA, CSMA). With SOTDMA the nodes reserve future slot and channel depending on the orientation.
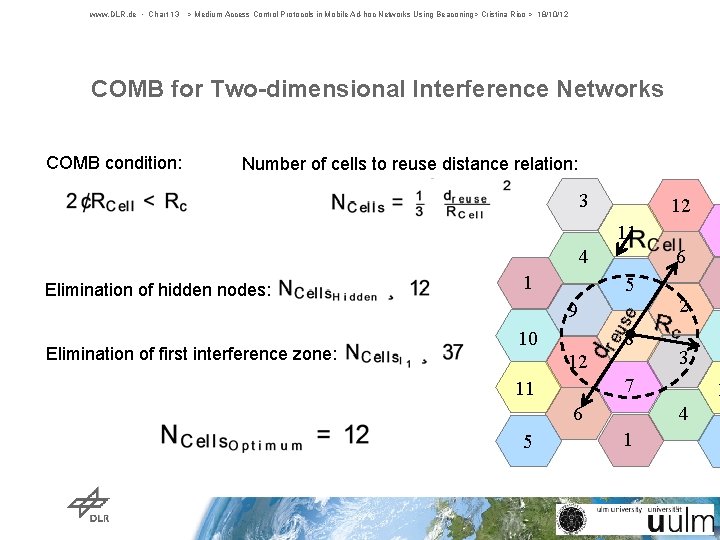
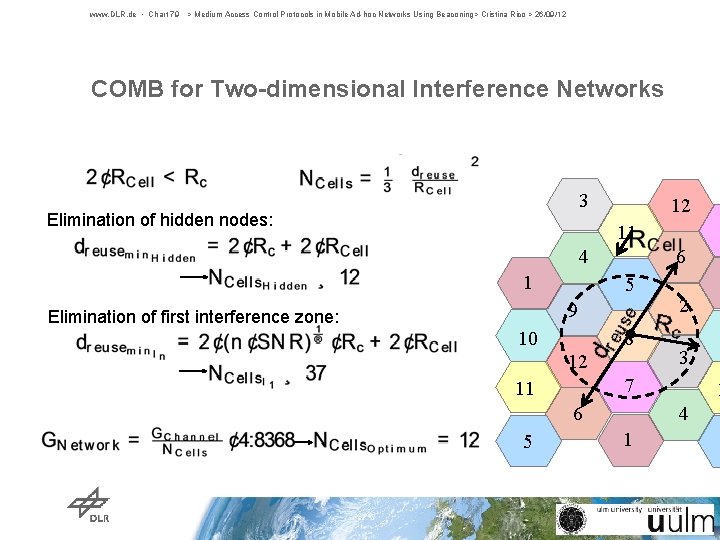
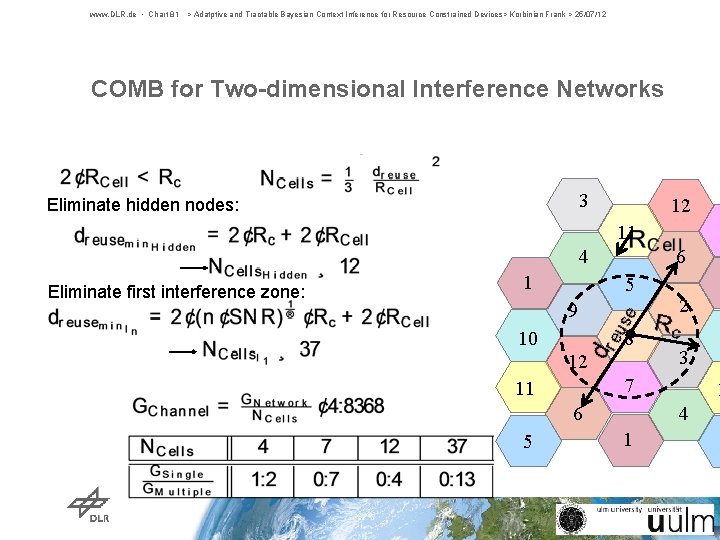
www. DLR. de • Chart 13 > Medium Access Control Protocols in Mobile Ad-hoc Networks Using Beaconing> Cristina Rico > 18/10/12 COMB for Two-dimensional Interference Networks COMB condition: Number of cells to reuse distance relation: 3 12 11 4 Elimination of hidden nodes: Elimination of first interference zone: 1 6 5 9 10 8 12 3 7 11 6 5 2 1 4 1 1
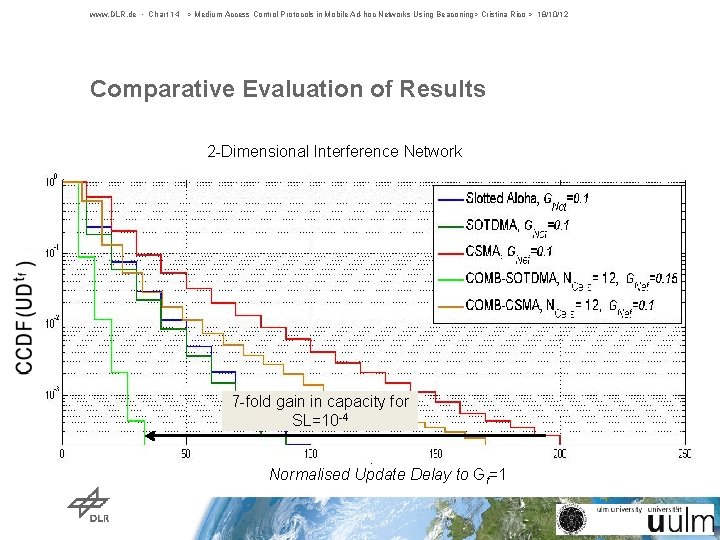
www. DLR. de • Chart 14 > Medium Access Control Protocols in Mobile Ad-hoc Networks Using Beaconing> Cristina Rico > 18/10/12 Comparative Evaluation of Results CCDF(UDk) 2 -Dimensional Interference Network 7 -fold gain in capacity for SL=10 -4 Normalised Update Delay to Gf=1
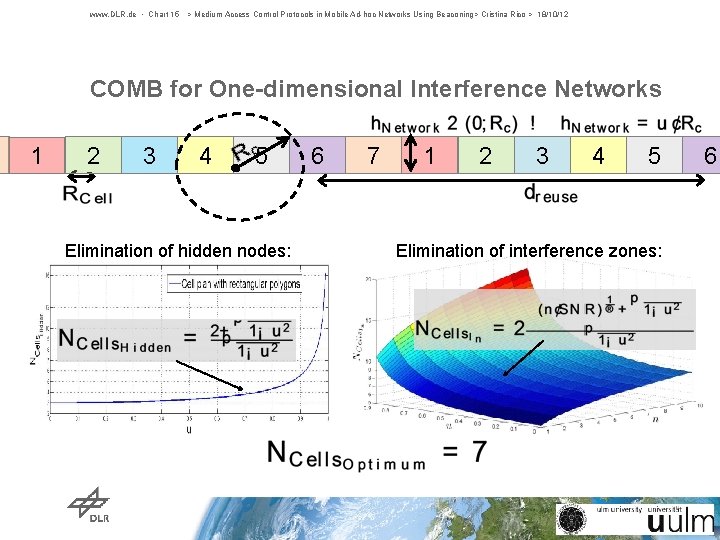
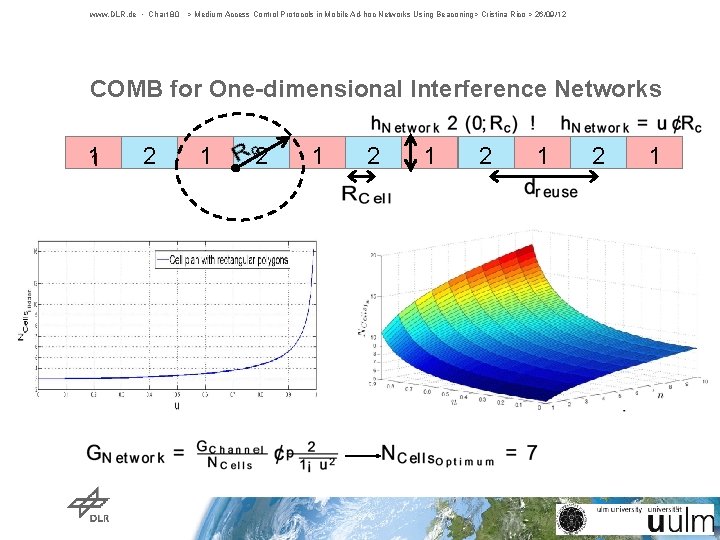
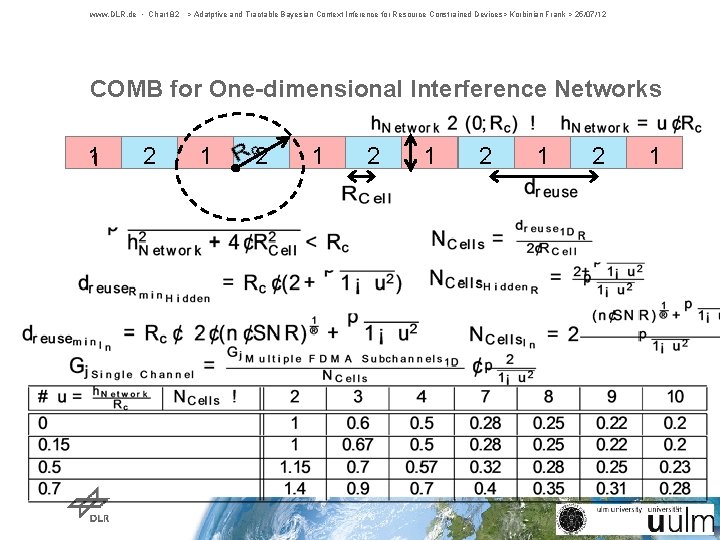
www. DLR. de • Chart 15 > Medium Access Control Protocols in Mobile Ad-hoc Networks Using Beaconing> Cristina Rico > 18/10/12 COMB for One-dimensional Interference Networks 1 21 3 4 5 6 7 Elimination of hidden nodes: COMB condition: Number of cells to reuse distance relation: 1 2 3 4 5 Elimination of interference zones: 6
www. DLR. de • Chart 16 > Medium Access Control Protocols in Mobile Ad-hoc Networks Using Beaconing> Cristina Rico > 18/10/12 Outline 1. Update Delay: Novel metric for MAC protocols in beaconing MANETs 2. COMB: New two-layered protocol 3. Case Study: MAC design for the Railway Collision Avoidance System
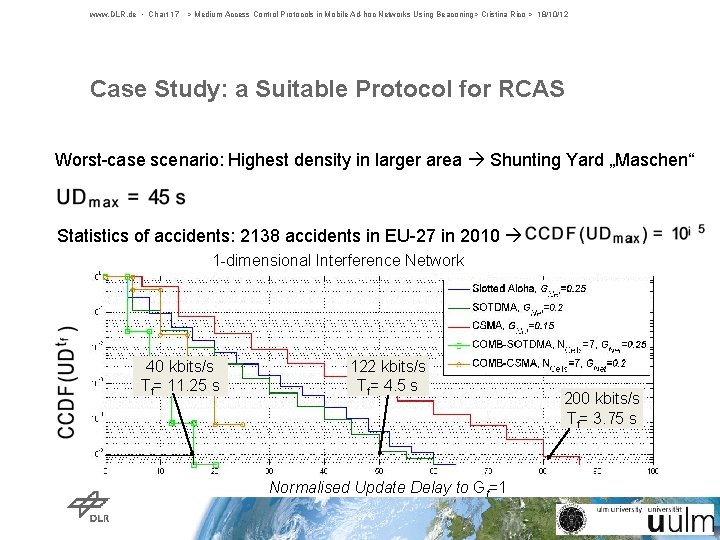
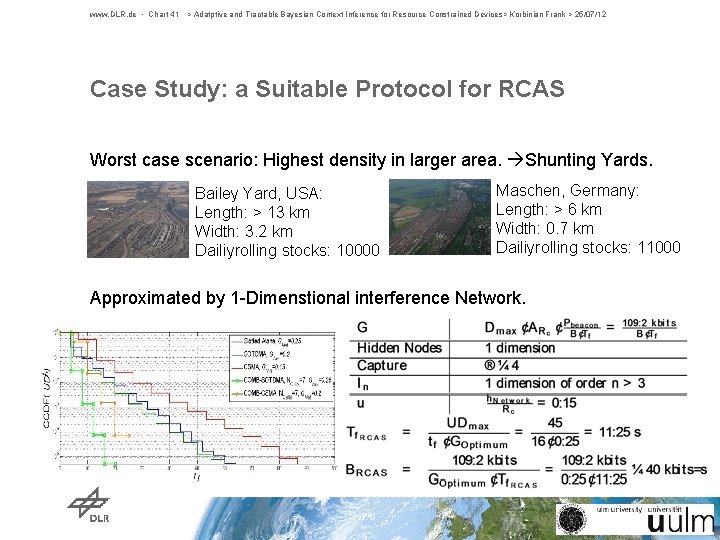
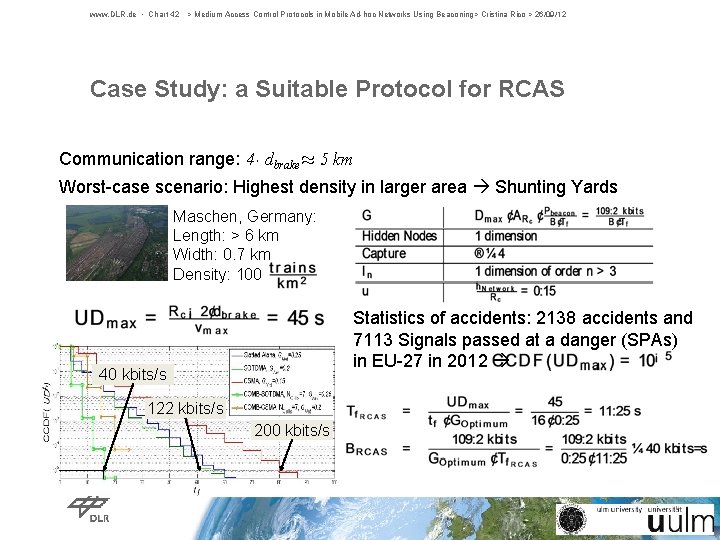
www. DLR. de • Chart 17 > Medium Access Control Protocols in Mobile Ad-hoc Networks Using Beaconing> Cristina Rico > 18/10/12 Case Study: a Suitable Protocol for RCAS Worst-case scenario: Highest density in larger area Shunting Yard „Maschen“ Statistics of accidents: 2138 accidents in EU-27 in 2010 CCDF(UDk) 1 -dimensional Interference Network 40 kbits/s Tf= 11. 25 s 122 kbits/s Tf= 4. 5 s Normalised Update Delay to Gf=1 200 kbits/s Tf= 3. 75 s
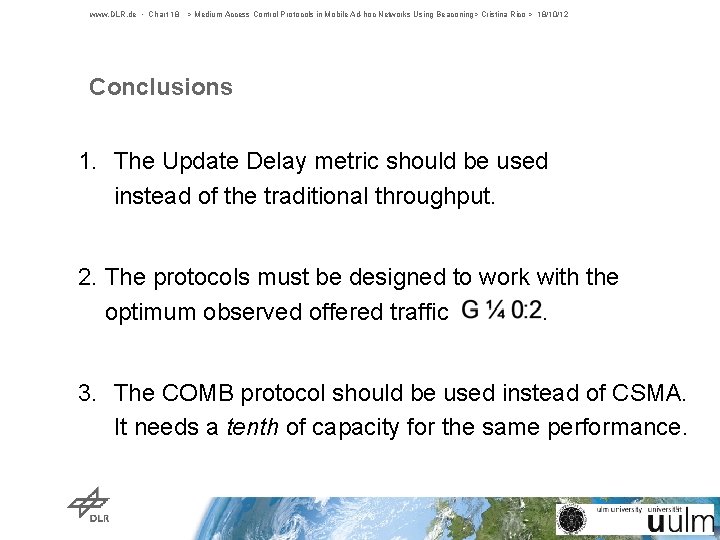
www. DLR. de • Chart 18 > Medium Access Control Protocols in Mobile Ad-hoc Networks Using Beaconing> Cristina Rico > 18/10/12 Conclusions 1. The Update Delay metric should be used instead of the traditional throughput. 2. The protocols must be designed to work with the optimum observed offered traffic . 3. The COMB protocol should be used instead of CSMA. It needs a tenth of capacity for the same performance.
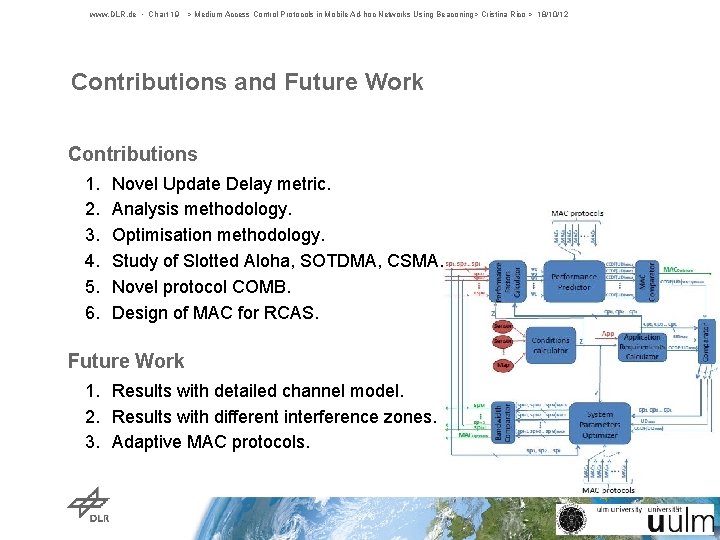
www. DLR. de • Chart 19 > Medium Access Control Protocols in Mobile Ad-hoc Networks Using Beaconing> Cristina Rico > 18/10/12 Contributions and Future Work Contributions 1. 2. 3. 4. 5. 6. Novel Update Delay metric. Analysis methodology. Optimisation methodology. Study of Slotted Aloha, SOTDMA, CSMA. Novel protocol COMB. Design of MAC for RCAS. Future Work 1. Results with detailed channel model. 2. Results with different interference zones. 3. Adaptive MAC protocols.
www. DLR. de • Chart 20 > Medium Access Control Protocols in Mobile Ad-hoc Networks Using Beaconing> Cristina Rico > 18/10/12 Backup
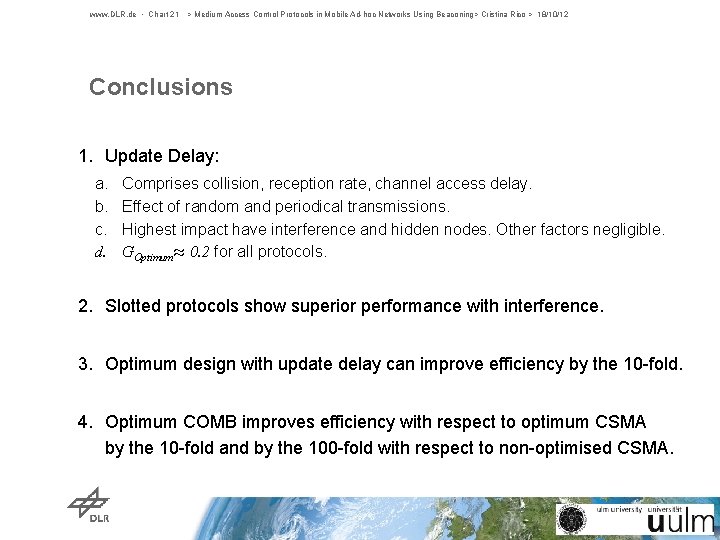
www. DLR. de • Chart 21 > Medium Access Control Protocols in Mobile Ad-hoc Networks Using Beaconing> Cristina Rico > 18/10/12 Conclusions 1. Update Delay: a. b. c. d. Comprises collision, reception rate, channel access delay. Effect of random and periodical transmissions. Highest impact have interference and hidden nodes. Other factors negligible. GOptimum¼ 0. 2 for all protocols. 2. Slotted protocols show superior performance with interference. 3. Optimum design with update delay can improve efficiency by the 10 -fold. 4. Optimum COMB improves efficiency with respect to optimum CSMA by the 10 -fold and by the 100 -fold with respect to non-optimised CSMA.
www. DLR. de • Chart 22 > Medium Access Control Protocols in Mobile Ad-hoc Networks Using Beaconing> Cristina Rico > 18/10/12 Backup Outline 1. .
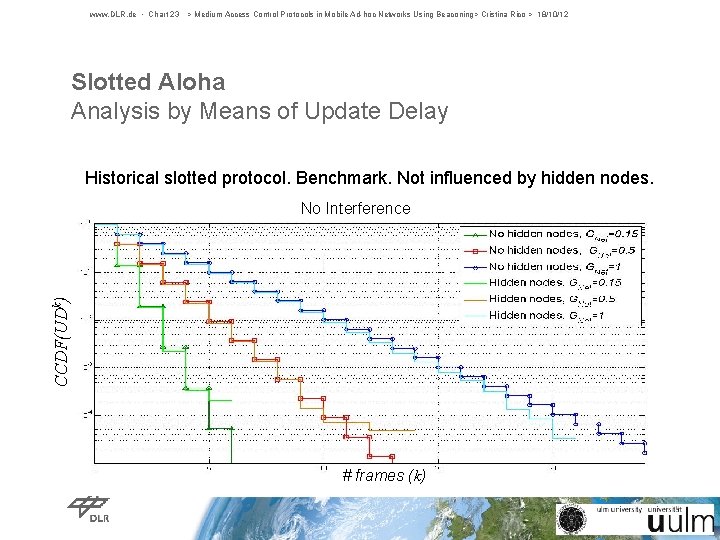
www. DLR. de • Chart 23 > Medium Access Control Protocols in Mobile Ad-hoc Networks Using Beaconing> Cristina Rico > 18/10/12 Slotted Aloha Analysis by Means of Update Delay Historical slotted protocol. Benchmark. Not influenced by hidden nodes. CCDF(UDk) No Interference # frames (k)
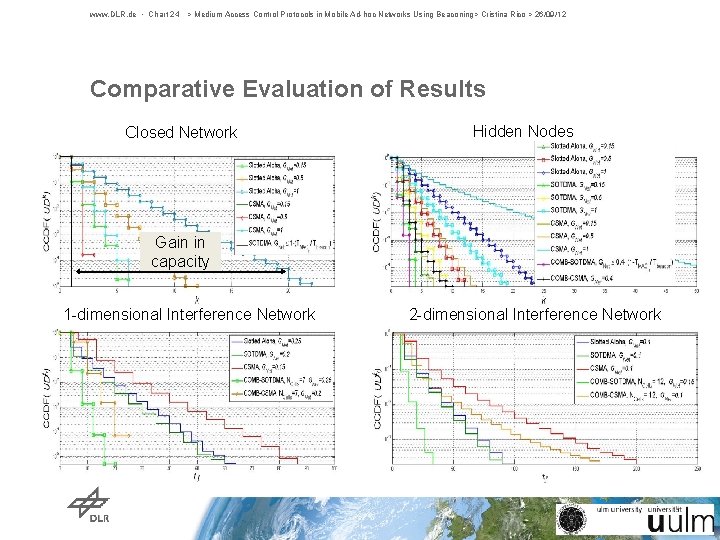
www. DLR. de • Chart 24 > Medium Access Control Protocols in Mobile Ad-hoc Networks Using Beaconing> Cristina Rico > 26/09/12 Comparative Evaluation of Results Closed Network Hidden Nodes Gain in capacity 1 -dimensional Interference Network 2 -dimensional Interference Network
Channel Model
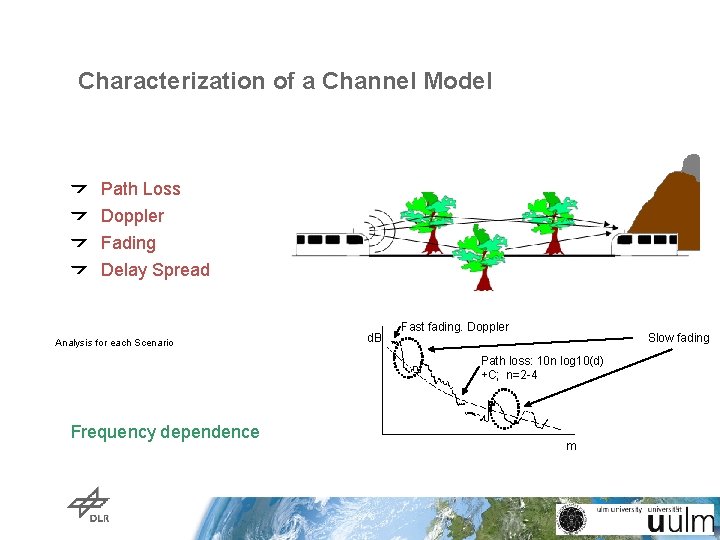
Characterization of a Channel Model Path Loss Doppler Fading Delay Spread Analysis for each Scenario d. B Fast fading. Doppler Slow fading Path loss: 10 n log 10(d) +C; n=2 -4 Frequency dependence m
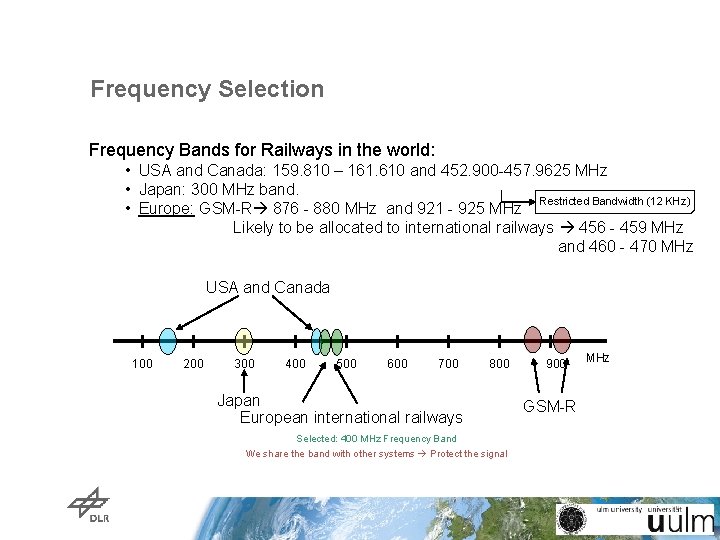
Frequency Selection Frequency Bands for Railways in the world: • USA and Canada: 159. 810 – 161. 610 and 452. 900 -457. 9625 MHz • Japan: 300 MHz band. Restricted Bandwidth (12 KHz) • Europe: GSM-R 876 - 880 MHz and 921 - 925 MHz Likely to be allocated to international railways 456 - 459 MHz and 460 - 470 MHz USA and Canada 100 200 300 400 500 600 700 800 Japan European international railways Selected: 400 MHz Frequency Band We share the band with other systems Protect the signal 900 GSM-R MHz
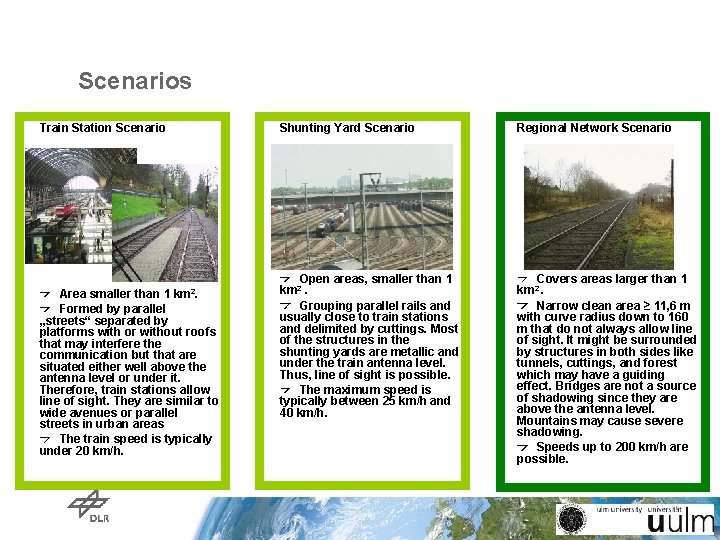
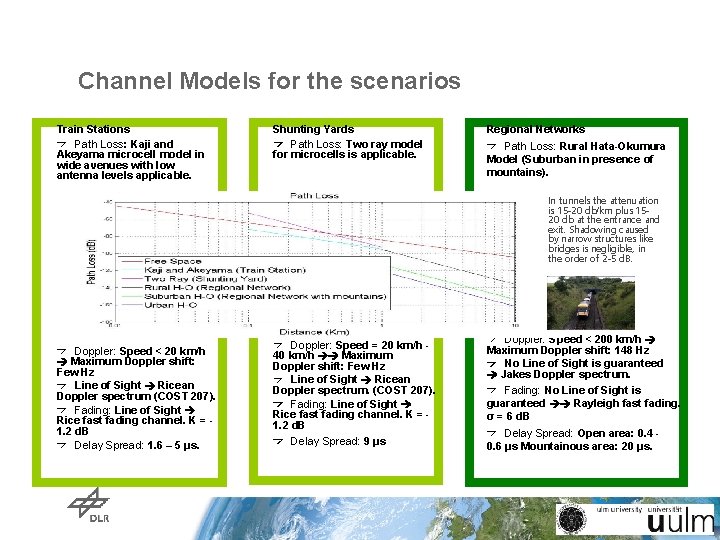
Scenarios Train Station Scenario km 2. Area smaller than 1 Formed by parallel „streets“ separated by platforms with or without roofs that may interfere the communication but that are situated either well above the antenna level or under it. Therefore, train stations allow line of sight. They are similar to wide avenues or parallel streets in urban areas The train speed is typically under 20 km/h. Shunting Yard Scenario Regional Network Scenario Open areas, smaller than 1 km 2. Grouping parallel rails and usually close to train stations and delimited by cuttings. Most of the structures in the shunting yards are metallic and under the train antenna level. Thus, line of sight is possible. The maximum speed is typically between 25 km/h and 40 km/h. Covers areas larger than 1 km 2. Narrow clean area ≥ 11, 6 m with curve radius down to 160 m that do not always allow line of sight. It might be surrounded by structures in both sides like tunnels, cuttings, and forest which may have a guiding effect. Bridges are not a source of shadowing since they are above the antenna level. Mountains may cause severe shadowing. Speeds up to 200 km/h are possible.
Channel Models for the scenarios Train Stations Path Loss: Kaji and Akeyama microcell model in wide avenues with low antenna levels applicable. Shunting Yards Path Loss: Two ray model for microcells is applicable. Regional Networks Path Loss: Rural Hata-Okumura Model (Suburban in presence of mountains). In tunnels the attenuation is 15 -20 db/km plus 1520 db at the entrance and exit. Shadowing caused by narrow structures like bridges is negligible, in the order of 2 -5 d. B. Doppler: Speed < 20 km/h Maximum Doppler shift: Few Hz Line of Sight Ricean Doppler spectrum (COST 207). Fading: Line of Sight Rice fast fading channel. K = 1. 2 d. B Delay Spread: 1. 6 – 5 μs. Doppler: Speed = 20 km/h 40 km/h Maximum Doppler shift: Few Hz Line of Sight Ricean Doppler spectrum. (COST 207). Fading: Line of Sight Rice fast fading channel. K = 1. 2 d. B Delay Spread: 9 μs Doppler: Speed < 200 km/h Maximum Doppler shift: 148 Hz No Line of Sight is guaranteed Jakes Doppler spectrum. Fading: No Line of Sight is guaranteed Rayleigh fast fading. σ = 6 d. B Delay Spread: Open area: 0. 4 0. 6 μs Mountainous area: 20 μs.
RCAS
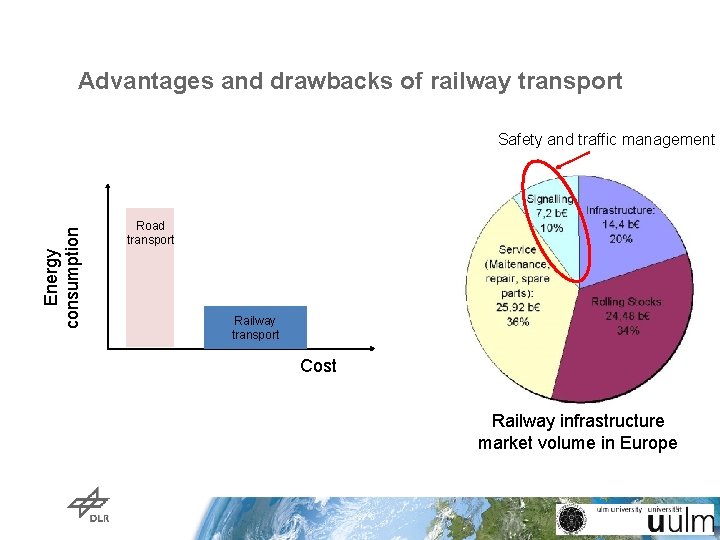
Advantages and drawbacks of railway transport Safety and traffic management Energy consumption Road transport Railway transport Cost Railway infrastructure market volume in Europe
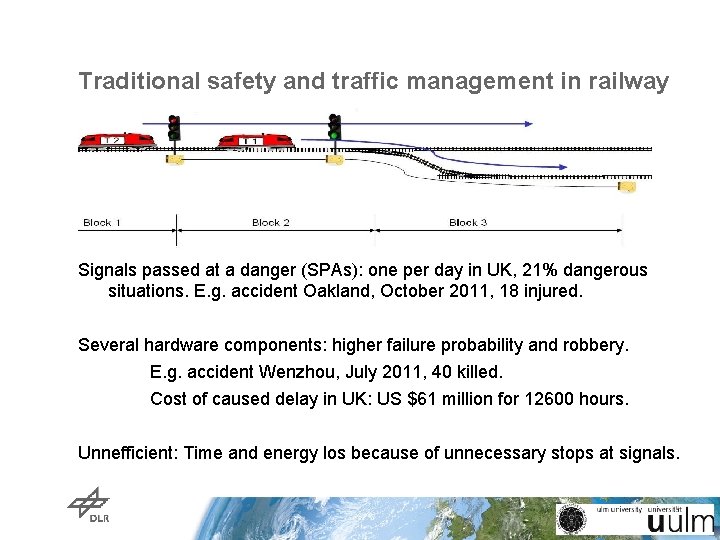
Traditional safety and traffic management in railway Signals passed at a danger (SPAs): one per day in UK, 21% dangerous situations. E. g. accident Oakland, October 2011, 18 injured. Several hardware components: higher failure probability and robbery. E. g. accident Wenzhou, July 2011, 40 killed. Cost of caused delay in UK: US $61 million for 12600 hours. Unnefficient: Time and energy los because of unnecessary stops at signals.
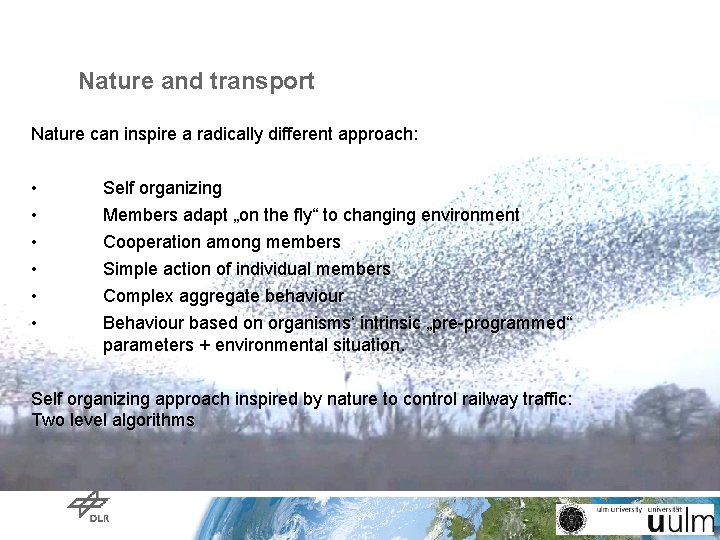
Nature and transport Nature can inspire a radically different approach: • Self organizing • Members adapt „on the fly“ to changing environment • • Cooperation among members Simple action of individual members Complex aggregate behaviour Behaviour based on organisms‘ intrinsic „pre-programmed“ parameters + environmental situation. Self organizing approach inspired by nature to control railway traffic: Two level algorithms
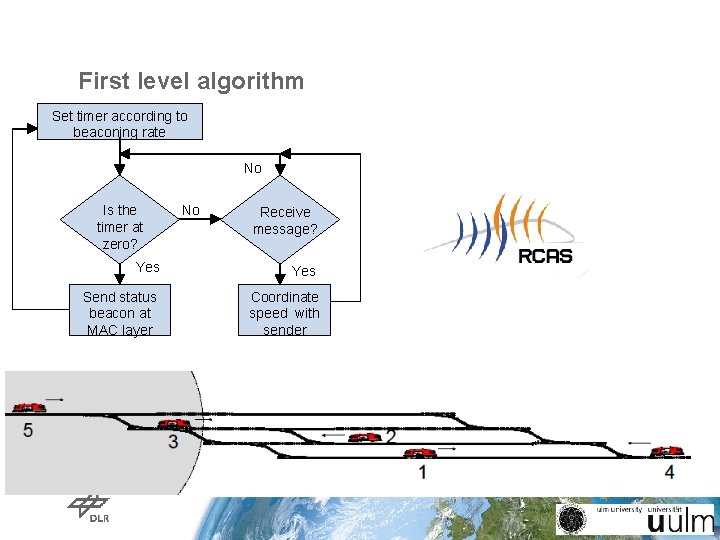
First level algorithm Set timer according to beaconing rate No Is the timer at zero? Yes Send status beacon at MAC layer No Receive message? Yes Coordinate speed with sender
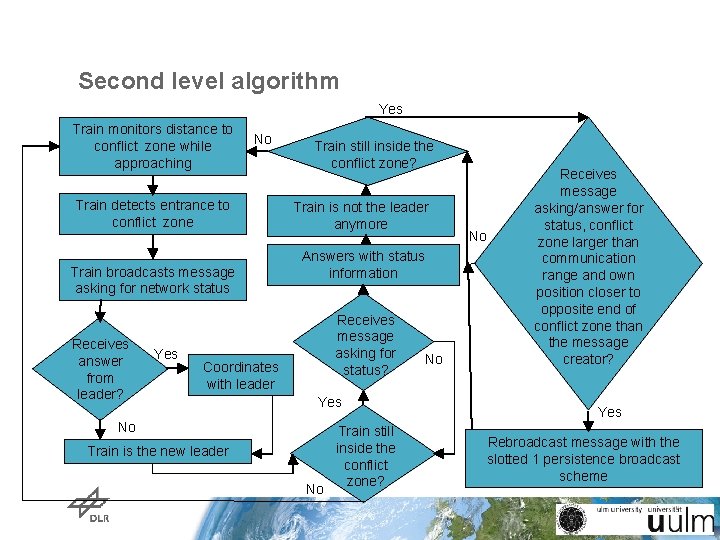
Second level algorithm Yes Train monitors distance to conflict zone while approaching No Train detects entrance to conflict zone Train broadcasts message asking for network status Receives answer from leader? Yes Train still inside the conflict zone? Train is not the leader anymore Answers with status information Receives message asking for status? Coordinates with leader Yes No Train is the new leader No Train still inside the conflict zone? No No Receives message asking/answer for status, conflict zone larger than communication range and own position closer to opposite end of conflict zone than the message creator? Yes Rebroadcast message with the slotted 1 persistence broadcast scheme
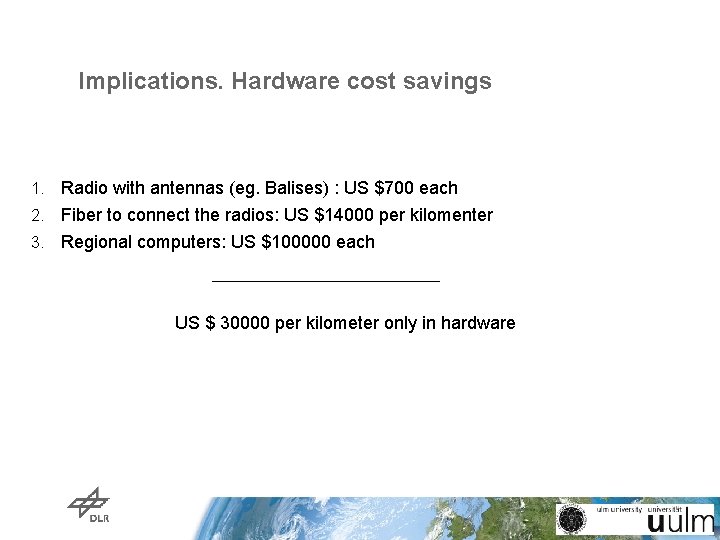
Implications. Hardware cost savings 1. Radio with antennas (eg. Balises) : US $700 each 2. Fiber to connect the radios: US $14000 per kilomenter 3. Regional computers: US $100000 each US $ 30000 per kilometer only in hardware
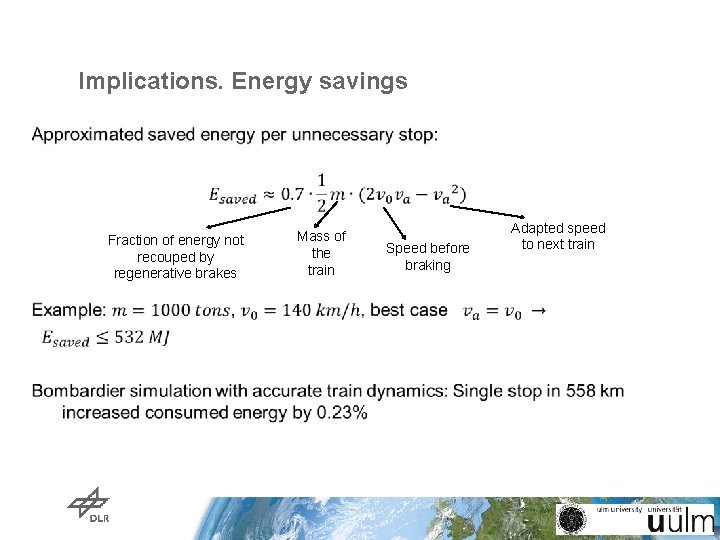
Implications. Energy savings Fraction of energy not recouped by regenerative brakes Mass of the train Speed before braking Adapted speed to next train
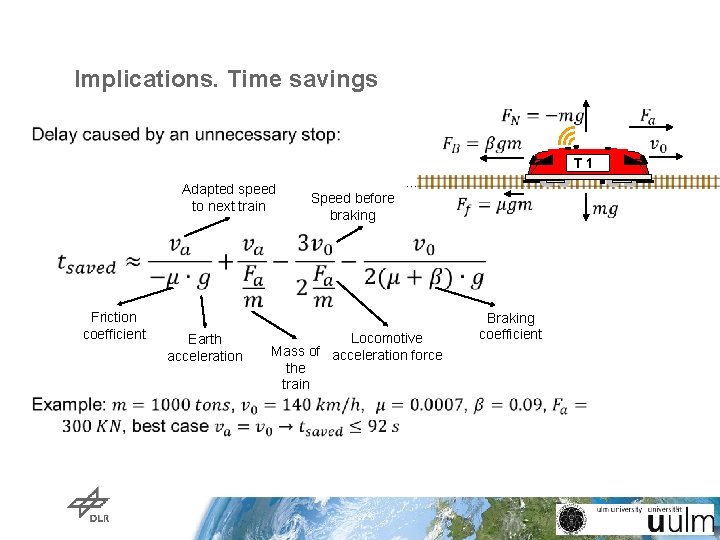
Implications. Time savings T 1 Adapted speed to next train . . . Speed before braking Friction coefficient Earth acceleration Locomotive Mass of acceleration force the train Braking coefficient
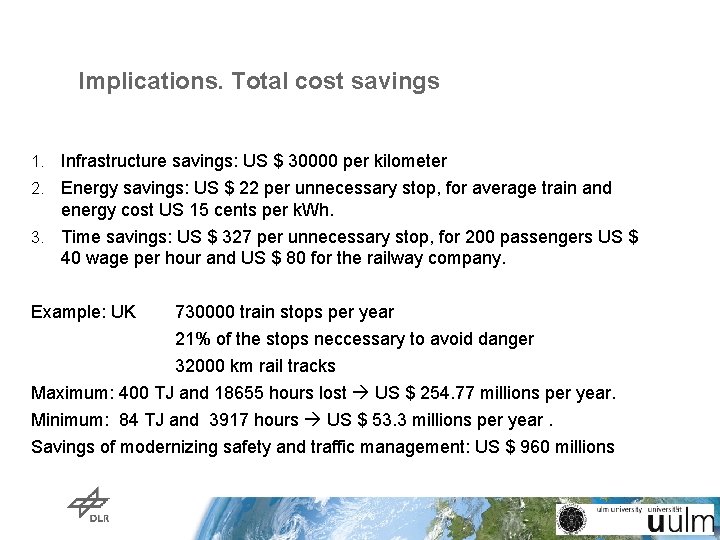
Implications. Total cost savings 1. Infrastructure savings: US $ 30000 per kilometer 2. Energy savings: US $ 22 per unnecessary stop, for average train and energy cost US 15 cents per k. Wh. 3. Time savings: US $ 327 per unnecessary stop, for 200 passengers US $ 40 wage per hour and US $ 80 for the railway company. Example: UK 730000 train stops per year 21% of the stops neccessary to avoid danger 32000 km rail tracks Maximum: 400 TJ and 18655 hours lost US $ 254. 77 millions per year. Minimum: 84 TJ and 3917 hours US $ 53. 3 millions per year. Savings of modernizing safety and traffic management: US $ 960 millions
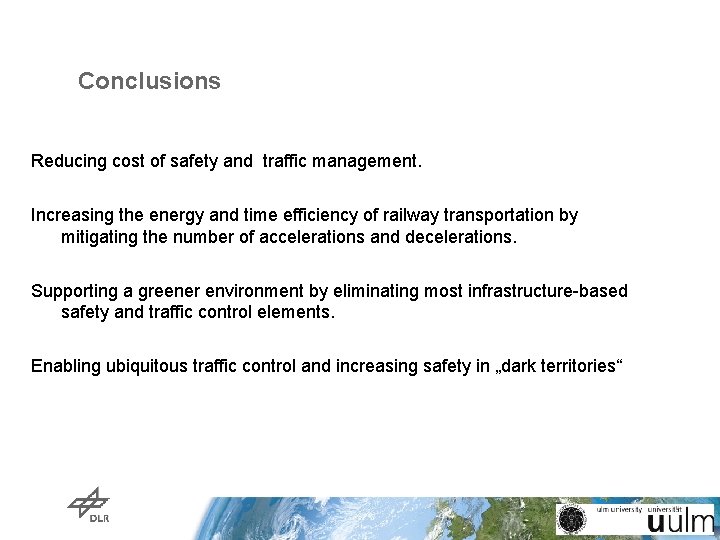
Conclusions Reducing cost of safety and traffic management. Increasing the energy and time efficiency of railway transportation by mitigating the number of accelerations and decelerations. Supporting a greener environment by eliminating most infrastructure-based safety and traffic control elements. Enabling ubiquitous traffic control and increasing safety in „dark territories“
www. DLR. de • Chart 41 > Adatptive and Tractable Bayesian Context Inference for Resource Constrained Devices> Korbinian Frank > 25/07/12 Case Study: a Suitable Protocol for RCAS Worst case scenario: Highest density in larger area. Shunting Yards. Bailey Yard, USA: Length: > 13 km Width: 3. 2 km Dailiyrolling stocks: 10000 Maschen, Germany: Length: > 6 km Width: 0. 7 km Dailiyrolling stocks: 11000 Approximated by 1 -Dimenstional interference Network.
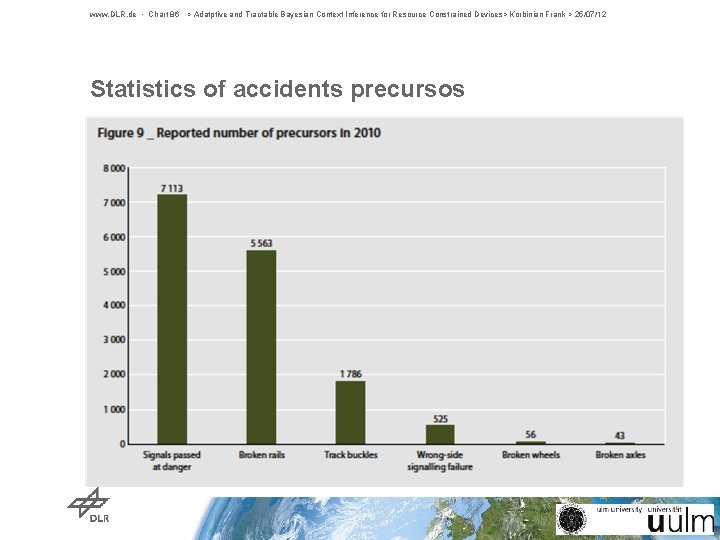
www. DLR. de • Chart 42 > Medium Access Control Protocols in Mobile Ad-hoc Networks Using Beaconing> Cristina Rico > 26/09/12 Case Study: a Suitable Protocol for RCAS Communication range: 4¢ dbrake¼ 5 km Worst-case scenario: Highest density in larger area Shunting Yards Maschen, Germany: Length: > 6 km Width: 0. 7 km Density: 100 Statistics of accidents: 2138 accidents and 7113 Signals passed at a danger (SPAs) in EU-27 in 2012 40 kbits/s 122 kbits/s 200 kbits/s
www. DLR. de • Chart 43 > Medium Access Control Protocols in Mobile Ad-hoc Networks Using Beaconing> Cristina Rico > 26/09/12
State of the Art
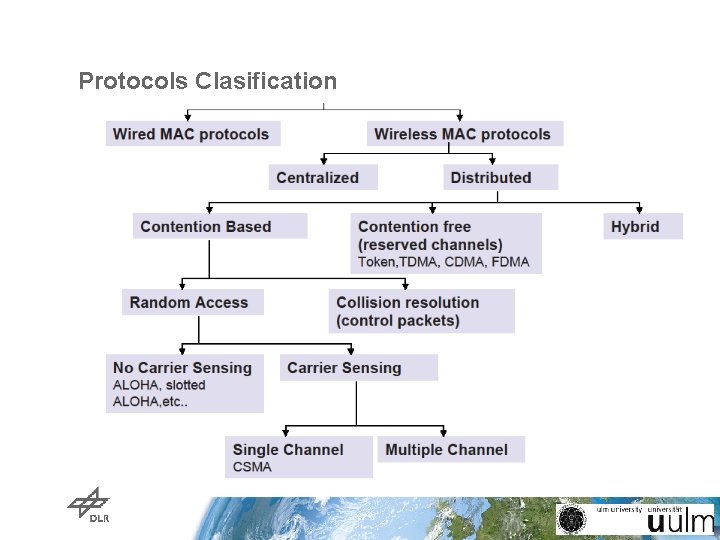
Protocols Clasification
Information Theory approach
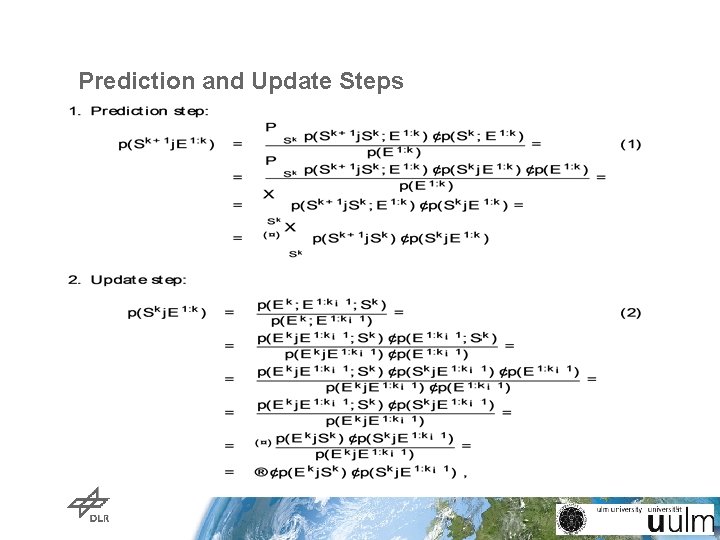
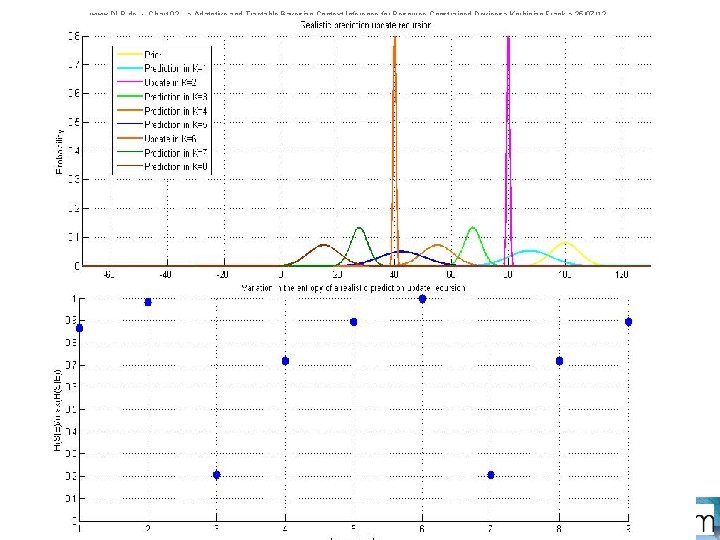
Prediction and Update Steps
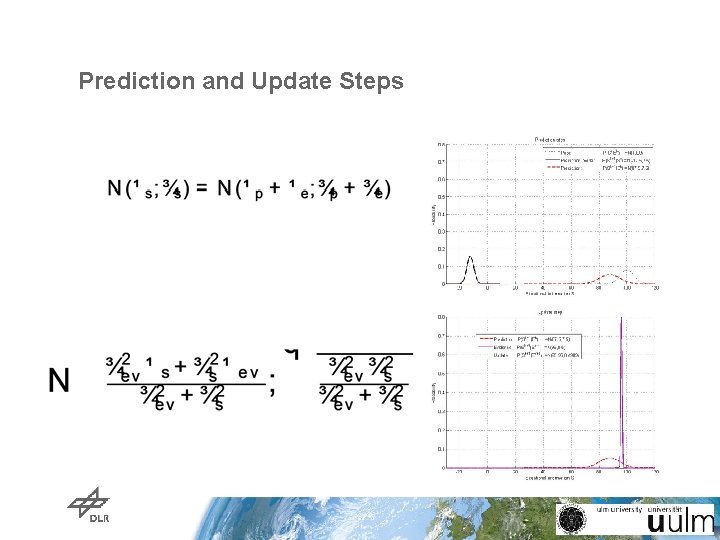
Prediction and Update Steps
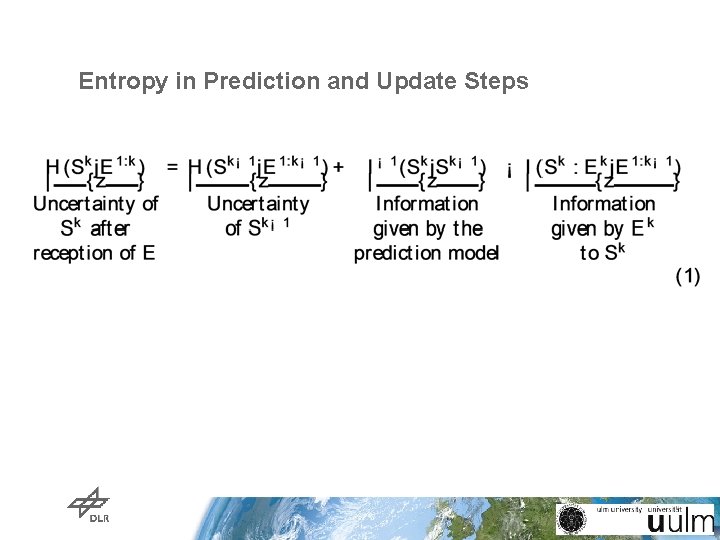
Entropy in Prediction and Update Steps
Metrics
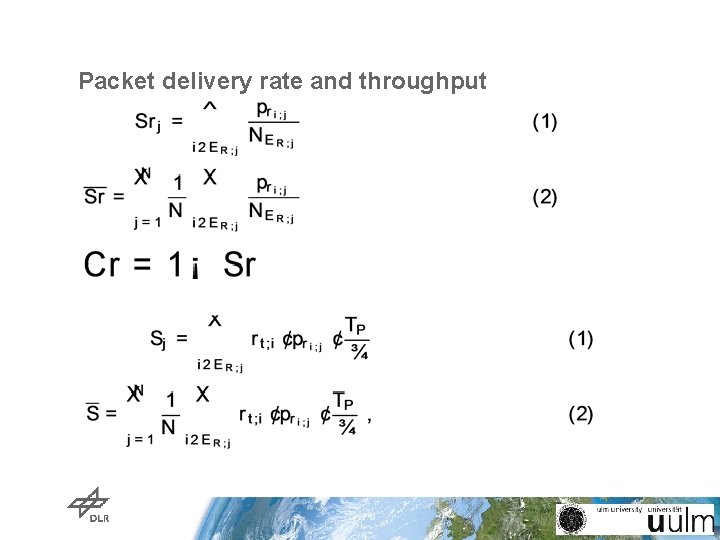
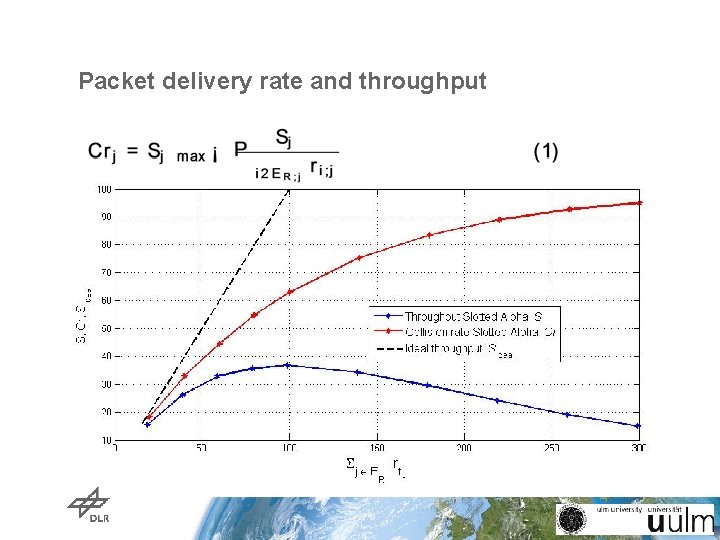
Packet delivery rate and throughput
Packet delivery rate and throughput
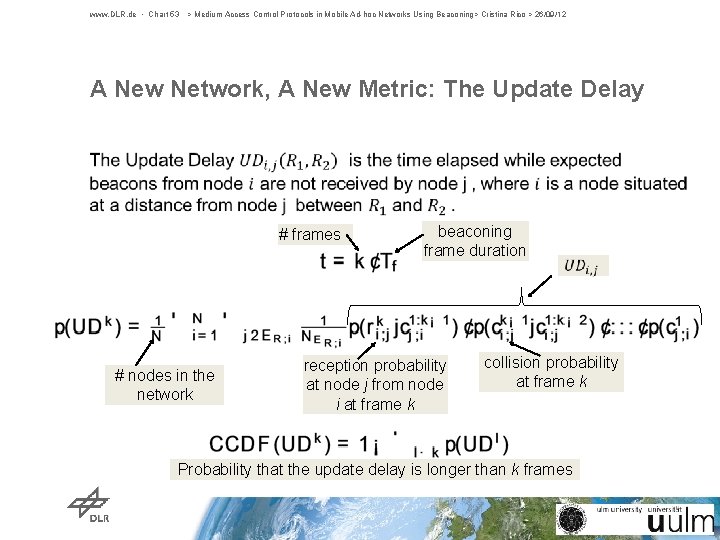
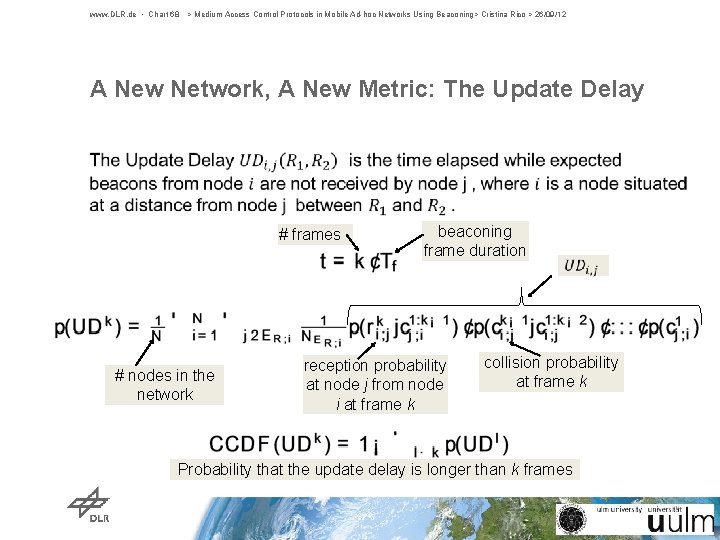
www. DLR. de • Chart 53 > Medium Access Control Protocols in Mobile Ad-hoc Networks Using Beaconing> Cristina Rico > 26/09/12 A New Network, A New Metric: The Update Delay • # frames # nodes in the network beaconing frame duration reception probability at node j from node i at frame k collision probability at frame k Probability that the update delay is longer than k frames
Performance Factors
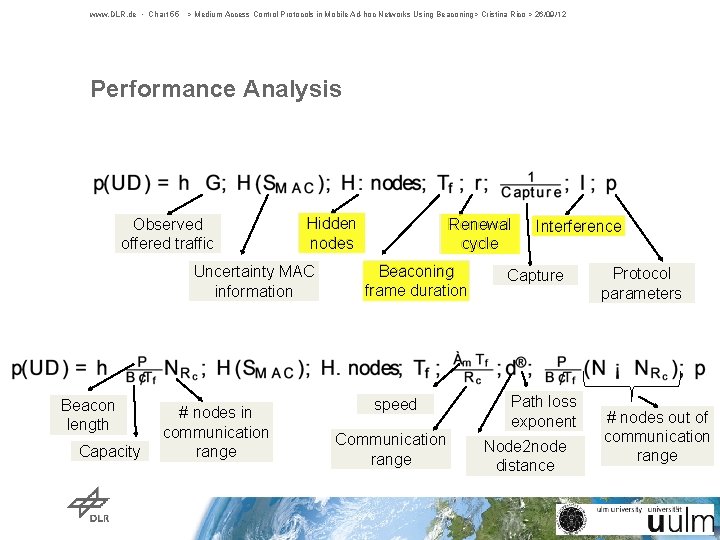
www. DLR. de • Chart 55 > Medium Access Control Protocols in Mobile Ad-hoc Networks Using Beaconing> Cristina Rico > 26/09/12 Performance Analysis Observed offered traffic Hidden nodes Uncertainty MAC information Beacon length Capacity # nodes in communication range Renewal cycle Beaconing frame duration speed Communication range Interference Capture Path loss exponent Node 2 node distance Protocol parameters # nodes out of communication range
www. DLR. de • Chart 56 > Medium Access Control Protocols in Mobile Ad-hoc Networks Using Beaconing> Cristina Rico > 18/10/12 Performance Analysis with Update Delay Performance factors: v p(UD)=f(v 1, …, v 8) Observed offered traffic System, application, and environmental parameters Bits, capacity, # nodes Uncertainty MAC information Hidden nodes Renewal cycle, beaconing Beaconing frame duration Renewal cycle Speed, comm. range Capture Interference Nodes distance, path loss Nodes in network Protocol parameters
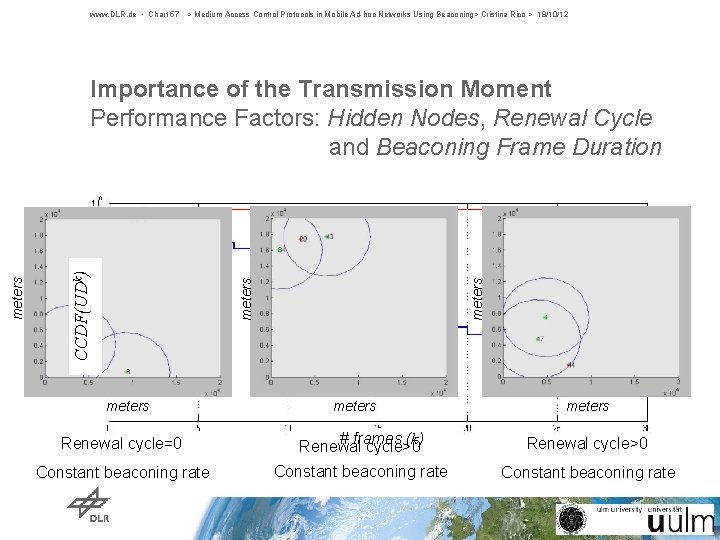
www. DLR. de • Chart 57 > Medium Access Control Protocols in Mobile Ad-hoc Networks Using Beaconing> Cristina Rico > 18/10/12 meters CCDF(UDk) meters Importance of the Transmission Moment Performance Factors: Hidden Nodes, Renewal Cycle and Beaconing Frame Duration meters Renewal cycle=0 # frames (k) Renewal cycle>0 Constant beaconing rate
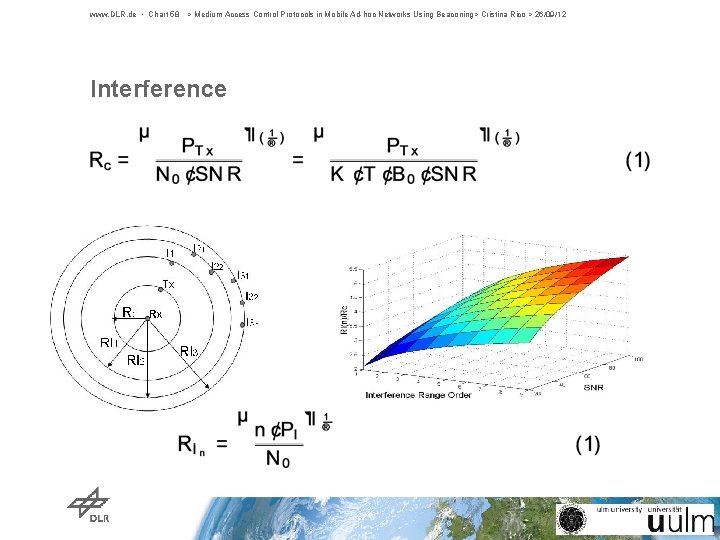
www. DLR. de • Chart 58 > Medium Access Control Protocols in Mobile Ad-hoc Networks Using Beaconing> Cristina Rico > 26/09/12 Interference
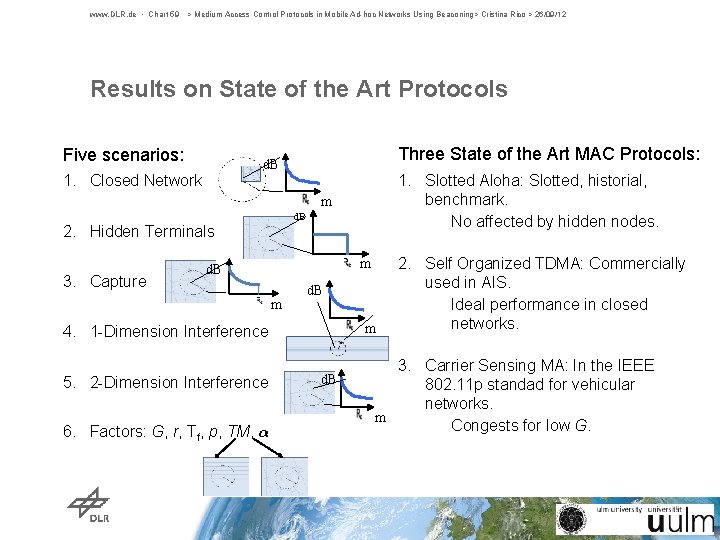
www. DLR. de • Chart 59 > Medium Access Control Protocols in Mobile Ad-hoc Networks Using Beaconing> Cristina Rico > 26/09/12 Results on State of the Art Protocols Five scenarios: Three State of the Art MAC Protocols: d. B 1. Closed Network 1. Slotted Aloha: Slotted, historial, benchmark. No affected by hidden nodes. m d. B 2. Hidden Terminals 3. Capture m d. B m 4. 1 -Dimension Interference 5. 2 -Dimension Interference 6. Factors: G, r, Tf, p, TM, ® d. B 2. Self Organized TDMA: Commercially used in AIS. Ideal performance in closed networks. 3. Carrier Sensing MA: In the IEEE 802. 11 p standad for vehicular networks. m Congests for low G.
Optimization
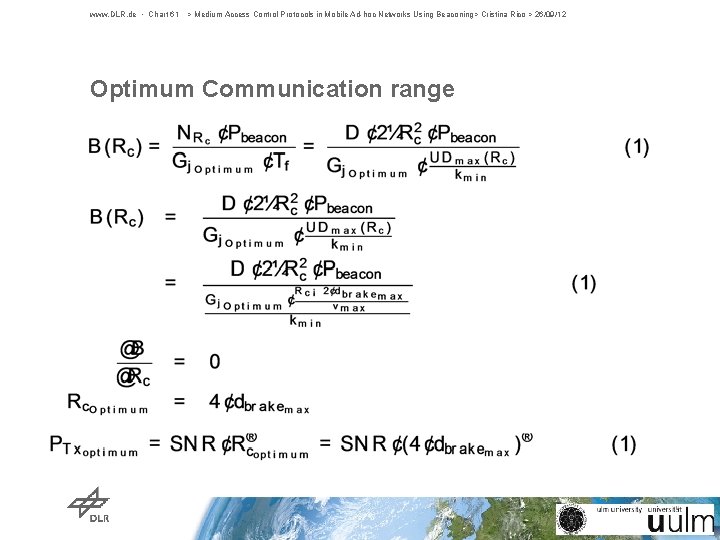
www. DLR. de • Chart 61 > Medium Access Control Protocols in Mobile Ad-hoc Networks Using Beaconing> Cristina Rico > 26/09/12 Optimum Communication range
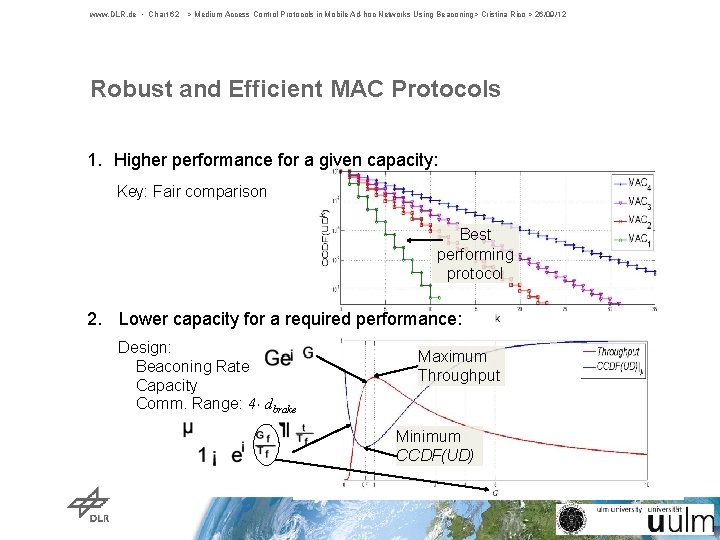
www. DLR. de • Chart 62 > Medium Access Control Protocols in Mobile Ad-hoc Networks Using Beaconing> Cristina Rico > 26/09/12 Robust and Efficient MAC Protocols 1. Higher performance for a given capacity: Key: Fair comparison Best performing protocol 2. Lower capacity for a required performance: Design: Beaconing Rate Capacity Comm. Range: 4¢ dbrake Maximum Throughput Minimum CCDF(UD)
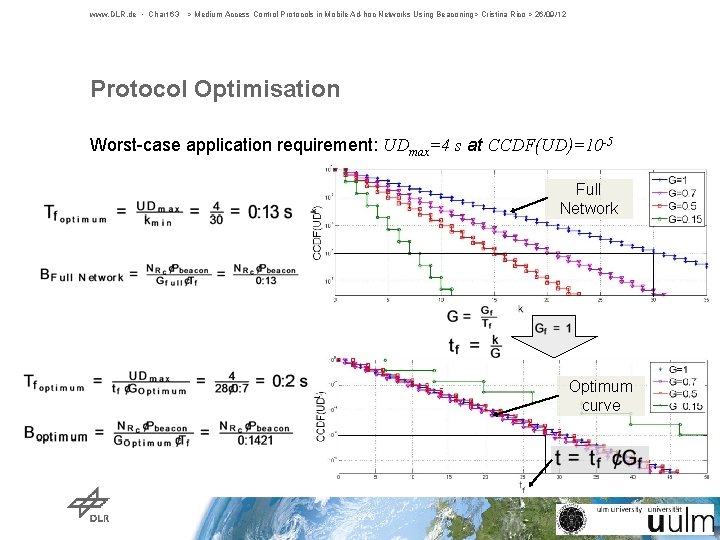
www. DLR. de • Chart 63 > Medium Access Control Protocols in Mobile Ad-hoc Networks Using Beaconing> Cristina Rico > 26/09/12 Protocol Optimisation Worst-case application requirement: UDmax=4 s at CCDF(UD)=10 -5 Full Network Optimum curve
Slotted Aloha
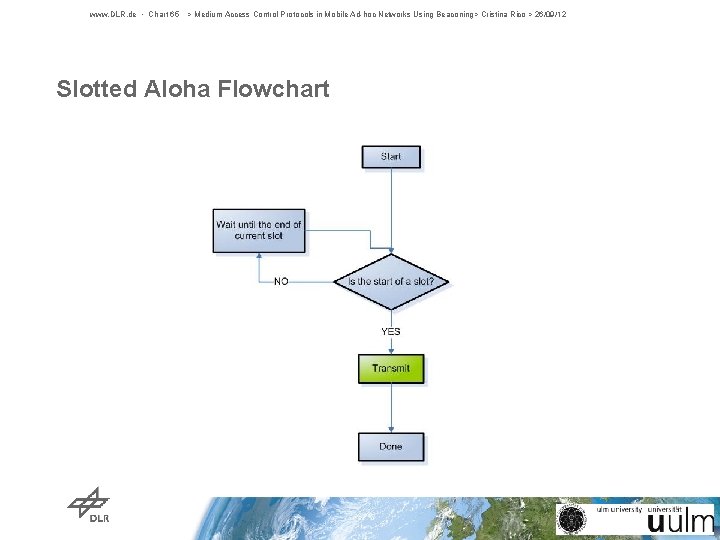
www. DLR. de • Chart 65 > Medium Access Control Protocols in Mobile Ad-hoc Networks Using Beaconing> Cristina Rico > 26/09/12 Slotted Aloha Flowchart
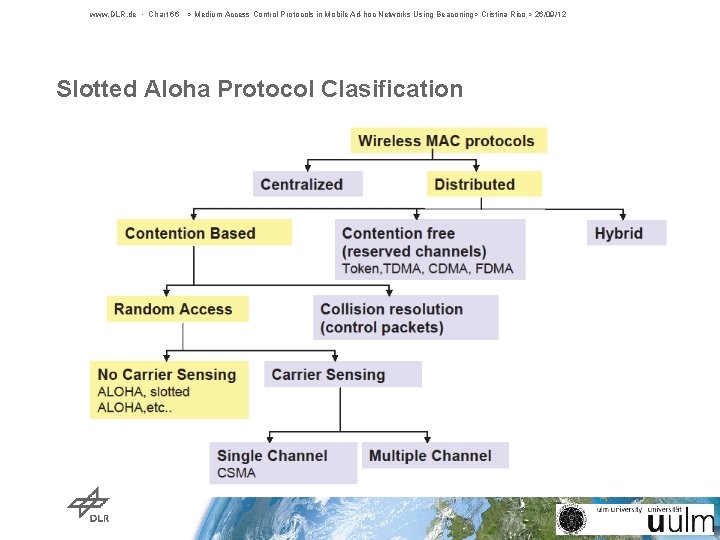
www. DLR. de • Chart 66 > Medium Access Control Protocols in Mobile Ad-hoc Networks Using Beaconing> Cristina Rico > 26/09/12 Slotted Aloha Protocol Clasification
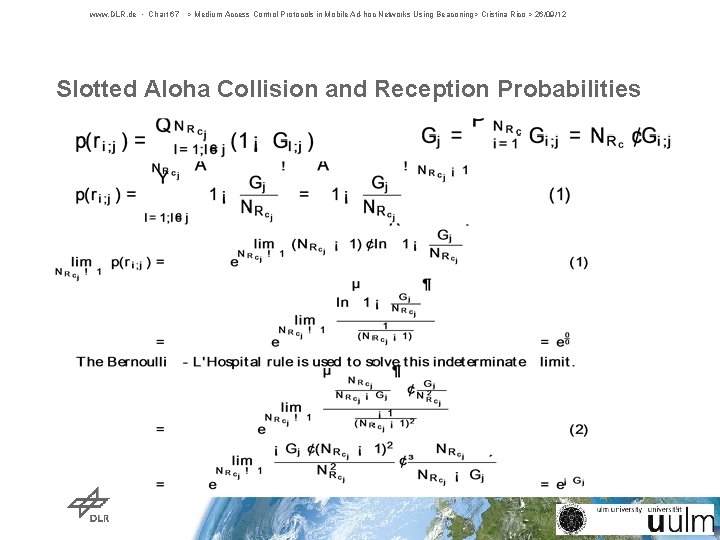
www. DLR. de • Chart 67 > Medium Access Control Protocols in Mobile Ad-hoc Networks Using Beaconing> Cristina Rico > 26/09/12 Slotted Aloha Collision and Reception Probabilities
www. DLR. de • Chart 68 > Medium Access Control Protocols in Mobile Ad-hoc Networks Using Beaconing> Cristina Rico > 26/09/12 A New Network, A New Metric: The Update Delay • # frames # nodes in the network beaconing frame duration reception probability at node j from node i at frame k collision probability at frame k Probability that the update delay is longer than k frames
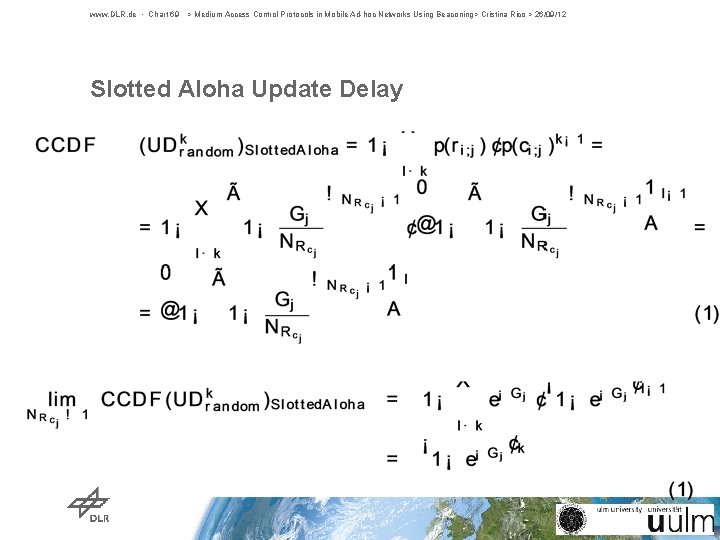
www. DLR. de • Chart 69 > Medium Access Control Protocols in Mobile Ad-hoc Networks Using Beaconing> Cristina Rico > 26/09/12 Slotted Aloha Update Delay
SOTDMA
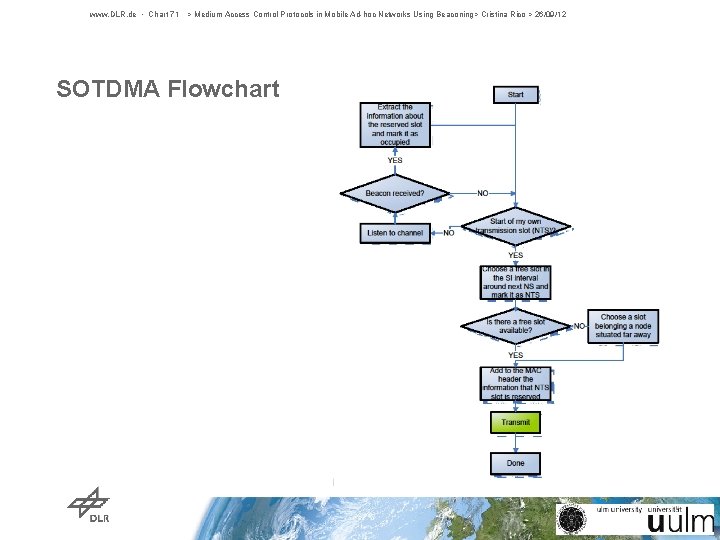
www. DLR. de • Chart 71 > Medium Access Control Protocols in Mobile Ad-hoc Networks Using Beaconing> Cristina Rico > 26/09/12 SOTDMA Flowchart
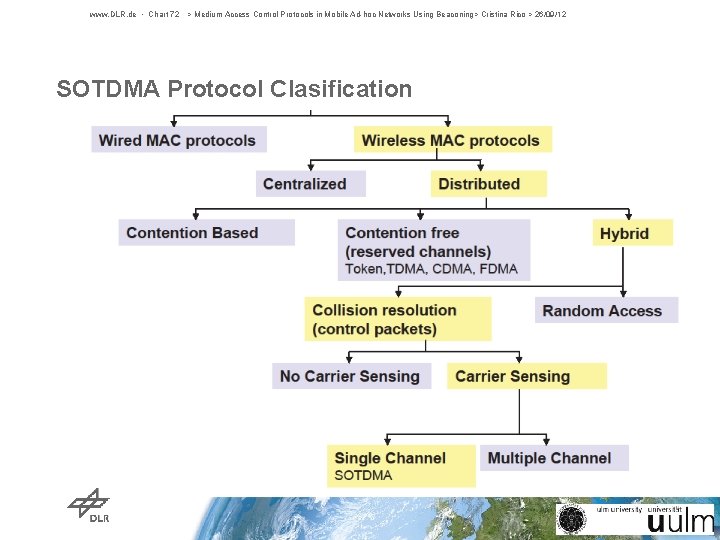
www. DLR. de • Chart 72 > Medium Access Control Protocols in Mobile Ad-hoc Networks Using Beaconing> Cristina Rico > 26/09/12 SOTDMA Protocol Clasification
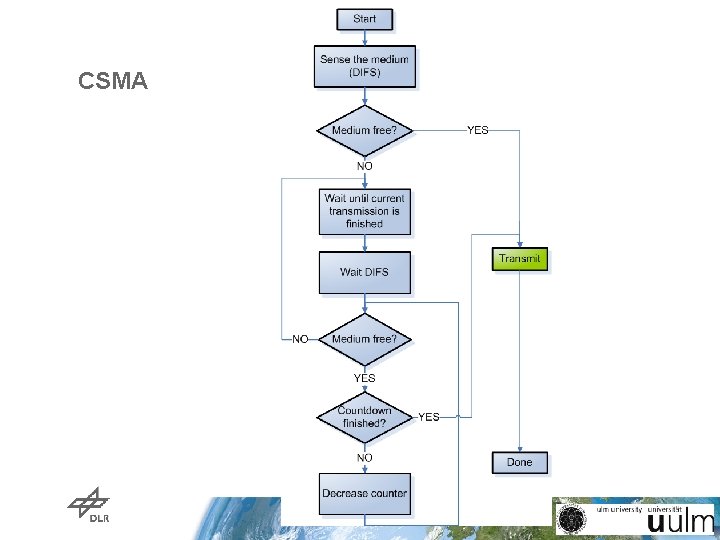
CSMA
CSMA
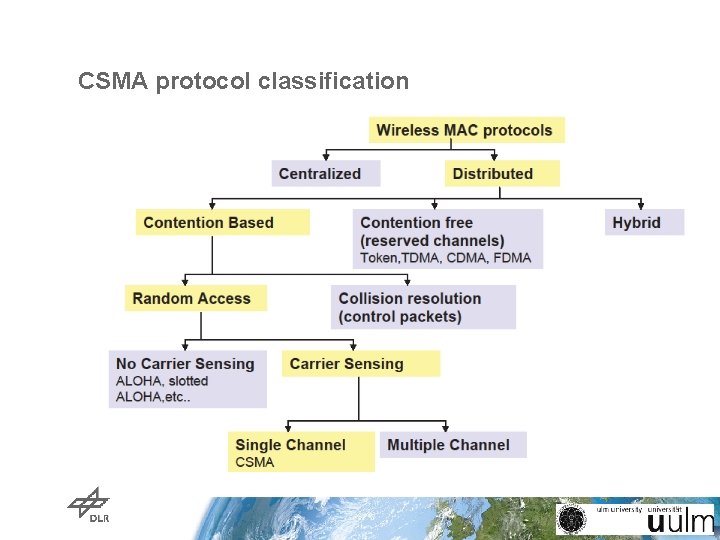
CSMA protocol classification
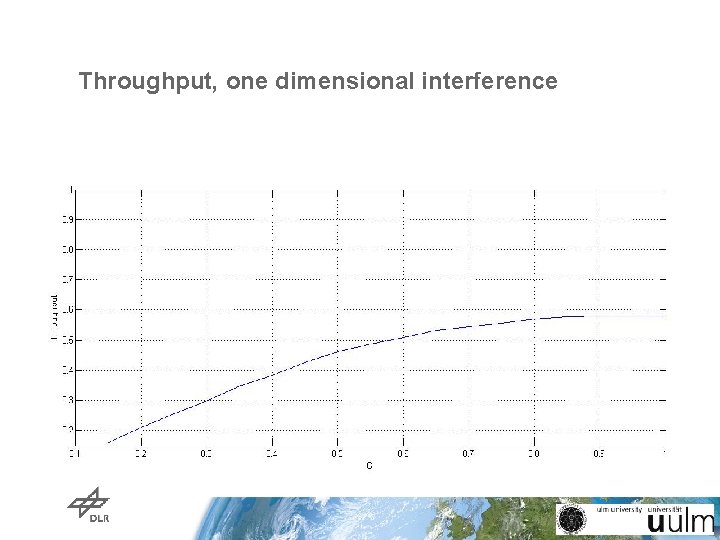
Throughput, one dimensional interference
COMB
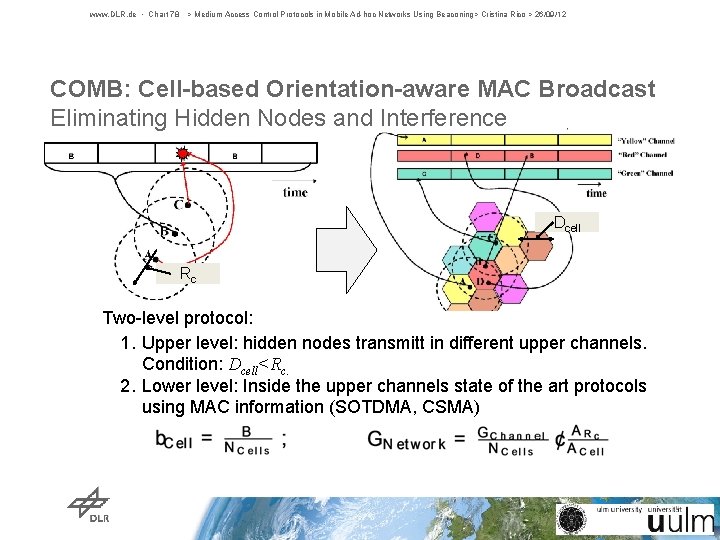
www. DLR. de • Chart 78 > Medium Access Control Protocols in Mobile Ad-hoc Networks Using Beaconing> Cristina Rico > 26/09/12 COMB: Cell-based Orientation-aware MAC Broadcast Eliminating Hidden Nodes and Interference Dcell Rc Two-level protocol: 1. Upper level: hidden nodes transmitt in different upper channels. Condition: Dcell<Rc. 2. Lower level: Inside the upper channels state of the art protocols using MAC information (SOTDMA, CSMA)
www. DLR. de • Chart 79 > Medium Access Control Protocols in Mobile Ad-hoc Networks Using Beaconing> Cristina Rico > 26/09/12 COMB for Two-dimensional Interference Networks 3 Elimination of hidden nodes: 12 11 4 1 6 5 9 Elimination of first interference zone: 10 8 12 3 7 11 6 5 2 1 4 1 1
www. DLR. de • Chart 80 > Medium Access Control Protocols in Mobile Ad-hoc Networks Using Beaconing> Cristina Rico > 26/09/12 COMB for One-dimensional Interference Networks 11 2 Eliminate hidden nodes: Eliminate first interference zone: 1 2 1 2 1
www. DLR. de • Chart 81 > Adatptive and Tractable Bayesian Context Inference for Resource Constrained Devices> Korbinian Frank > 25/07/12 COMB for Two-dimensional Interference Networks 3 Eliminate hidden nodes: 12 11 4 Eliminate first interference zone: 1 6 5 9 10 8 12 3 7 11 6 5 2 1 4 1 1
www. DLR. de • Chart 82 > Adatptive and Tractable Bayesian Context Inference for Resource Constrained Devices> Korbinian Frank > 25/07/12 COMB for One-dimensional Interference Networks 11 2 1 2 1 2 1
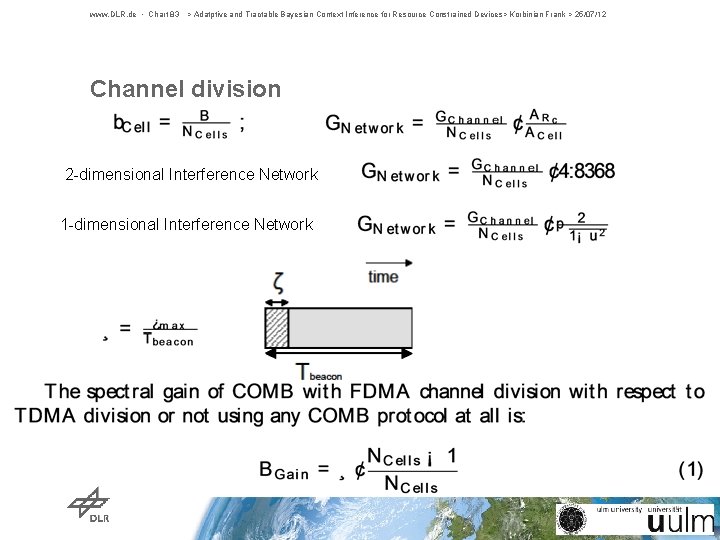
www. DLR. de • Chart 83 > Adatptive and Tractable Bayesian Context Inference for Resource Constrained Devices> Korbinian Frank > 25/07/12 Channel division 2 -dimensional Interference Network 1 -dimensional Interference Network
Statistics
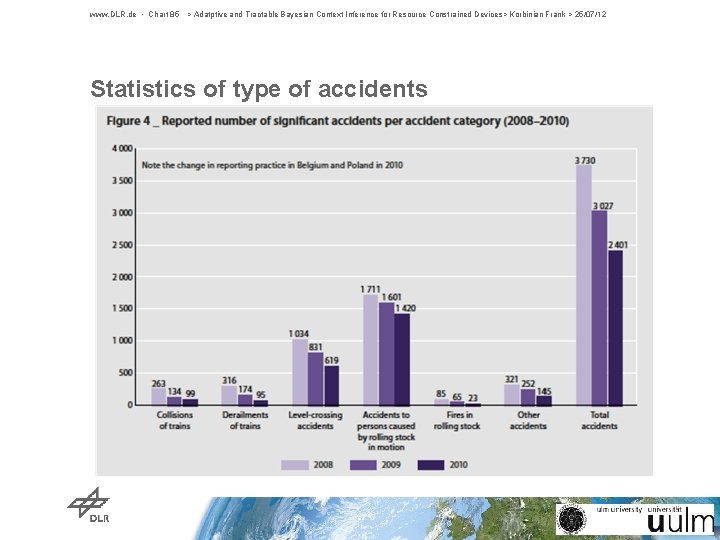
www. DLR. de • Chart 85 > Adatptive and Tractable Bayesian Context Inference for Resource Constrained Devices> Korbinian Frank > 25/07/12 Statistics of type of accidents
www. DLR. de • Chart 86 > Adatptive and Tractable Bayesian Context Inference for Resource Constrained Devices> Korbinian Frank > 25/07/12 Statistics of accidents precursos
Synchronization
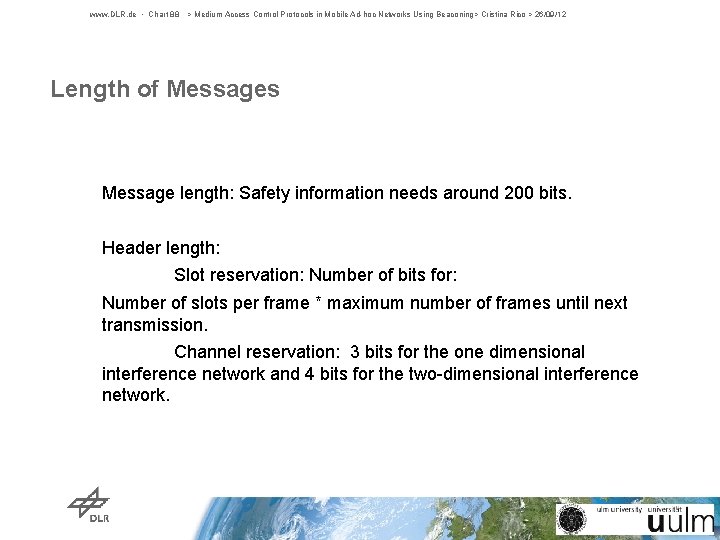
www. DLR. de • Chart 88 > Medium Access Control Protocols in Mobile Ad-hoc Networks Using Beaconing> Cristina Rico > 26/09/12 Length of Messages Message length: Safety information needs around 200 bits. Header length: Slot reservation: Number of bits for: Number of slots per frame * maximum number of frames until next transmission. Channel reservation: 3 bits for the one dimensional interference network and 4 bits for the two-dimensional interference network.
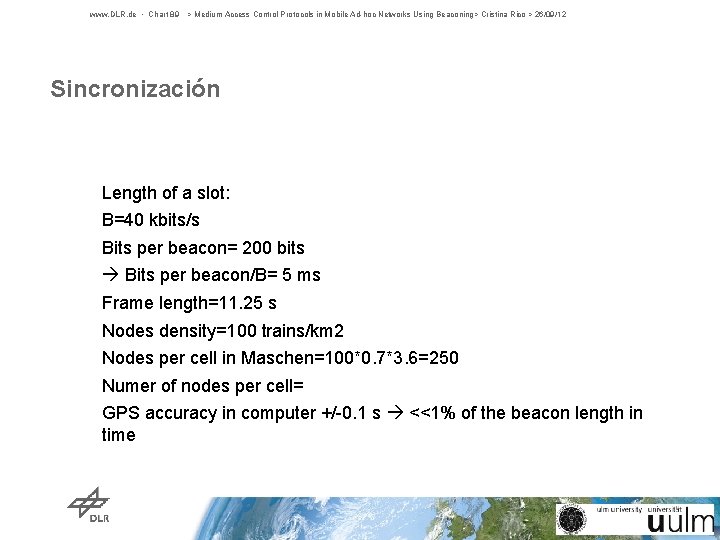
www. DLR. de • Chart 89 > Medium Access Control Protocols in Mobile Ad-hoc Networks Using Beaconing> Cristina Rico > 26/09/12 Sincronización Length of a slot: B=40 kbits/s Bits per beacon= 200 bits Bits per beacon/B= 5 ms Frame length=11. 25 s Nodes density=100 trains/km 2 Nodes per cell in Maschen=100*0. 7*3. 6=250 Numer of nodes per cell= GPS accuracy in computer +/-0. 1 s <<1% of the beacon length in time
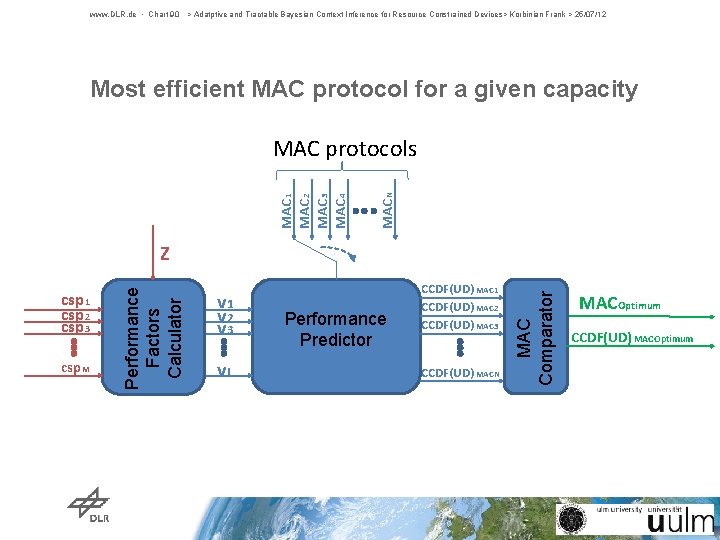
www. DLR. de • Chart 90 > Adatptive and Tractable Bayesian Context Inference for Resource Constrained Devices> Korbinian Frank > 25/07/12 Most efficient MAC protocol for a given capacity MACN MAC 1 MAC 2 MAC 3 MAC 4 MAC protocols csp M v 1 v 2 v 3 v. L Performance Predictor CCDF(UD) MAC 1 CCDF(UD) MAC 2 CCDF(UD) MAC 3 CCDF(UD) MACN MAC Comparator csp 1 csp 2 csp 3 Performance Factors Calculator Z MACOptimum CCDF(UD) MACOptimum
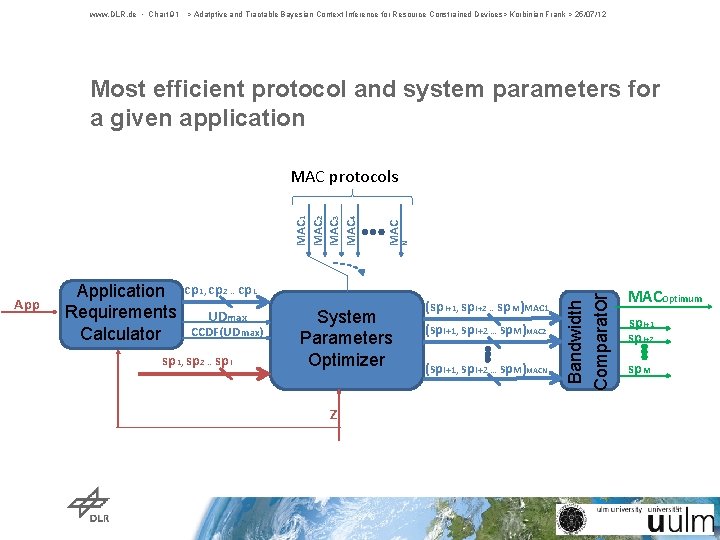
www. DLR. de • Chart 91 > Adatptive and Tractable Bayesian Context Inference for Resource Constrained Devices> Korbinian Frank > 25/07/12 Most efficient protocol and system parameters for a given application sp 1, sp 2 … sp. I System Parameters Optimizer Z N (sp I+1, sp. I+2 … sp. M)MAC 1 (sp I+1, sp. I+2 … sp. M)MAC 2 (sp I+1, sp. I+2 … sp. M)MACN Bandwidth Comparator Application cp 1, cp 2 … cp. L Requirements UDmax CCDF(UD max) Calculator MAC 1 MAC 2 MAC 3 MAC 4 MAC protocols MACOptimum sp. I+1 sp. I+2 sp. M
www. DLR. de • Chart 92 > Adatptive and Tractable Bayesian Context Inference for Resource Constrained Devices> Korbinian Frank > 25/07/12 Outline 1. Introduction 2. Bayeslets: Modular Bayesian Inference Rules 3. A Bayeslet for the Estimation of Symbolic Location 4. A Bayeslet for Human Motion Related Activity Recognition 5. Contributions
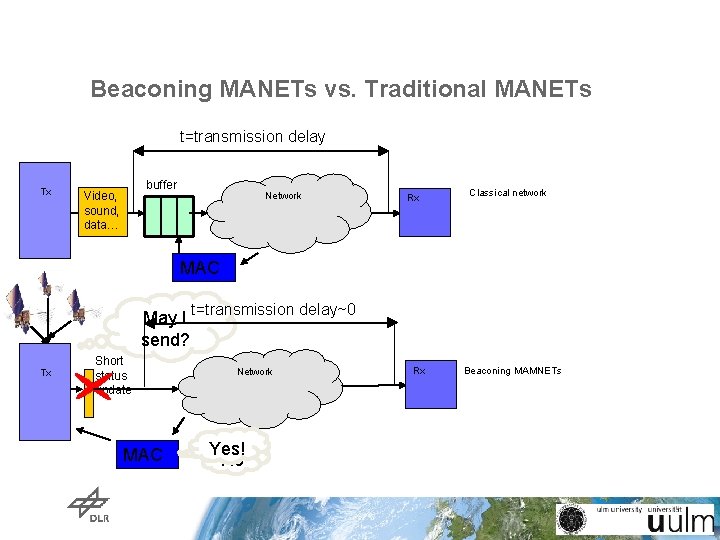
Beaconing MANETs vs. Traditional MANETs t=transmission delay Tx buffer Video, sound, data… Network Rx Classical network MAC t=transmission delay~0 May I send? Tx Short status update MAC Network Yes! No Rx Beaconing MAMNETs
www. DLR. de • Chart 94 > Medium Access Control Protocols in Mobile Ad-hoc Networks Using Beaconing> Cristina Rico > 26/09/12 PDF Position Problem Statement Entropy 1 max Entropy ? ? ? time