
www bsc es BSC TOOLS INSTRUMENTATION ANALYSIS Juan
www. bsc. es BSC TOOLS: INSTRUMENTATION &ANALYSIS Juan Gonzalez JLPC Summer School, Sophia Antipolis, June 2014
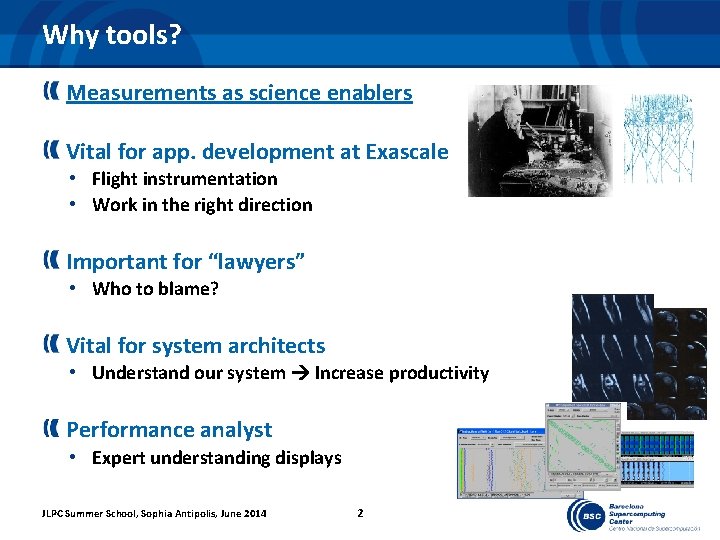
Why tools? Measurements as science enablers Vital for app. development at Exascale • Flight instrumentation • Work in the right direction Important for “lawyers” • Who to blame? Vital for system architects • Understand our system Increase productivity Performance analyst • Expert understanding displays JLPC Summer School, Sophia Antipolis, June 2014 2
Tools in… Science Computer science • printf() • Timers • Lots of speculation • We see • We talk about Physics • One “expensive” Parallel computing • Just another system • We should use similar experiment • Lots of data to analyse • To understand a nature system JLPC Summer School, Sophia Antipolis, June 2014 practices and techniques 3
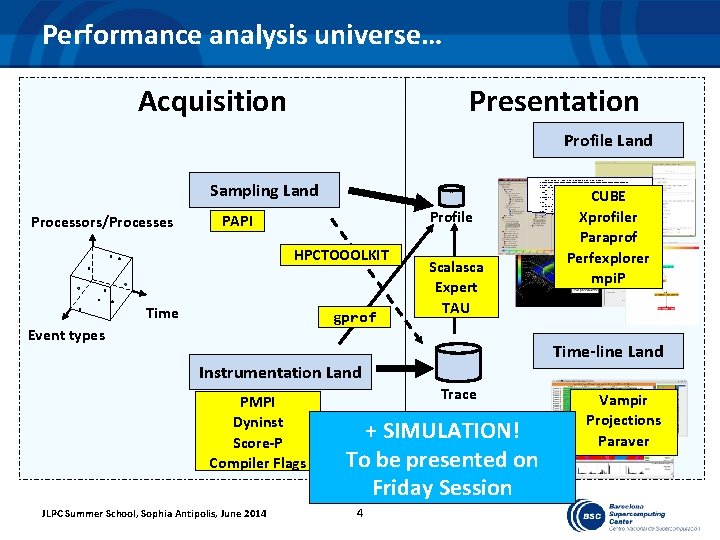
Performance analysis universe… Acquisition Presentation Profile Land Sampling Land Processors/Processes Profile PAPI HPCTOOOLKIT Time gprof Event types Scalasca Expert TAU JLPC Summer School, Sophia Antipolis, June 2014 Trace + SIMULATION! To be presented on Friday Session 4 CUBE Xprofiler Paraprof Perfexplorer mpi. P Time-line Land Instrumentation Land PMPI Dyninst Score-P Compiler Flags Function list, in descending order by exclusive time ------------------------------------[index] excl. secs excl. % cum. % incl. secs incl. % samples procedure (dso: file, line) [4] 4. 500 97. 4% 150 bmod (LUBb: LUBb. f, 122) [5] 0. 060 1. 3% 98. 7% 0. 060 1. 3% 2 genmat (LUBb: prepost. f, 1) [6] 0. 060 1. 3% 100. 0% 0. 060 1. 3% 2 bdiv (LUBb: LUBb. f, 85) [1] 0. 000 0. 0% 100. 0% 4. 620 100. 0% 154 __start (LUBb: crt 1 text. s, 103) [2] 0. 000 0. 0% 100. 0% 4. 620 100. 0% 154 main (libftn. so: main. c, 76) [3] 0. 000 0. 0% 100. 0% 4. 620 100. 0% 154 LUBb (LUBb: LUBb. f, 1) Vampir Projections Paraver
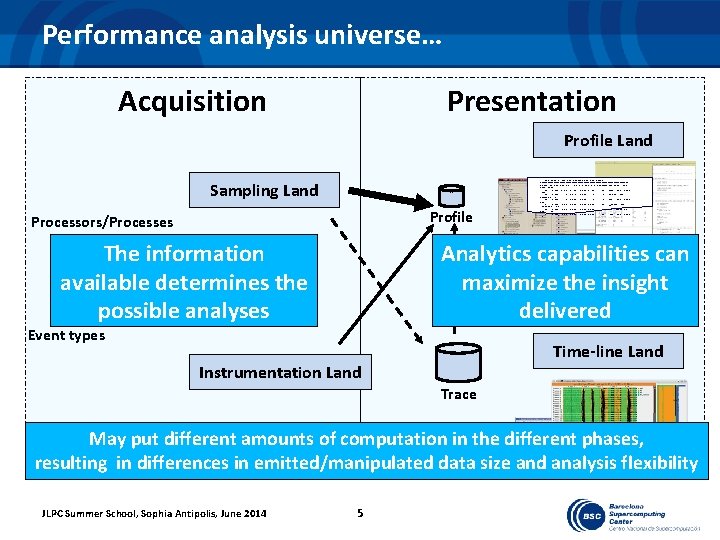
Performance analysis universe… Acquisition Presentation Profile Land Sampling Land Profile Processors/Processes The information available determines the Time analyses possible Function list, in descending order by exclusive time ------------------------------------[index] excl. secs excl. % cum. % incl. secs incl. % samples procedure (dso: file, line) [4] 4. 500 97. 4% 150 bmod (LUBb: LUBb. f, 122) [5] 0. 060 1. 3% 98. 7% 0. 060 1. 3% 2 genmat (LUBb: prepost. f, 1) [6] 0. 060 1. 3% 100. 0% 0. 060 1. 3% 2 bdiv (LUBb: LUBb. f, 85) [1] 0. 000 0. 0% 100. 0% 4. 620 100. 0% 154 __start (LUBb: crt 1 text. s, 103) [2] 0. 000 0. 0% 100. 0% 4. 620 100. 0% 154 main (libftn. so: main. c, 76) [3] 0. 000 0. 0% 100. 0% 4. 620 100. 0% 154 LUBb (LUBb: LUBb. f, 1) Analytics capabilities can maximize the insight delivered Event types Time-line Land Instrumentation Land Trace May put different amounts of computation in the different phases, resulting in differences in emitted/manipulated data size and analysis flexibility JLPC Summer School, Sophia Antipolis, June 2014 5
Performance tools OBJECTIVE: • Identify performance problems to help optimizing apps. PHASES: • Data acquisition • (Data emission) • Compaction • Summarization • Data presentation JLPC Summer School, Sophia Antipolis, June 2014 6
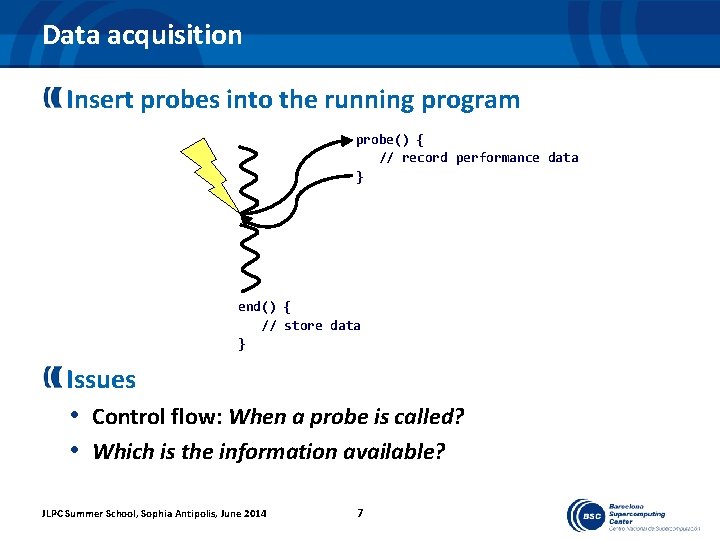
Data acquisition Insert probes into the running program probe() { // record performance data } end() { // store data } Issues • Control flow: When a probe is called? • Which is the information available? JLPC Summer School, Sophia Antipolis, June 2014 7
Data acquisition: control flow Sampling • Punctual records of app. activity • Interrupt driven: correlated (or not) with app. activity • POSIX clocks, PAPI overflows • Need to project samples to total application behaviour Instrumentation • Probes driven by relevant application events • Statically: link with an instrumentation library • PMPI / OMPTI / OMPSs / Charm++ • Dynamic: rewrite the binary • Dyn. Inst / DPCL JLPC Summer School, Sophia Antipolis, June 2014 8
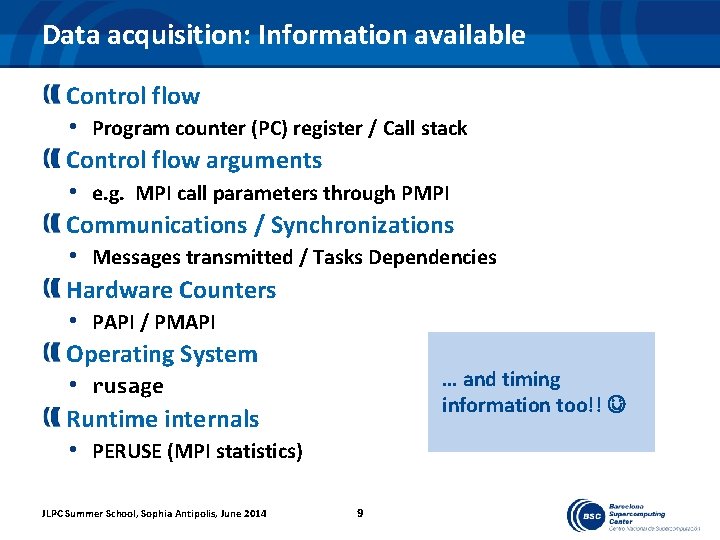
Data acquisition: Information available Control flow • Program counter (PC) register / Call stack Control flow arguments • e. g. MPI call parameters through PMPI Communications / Synchronizations • Messages transmitted / Tasks Dependencies Hardware Counters • PAPI / PMAPI Operating System … and timing • rusage information too!! Runtime internals • PERUSE (MPI statistics) JLPC Summer School, Sophia Antipolis, June 2014 9
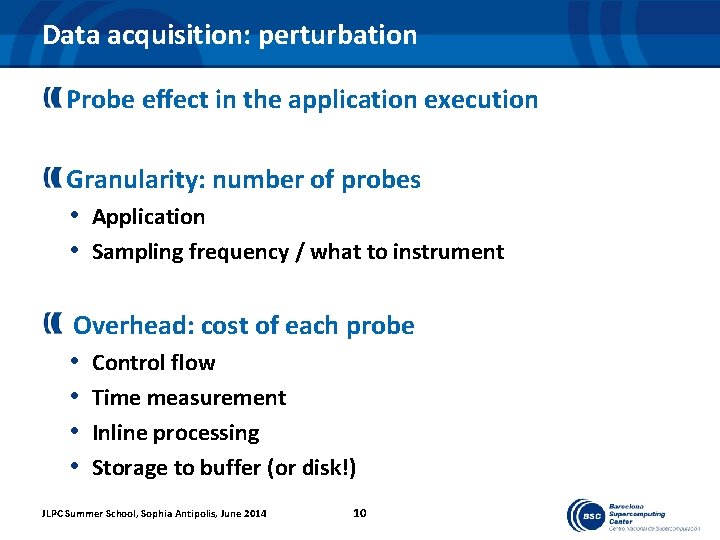
Data acquisition: perturbation Probe effect in the application execution Granularity: number of probes • Application • Sampling frequency / what to instrument Overhead: cost of each probe • Control flow • Time measurement • Inline processing • Storage to buffer (or disk!) JLPC Summer School, Sophia Antipolis, June 2014 10
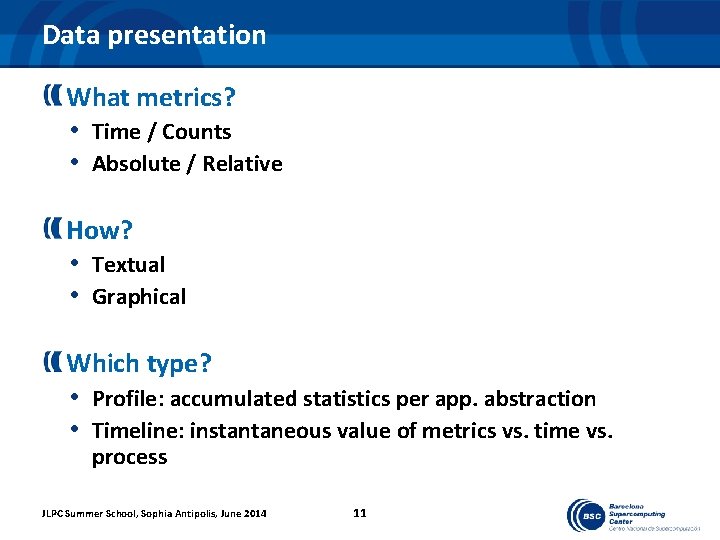
Data presentation What metrics? • Time / Counts • Absolute / Relative How? • Textual • Graphical Which type? • Profile: accumulated statistics per app. abstraction • Timeline: instantaneous value of metrics vs. time vs. process JLPC Summer School, Sophia Antipolis, June 2014 11
Data presentation Keep in mind this objective • Maximize the flow of information you require… • Qualitatively: colours, shapes • Quantitatively: numbers • … by a proper balance of the approaches JLPC Summer School, Sophia Antipolis, June 2014 12
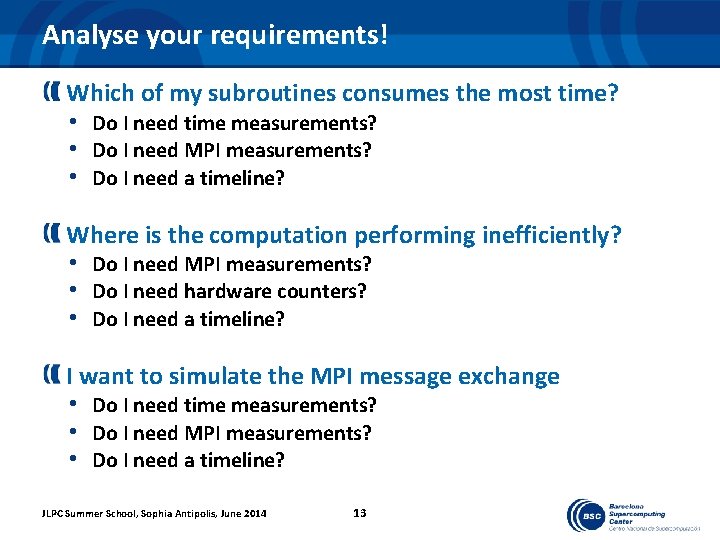
Analyse your requirements! Which of my subroutines consumes the most time? • Do I need time measurements? • Do I need MPI measurements? • Do I need a timeline? Where is the computation performing inefficiently? • Do I need MPI measurements? • Do I need hardware counters? • Do I need a timeline? I want to simulate the MPI message exchange • Do I need time measurements? • Do I need MPI measurements? • Do I need a timeline? JLPC Summer School, Sophia Antipolis, June 2014 13
BSC TOOLS
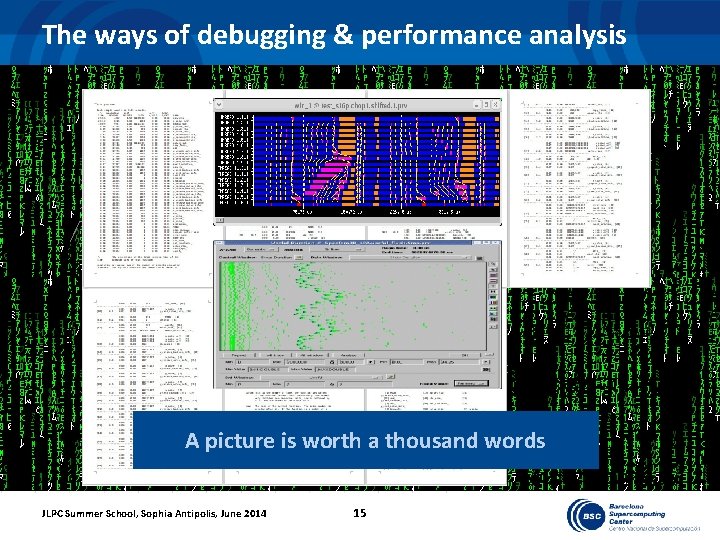
The ways of debugging & performance analysis gettimeofday(&start, NULL); printf(“Hellooooo!? ”); /* Stuff that matters */ … gettimeofday(&end, NULL); printf(“I’m here!”); … printf(“Took %d seconds to get here”, end. tv_sec – start. tv_sec); printf(“Roger that”); NAS BT – 1 task A picture is worth a thousand words NAS BT – 32 tasks JLPC Summer School, Sophia Antipolis, June 2014 15
Performance tools @ BSC Since 1991 Based on traces Flexibility and detail Core Tools Trace generation - Extrae Trace analyzer - Paraver Message passing simulator - Dimemas Open-source Do not speculate about your code performance LOOK AT IT JLPC Summer School, Sophia Antipolis, June 2014 16
A “different” view… Behavioural structure vs. syntactic structure • Algorithmic and performance • In space and time Variability • Multimodal distributions • Variability + synchronization critical non linear effects Flexibility • Let the analyst navigate through capture data • Gain insight minimizing a single app. execution JLPC Summer School, Sophia Antipolis, June 2014 17
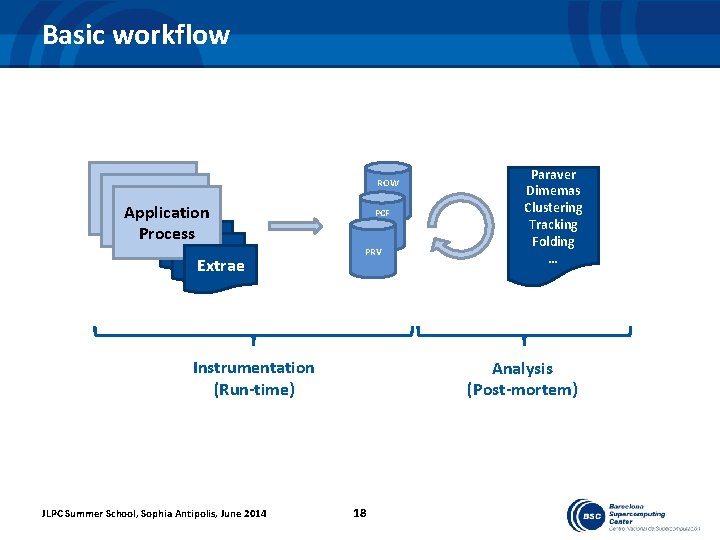
Basic workflow Application Process Extrae ROW PCF PRV Instrumentation (Run-time) JLPC Summer School, Sophia Antipolis, June 2014 Paraver Dimemas Clustering Tracking Folding … Analysis (Post-mortem) 18
The (Paraver) trace Sequence of time stamped records (. prv) • Punctual events • Something happened: when (time) & where (object/entity e. g. thread) • One record (type: value) per specific information • • About the event About the interval from previous event • Relations between objects (… communications) • Source and destination • Attributes (… tag, value) Symbolic information (. pcf) • Strings to name types and events System information (. row) • Strings to name the trace entities JLPC Summer School, Sophia Antipolis, June 2014 19
EXTRAE
Extrae features Parallel programming models • MPI, Open. MP, pthreads, Omp. Ss, CUDA, Open. CL, Intel MIC… Performance Counters • Using PAPI and PMAPI interfaces Link to source code • Callstack at MPI routines • Open. MP outlined routines and their containers • Selected user functions Periodic samples User events (Extrae API) JLPC Summer School, Sophia Antipolis, June 2014 21
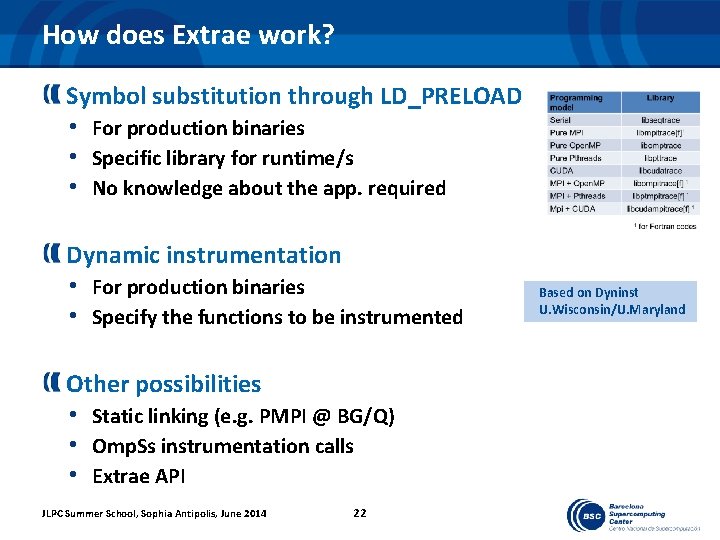
How does Extrae work? Symbol substitution through LD_PRELOAD • For production binaries • Specific library for runtime/s • No knowledge about the app. required Dynamic instrumentation • For production binaries • Specify the functions to be instrumented Other possibilities • Static linking (e. g. PMPI @ BG/Q) • Omp. Ss instrumentation calls • Extrae API JLPC Summer School, Sophia Antipolis, June 2014 22 Based on Dyninst U. Wisconsin/U. Maryland
How to use Extrae? Adapt your submission script • Point the Extrae library require in the LD_PRELOAD • Point to the XML instrumentation control file Specify the data to be captured • Editing the XML instrumentation control file Run and get the trace Extrae 2. 3. 4 User's Guide available in http: //www. bsc. es/computer-sciences/performance-tools/documentation Default control files and further examples within installation in $EXTRAE_HOME/share/example JLPC Summer School, Sophia Antipolis, June 2014 23
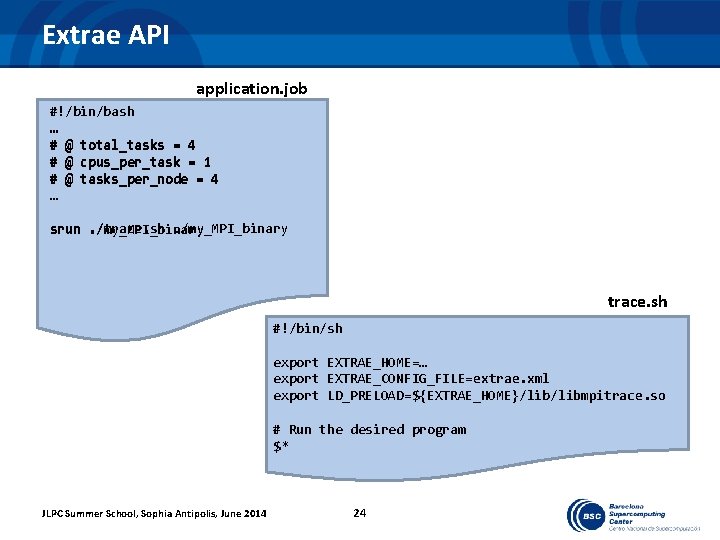
Extrae API application. job #!/bin/bash … # @ total_tasks = 4 # @ cpus_per_task = 1 # @ tasks_per_node = 4 … srun. /trace. sh. /my_MPI_binary trace. sh #!/bin/sh export EXTRAE_HOME=… export EXTRAE_CONFIG_FILE=extrae. xml export LD_PRELOAD=${EXTRAE_HOME}/libmpitrace. so # Run the desired program $* JLPC Summer School, Sophia Antipolis, June 2014 24
Extrae API If the source code is available you can use it to… … scalability • Extrae_shutdown() • Extrae_restart() … inject your own events • Extrae_[n]event(type[s], value[s]) • Extrae_[n]eventandcounters(…) JLPC Summer School, Sophia Antipolis, June 2014 25
Approaches towards scalability Manual selection • Tracing On-Off • Internal / External • Trace/Buffer maximum sizes • Information gathered • Call path depth • Bursts Mode + Software Counters Automatic reduction • Spectral analysis • Computation structure detection JLPC Summer School, Sophia Antipolis, June 2014 26
Emitting “relevant” data (i. e. Burst Mode) Important information Details Not that important Software counters What is important? • First order approach: Computation !!! • MPI: a gas. Fills whatever space you give it. Very often not the major cause of problems Major computation bursts (i. e. > X ms) • Entry and exit timestamps and hardware counters Communication phases. • Software counters: • # MPI calls, aggregated bytes, %time in MPI, … J. Labarta et. al. , Scalability of tracing and visualization tools, PARCO 2005 JLPC Summer School, Sophia Antipolis, June 2014 27
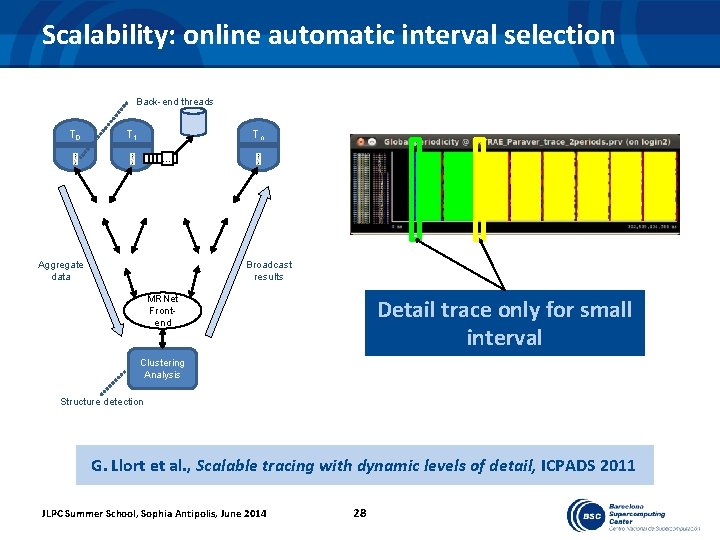
Scalability: online automatic interval selection Back-end threads T 0 Tn T 1 … Aggregate data Broadcast results MRNet Frontend Detail trace only for small interval Clustering Analysis Structure detection G. Llort et al. , Scalable tracing with dynamic levels of detail, ICPADS 2011 JLPC Summer School, Sophia Antipolis, June 2014 28
PARAVER
What is Paraver A browser … …to manipulate (visualize, filter, cut, combine, …) … … sequences of time-stamped events … … with a multispectral philosophy … … and a mathematical foundation … … that happens to be mainly used for performance analysis JLPC Summer School, Sophia Antipolis, June 2014 30
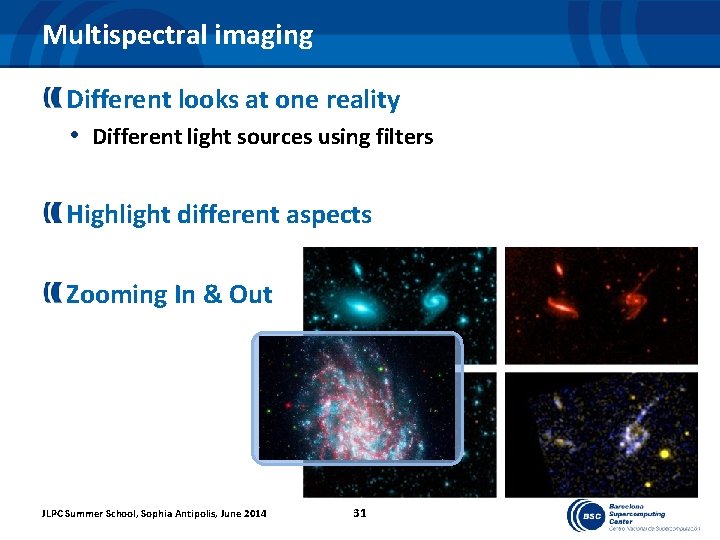
Multispectral imaging Different looks at one reality • Different light sources using filters Highlight different aspects Zooming In & Out JLPC Summer School, Sophia Antipolis, June 2014 31
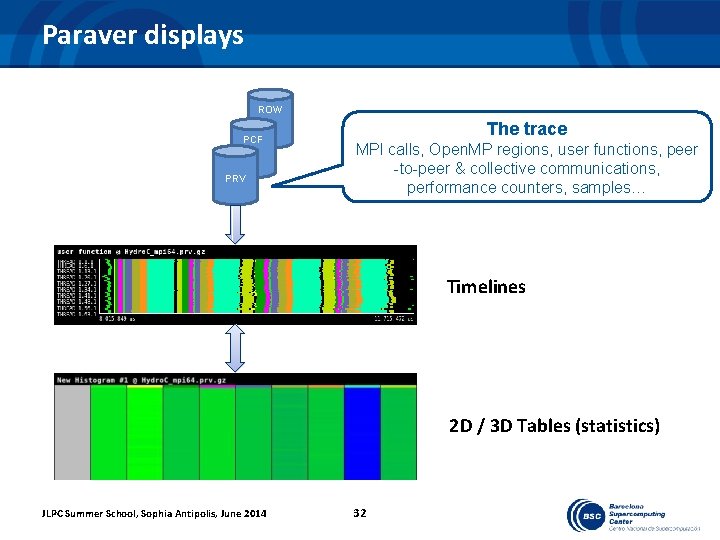
Paraver displays ROW PCF PRV The trace MPI calls, Open. MP regions, user functions, peer -to-peer & collective communications, performance counters, samples… Timelines 2 D / 3 D Tables (statistics) JLPC Summer School, Sophia Antipolis, June 2014 32
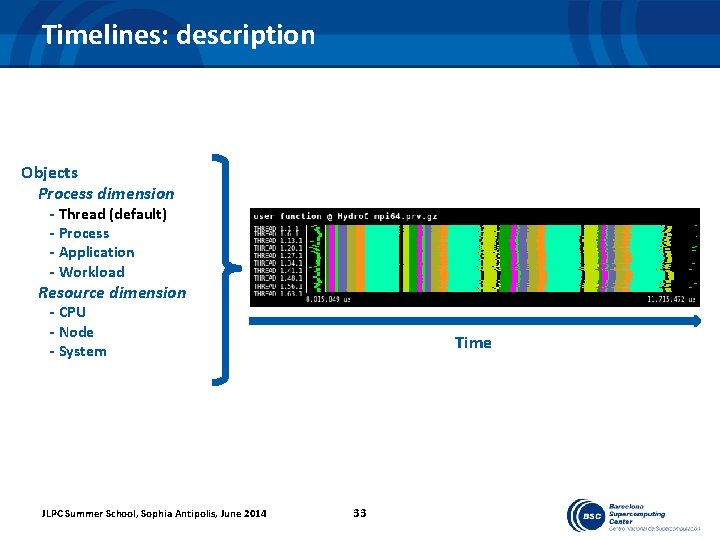
Timelines: description Objects Process dimension - Thread (default) - Process - Application - Workload Resource dimension - CPU - Node - System JLPC Summer School, Sophia Antipolis, June 2014 Time 33
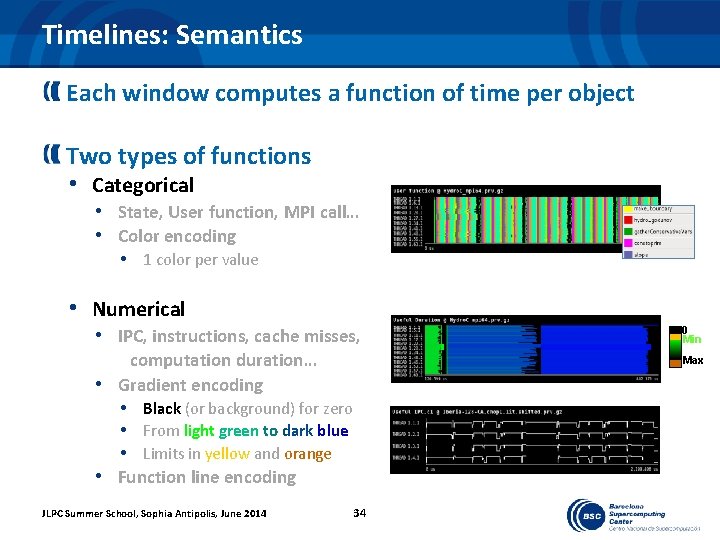
Timelines: Semantics Each window computes a function of time per object Two types of functions • Categorical • State, User function, MPI call… • Color encoding • 1 color per value • Numerical • IPC, instructions, cache misses, computation duration… • Gradient encoding • Black (or background) for zero • From light green to dark blue • Limits in yellow and orange • Function line encoding JLPC Summer School, Sophia Antipolis, June 2014 0 Min Max 34
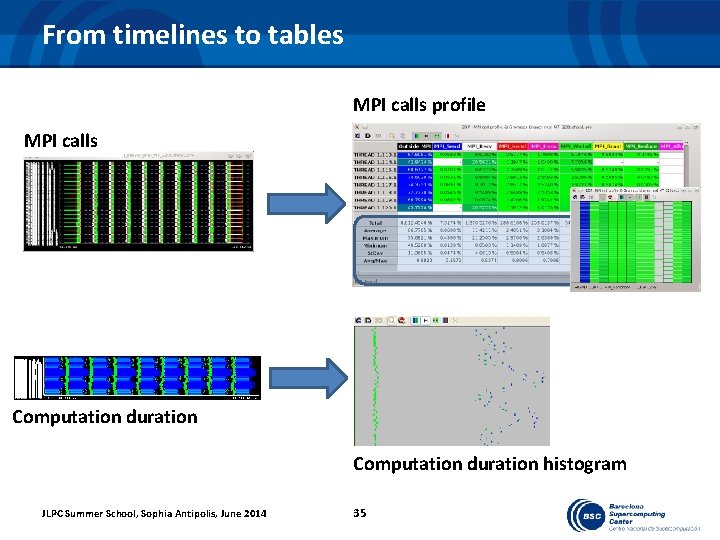
From timelines to tables MPI calls profile MPI calls Computation duration histogram JLPC Summer School, Sophia Antipolis, June 2014 35
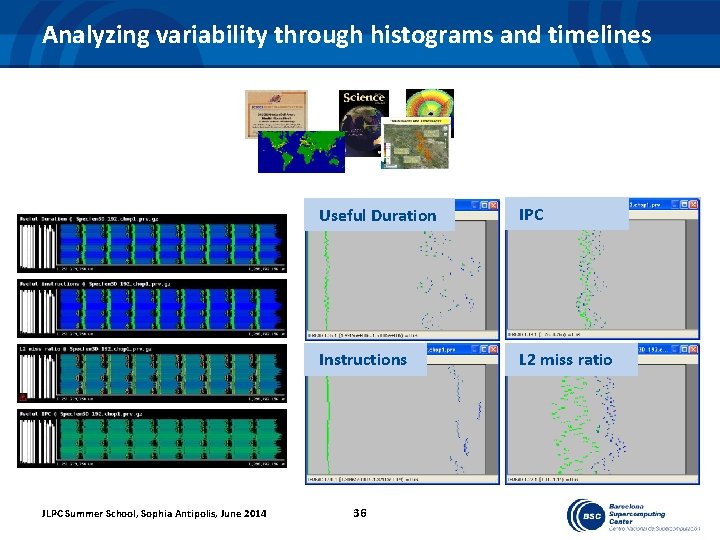
Analyzing variability through histograms and timelines JLPC Summer School, Sophia Antipolis, June 2014 Useful Duration IPC Instructions L 2 miss ratio 36
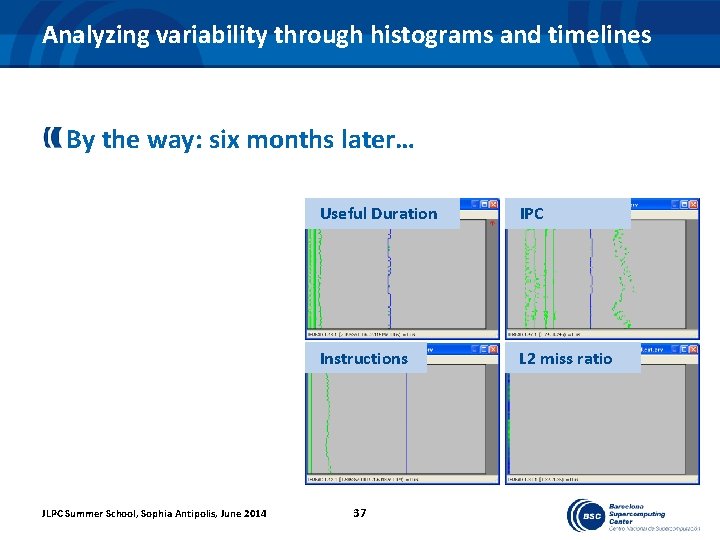
Analyzing variability through histograms and timelines By the way: six months later… JLPC Summer School, Sophia Antipolis, June 2014 Useful Duration IPC Instructions L 2 miss ratio 37
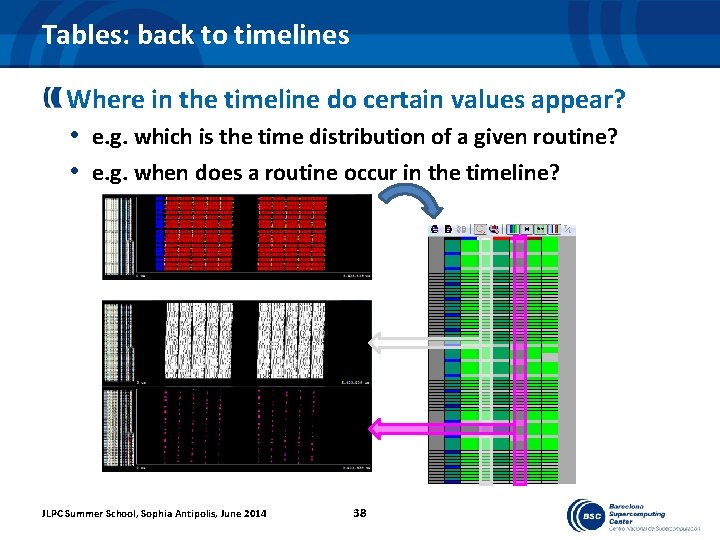
Tables: back to timelines Where in the timeline do certain values appear? • e. g. which is the time distribution of a given routine? • e. g. when does a routine occur in the timeline? JLPC Summer School, Sophia Antipolis, June 2014 38
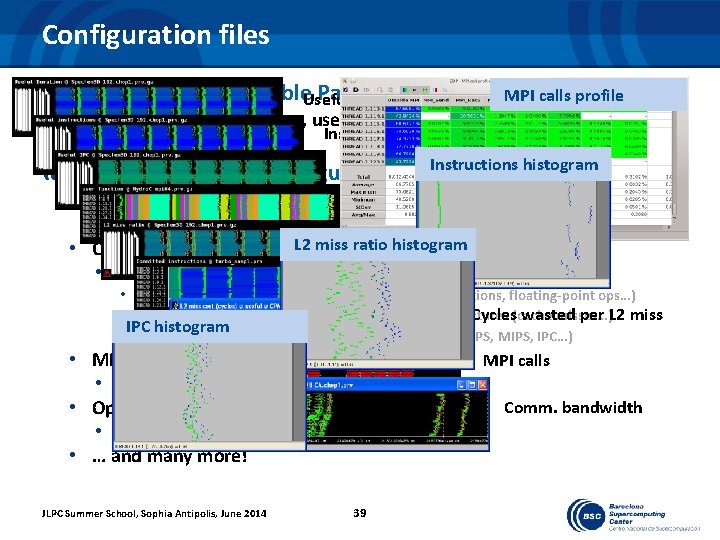
Configuration files CFG’s are programmable. Useful Paraver windows Duration MPI calls profile • Codify your formula once, use it forever! Instructions executed histogram IPC Find many pre-built configurations at. Instructions $PARAVER_HOME/cfgs • General User functions • Basic views (timelines), tables(2/3 D profiles), links to source code miss ratio L 2 histogram • Counters_PAPI • Hardware counter derived metrics. Instructions committed • Program: related to algorithmic/compilation (instructions, floating-point ops…) • Architecture: related to execution on specific architectures misses…) Cycles(cache wasted per L 2 miss IPC histogram • Performance: metrics reporting rates per time (MFLOPS, MIPS, IPC…) • MPI calls • Calls, peer-to-peer, collectives, bandwidth… • Open. MP • Parallel functions, outlined routines, locks… • … and many more! JLPC Summer School, Sophia Antipolis, June 2014 39 Comm. bandwidth
PERFORMANCE ANALYTICS
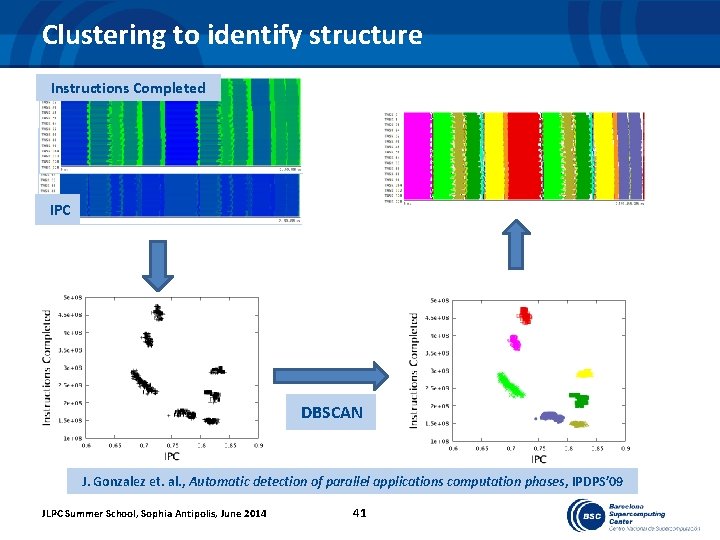
Clustering to identify structure Instructions Completed IPC DBSCAN J. Gonzalez et. al. , Automatic detection of parallel applications computation phases, IPDPS’ 09 JLPC Summer School, Sophia Antipolis, June 2014 41
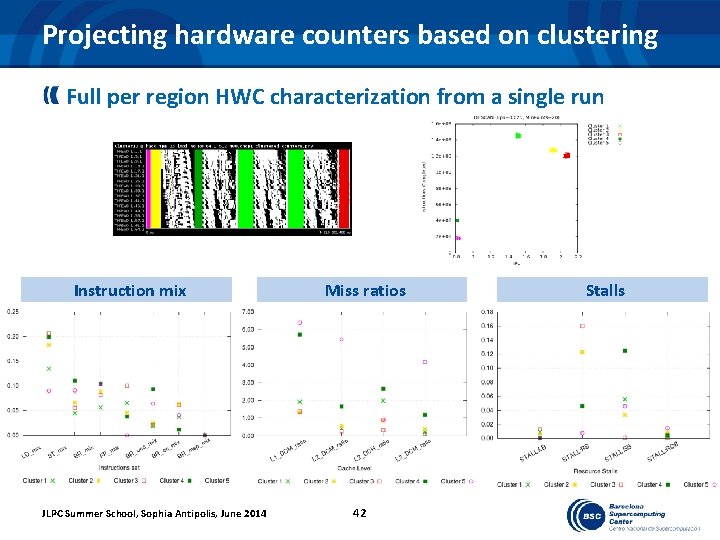
Projecting hardware counters based on clustering Full per region HWC characterization from a single run Instruction mix JLPC Summer School, Sophia Antipolis, June 2014 Miss ratios 42 Stalls
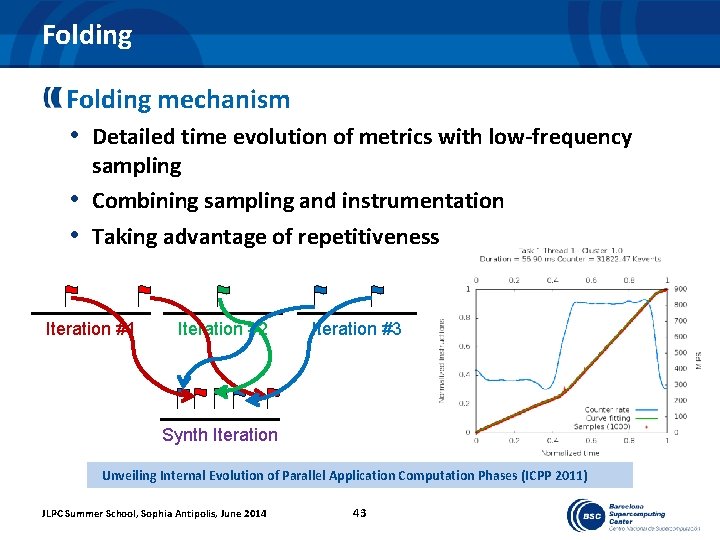
Folding mechanism • Detailed time evolution of metrics with low-frequency sampling • Combining sampling and instrumentation • Taking advantage of repetitiveness Iteration #1 Iteration #2 Iteration #3 Synth Iteration Unveiling Internal Evolution of Parallel Application Computation Phases (ICPP 2011) JLPC Summer School, Sophia Antipolis, June 2014 43
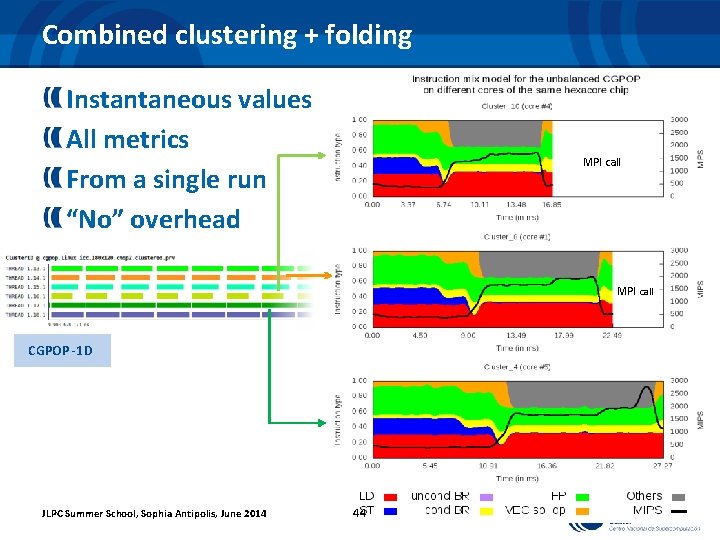
Combined clustering + folding Instantaneous values All metrics From a single run “No” overhead 17. 20 M instructions ~ 1000 MIPS 24. 92 M instructions ~ 1100 MIPS CGPOP -1 D 32. 53 M instructions ~ 1200 MIPS JLPC Summer School, Sophia Antipolis, June 2014 44 MPI call
CONCLUSIONS
Measure! Measuring your application performance is crucial Different acquisition and presentation techniques • Sampling / Instrumentation • Profiles / Time-lines • Provide different granularity Make the appropriate questions and select the appropriate tools JLPC Summer School, Sophia Antipolis, June 2014 46
BSC Tools Extrae: tracing mechanism • Supports the most commonly used parallel runtimes • Is able to capture multiple types of information Paraver: trace visualizer & analyser • Time-lines & Tables • Flexible & Highly configurable (CFGs!) Performance Analytics • Maximum insight from a single execution • Detailed and understendable JLPC Summer School, Sophia Antipolis, June 2014 47
TOOLS DEMO + HANDS-ON
EXTRA!
TUNING THE EXTRAE XML FILE JLPC Summer School, Sophia Antipolis, June 2014 50
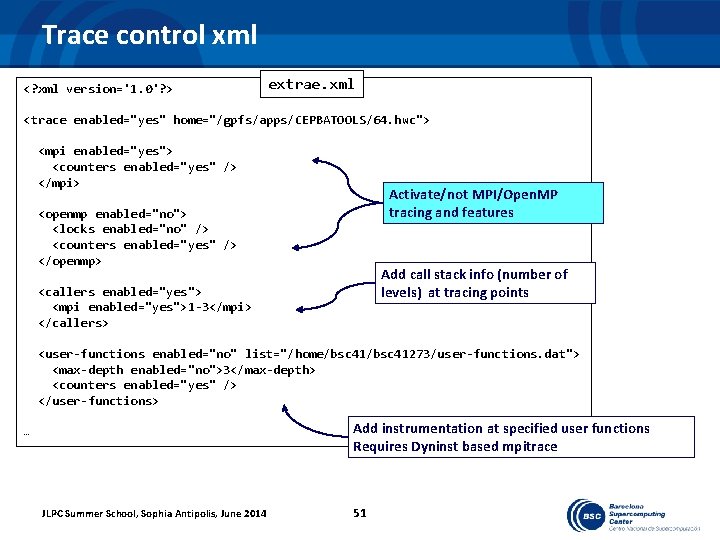
Trace control xml <? xml version='1. 0'? > extrae. xml <trace enabled="yes" home="/gpfs/apps/CEPBATOOLS/64. hwc"> <mpi enabled="yes"> <counters enabled="yes" /> </mpi> Activate/not MPI/Open. MP tracing and features <openmp enabled="no"> <locks enabled="no" /> <counters enabled="yes" /> </openmp> Add call stack info (number of levels) at tracing points <callers enabled="yes"> <mpi enabled="yes">1 -3</mpi> </callers> <user-functions enabled="no" list="/home/bsc 41273/user-functions. dat"> <max-depth enabled="no">3</max-depth> <counters enabled="yes" /> </user-functions> Add instrumentation at specified user functions Requires Dyninst based mpitrace … JLPC Summer School, Sophia Antipolis, June 2014 51
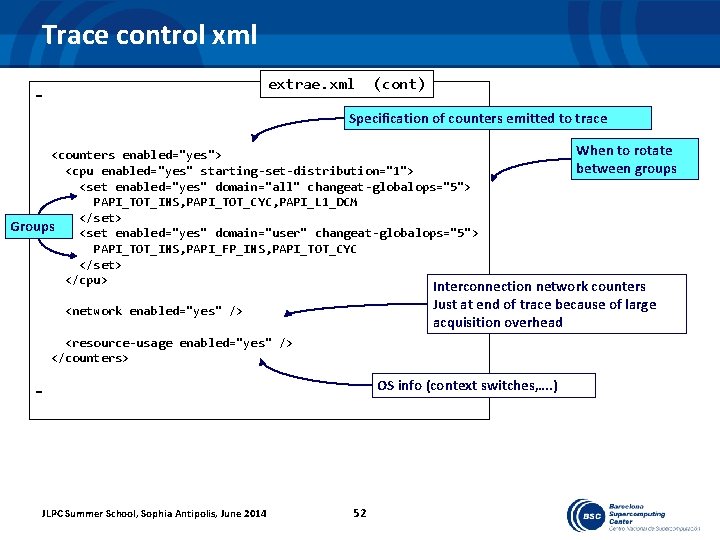
Trace control xml extrae. xml … (cont) Specification of counters emitted to trace When to rotate <counters enabled="yes"> between groups <cpu enabled="yes" starting-set-distribution="1"> <set enabled="yes" domain="all" changeat-globalops="5"> PAPI_TOT_INS, PAPI_TOT_CYC, PAPI_L 1_DCM </set> Groups <set enabled="yes" domain="user" changeat-globalops="5"> PAPI_TOT_INS, PAPI_FP_INS, PAPI_TOT_CYC </set> </cpu> Interconnection network counters Just at end of trace because of large acquisition overhead <network enabled="yes" /> <resource-usage enabled="yes" /> </counters> OS info (context switches, …. ) … JLPC Summer School, Sophia Antipolis, June 2014 52
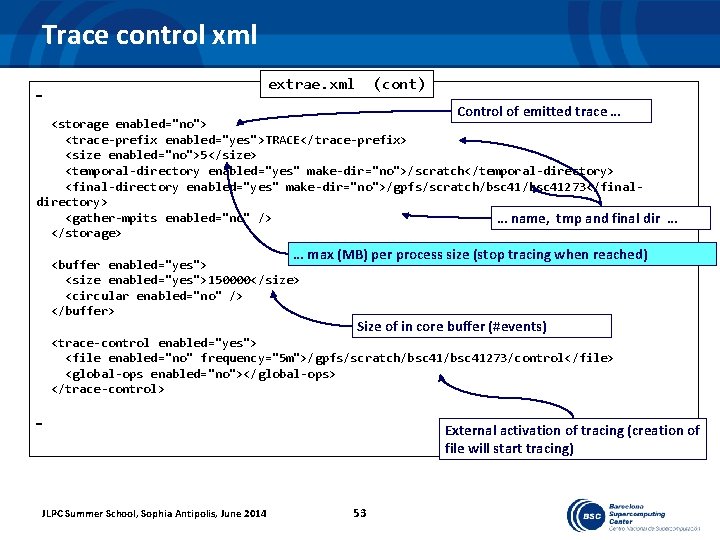
Trace control xml extrae. xml … (cont) Control of emitted trace … <storage enabled="no"> <trace-prefix enabled="yes">TRACE</trace-prefix> <size enabled="no">5</size> <temporal-directory enabled="yes" make-dir="no">/scratch</temporal-directory> <final-directory enabled="yes" make-dir="no">/gpfs/scratch/bsc 41273</finaldirectory> <gather-mpits enabled="no" /> … name, tmp and final dir … </storage> … max (MB) per process size (stop tracing when reached) <buffer enabled="yes"> <size enabled="yes">150000</size> <circular enabled="no" /> </buffer> Size of in core buffer (#events) <trace-control enabled="yes"> <file enabled="no" frequency="5 m">/gpfs/scratch/bsc 41273/control</file> <global-ops enabled="no"></global-ops> </trace-control> … JLPC Summer School, Sophia Antipolis, June 2014 External activation of tracing (creation of file will start tracing) 53
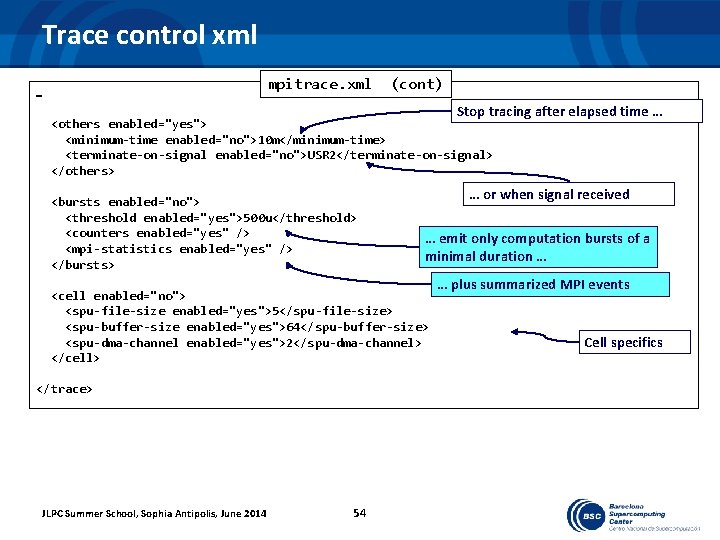
Trace control xml mpitrace. xml … (cont) Stop tracing after elapsed time … <others enabled="yes"> <minimum-time enabled="no">10 m</minimum-time> <terminate-on-signal enabled="no">USR 2</terminate-on-signal> </others> <bursts enabled="no"> <threshold enabled="yes">500 u</threshold> <counters enabled="yes" /> <mpi-statistics enabled="yes" /> </bursts> … or when signal received … emit only computation bursts of a minimal duration … <cell enabled="no"> <spu-file-size enabled="yes">5</spu-file-size> <spu-buffer-size enabled="yes">64</spu-buffer-size> <spu-dma-channel enabled="yes">2</spu-dma-channel> </cell> </trace> JLPC Summer School, Sophia Antipolis, June 2014 54 … plus summarized MPI events Cell specifics
MORE ON ANALYTICS JLPC Summer School, Sophia Antipolis, June 2014 55
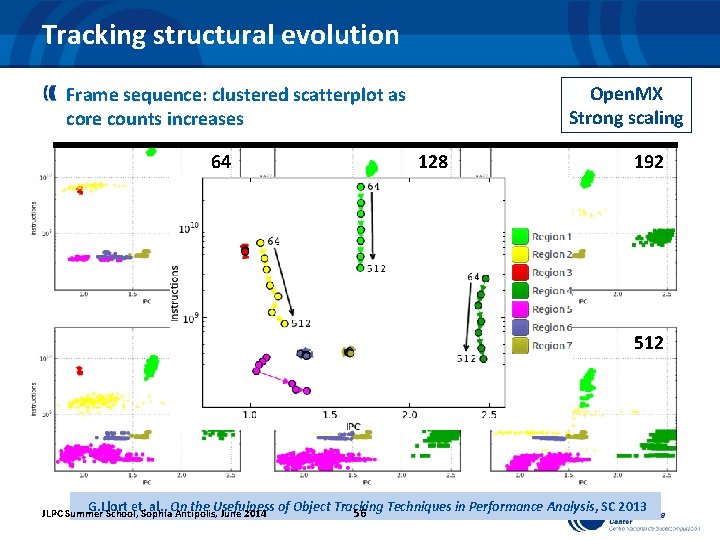
Tracking structural evolution Open. MX Strong scaling Frame sequence: clustered scatterplot as core counts increases 64 128 192 256 384 512 G. Llort et. al. , On the Usefulness of Object Tracking Techniques in Performance Analysis, SC 2013 56 JLPC Summer School, Sophia Antipolis, June 2014
Sampling frequency Trade-off: • Too low no detail • Too high too much overhead Challenge: Can we get • lot of detail, very fine grain information : • i. e. “instantaneous” performance metric rates • With very little overhead: • ie. sampling a few times per second JLPC Summer School, Sophia Antipolis, June 2014 57
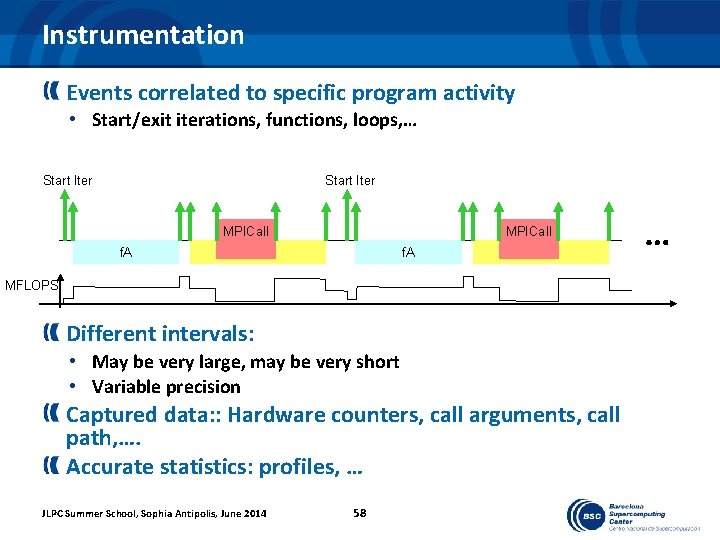
Instrumentation Events correlated to specific program activity • Start/exit iterations, functions, loops, … Start Iter MPICall f. A MPICall f. B f. A f. B MFLOPS Different intervals: • May be very large, may be very short • Variable precision Captured data: : Hardware counters, call arguments, call path, …. Accurate statistics: profiles, … JLPC Summer School, Sophia Antipolis, June 2014 58
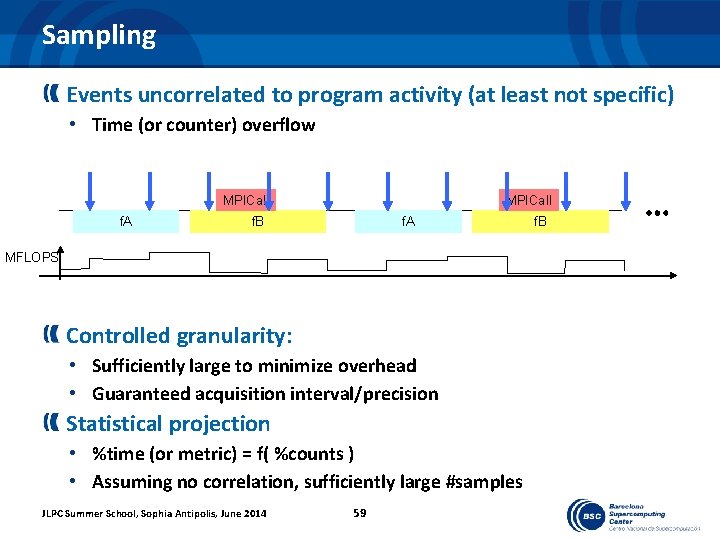
Sampling Events uncorrelated to program activity (at least not specific) • Time (or counter) overflow MPICall f. A MPICall f. B f. A MFLOPS Controlled granularity: • Sufficiently large to minimize overhead • Guaranteed acquisition interval/precision Statistical projection • %time (or metric) = f( %counts ) • Assuming no correlation, sufficiently large #samples JLPC Summer School, Sophia Antipolis, June 2014 59 f. B
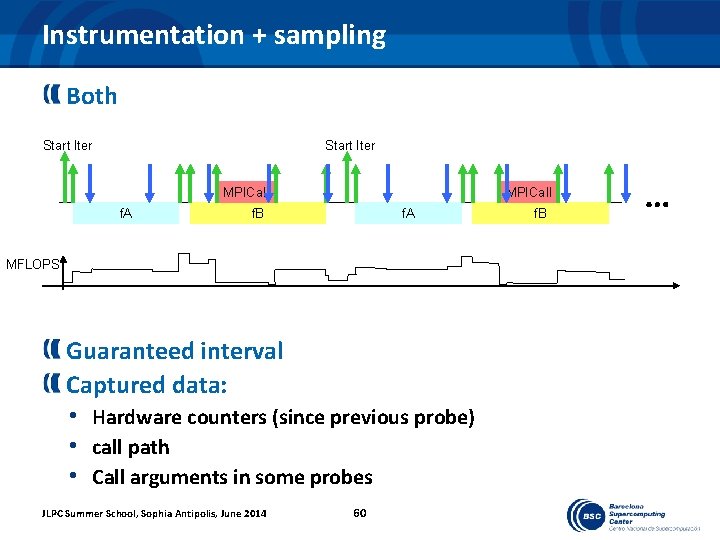
Instrumentation + sampling Both Start Iter MPICall f. A MPICall f. B f. A MFLOPS Guaranteed interval Captured data: • Hardware counters (since previous probe) • call path • Call arguments in some probes JLPC Summer School, Sophia Antipolis, June 2014 60 f. B
- Slides: 60