WRTSIL ENERGY SOLUTIONS Optimization of the power systems


 balances fluctuations in wind")
 costs are hidden")


- Slides: 24
WÄRTSILÄ ENERGY SOLUTIONS Optimization of the power systems with a large renewables share Kiev 14 -09. 2016 1 / 24 © Wärtsilä 03/2015 Wärtsilä in Finland Doc. ID: Revision: Status:
Wärtsilä Corporation 17 700 professionals 200 locations 70 countries Solutions for Marine/ offshore Energy Net sales by business 2015 Marine Solutions 34% Services 43% 5. 0 billion € turnover / 24 © Wärtsilä February 2021 - Established in 1834 - Listed at NASDAQ OMX Helsinki - 182 000 MW installed base Energy Solutions 22% Doc. ID: Revision: Status:
Wärtsilä market position, <500 MW power plants 1 -9/2015 Ansaldo 5. 5% Wärtsilä 9. 9% Other GT’s 0. 8% GE 38. 8% MHI 19. 8% Siemens 25. 2% Market data includes all Wärtsilä power plants and other manufacturers’ gas and liquid fueled gas turbine based power plants with prime movers above 5 MW, as well as estimated output of steam turbines for combined cycles. The data is gathered from the Mc. Coy Power Report. Other combustion engines not included. In engine technology Wärtsilä has a leading position. 3 / 24 © Wärtsilä Doc. ID: Revision: Status:
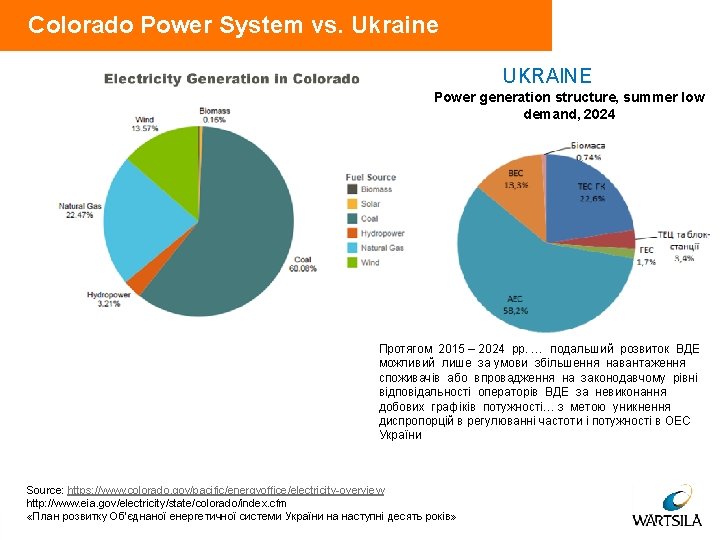
Colorado Power System, 2015 The challenges of accommodating significant shares of variable renewables remain as large as ever. Prof Jan Horst Keppler Director, Chaire European Electricity Markets (CEEM) Financial Times, 19 April 2016 Electric Power Industry Net Summer Capacity 15, 764 MW Total Net Electricity Generation 53 bn k. Wh Source: https: //www. colorado. gov/pacific/energyoffice/electricity-overview http: //www. eia. gov/electricity/state/colorado/index. cfm / 24 © Wärtsilä Doc. ID: Revision: Status:
Wind chasing in Colorado, USA, 3. 05. 2008 Grid operator data from: Load Coal power plants Wind generation Gas generation Plains End 1 & 2 power plants Flexible generation In systems with high wind penetration, thermal power plants face • Lower average load & more part load operation • Faster ramp up’s and down’s • More starts and stops / 24 © Wärtsilä Doc. ID: Revision: Colorado Dispatch Center, Xcel Energy, USA Status:
Plains End 1&2, Colorado – 231 MW • • 118+113 МW Natural gas Prime movers: 20 x Wärtsilä 18 V 34 SG and 14 x Wärtsilä 20 V 34 SG Delivery: 2001 та 2006 § § In average 250 starts per genset p. a. Start reliability 99. 9% (as per operator report)
Cost of balancing – technology specific cost To provide reserves several power plants must run at part load, which reduces their electrical efficiency. This leads to additional costs, often “hidden” and not monetized.
Smart Power Generation Efficiency Smart Power Generation Fuel Flexibility • Operational Flexibility • High electric efficiency on various loads • • - up to 50 % station net - Load range ~ 3 … 100 % Flexibility while same efficiency Fast start and ramp up • -1 min to full stop - 30 с from start command to synchronization - 2 min до 100 % plant load • 8 © Wärtsilä Fast stop Unlimited starts and stops without impact on maintenance intervals and cost
Smart Power Generation balances demand fluctuations • SPG handles sudden starts and stops as well as varying loads • SPG allows baseload plants that are not designed for such cyclic operation to be relieved of this duty • SPG contributes to grid frequency regulation and system stability Demand % 100 • SPG improves total system efficiency Regulation Peak load 80 Intermediate load 60 Daily load curve 40 20 Base load 0 0 6 12 18 24 Hour
Smart Power Generation integrates renewables • Smart Power Generation (SPG) balances fluctuations in wind and solar power • SPG ensures system stability in contingency situations • SPG maximizes the use of renewable capacity by minimizing losses of excess wind and solar power. • SPG improves total system efficiency
Outcome of 2 system level analysis • Typically balancing (ancillary services) costs are hidden in the transmission fees / network tariffs, and their costs are not considered in power system modelling • All system operating costs should be taken into account when optimizing the capacity mix CALIFORNIA – BALANCING COSTS 2020 $ Million UK – BALANCING COSTS 2020 $ Million Annual balancing savings (- 50 %) 1500 750 Annual balancing savings (- 54 %) 1, 500 750 1, 200 $ Million 1, 600 $ Million 740 $ Million 600 $ Million 0 0 Base Case 11 Flexible Case © Wärtsilä February 2021 Presentation name / Author Base Case Flexible Case
Kiisa 250 MW, Estonia / 24 © Wärtsilä Emergency Reserve Plant § Commissioned 2014 § Dual fuel capability (gas and LFO) § 200 starts/year § Remote operation Doc. ID: Revision: Status:
Thank you! wärtsilä Finland oy igor. petryk@wartsila. com 15 © Wärtsilä
Back-Up Providing reserves 16 © Wärtsilä
Meet demand for Energy 100% Load El. eff 50% Load 100% 34% Load El. eff 40% Load 50% 35% El. eff 100% 40% 50% 35% El. eff 100% 34% 50% 30% 1000 MW 500 MW Demand 4500 MW 1000 MW Load 40% 50% 35% El. eff 100% 34% 50% 30% 1000 MW 500 MW Price Demand Supply 4500 MW PEnergy Load El. eff Load Penergy= Price to meet supply 500 MW © Wärtsilä February 2021 Presentation name / Author El. eff 100% 55% 50% 48% Capacity 17 El. eff 100% 500 MW
Meet demand for Energy + Reserves 100% Load El. eff 50% Load 100% 34% Load El. eff 40% Load 50% 35% El. eff 100% 40% 50% 35% El. eff 100% 34% 50% 30% 1000 MW 500 MW Demand 4500 MW + Reserves 500 MW 1000 MW Load 500 MW Load 40% 50% 35% El. eff 100% 34% 50% 30% 1000 MW 500 MW Price Demand PReserve Supply 4500 MW MW+ 500 MW Reserves PReserve > PEnergy Load Capacity Penergy= Price to meet supply PReserve= Price to meet supply + reserve requirement 18 El. eff 100% © Wärtsilä February 2021 500 MW El. eff Load El. eff 100% 55% 50% 48% 500 MW
Meet demand for Energy + Reserves with SPG 100% Load El. eff 50% Load 100% 34% Load El. eff 40% Load 50% 35% El. eff 100% 40% 50% 35% El. eff 100% 34% 50% 30% 1000 MW 500 MW Demand 4500 MW + Reserves 500 MW 1000 MW Load 500 MW Load 40% 50% 35% El. eff 100% 34% 50% 30% 1000 MW 500 MW Price Demand Supply 4500 MW MW+ 500 MW Reserves PReserve = PEnergy Load Capacity Penergy= Price to meet supply PReserve= Price to meet supply + reserve requirement 19 El. eff 100% © Wärtsilä February 2021 500 MW El. eff Load El. eff 100% 55% 50% 48% 500 MW
There is a new way to provide reserves… • Utilize flexible, fast starting generation units • Benefit 1 = Optimize the operations of total fleet (no need to run plants at part load) • Benefit 2 = No need to start costlier generation to provide energy Traditional way to procure reserves New way 400 MW 200 MW of reserve capacity Electrical efficiency 50 % 200 MW el. eff 55 % 400 MW CCGT running at full load Electrical efficiency 55 % el. eff 48 % el. eff 51% 400 MW CCGT running at part load 200 MW CCGT started to supply energy 200 MW of reserve capacity 400 MW CCGT running at full load 200 MW SPG stand-by
UK - 2020 California - 2020 “A billion dollar story”… 21 Initial situation in 2012 “Challenge the existing way of working” The Californian system operator announced: KEMA DNV report from 2012 states: “To minimize the system operating costs to consumers Californian power system needs 5. 5 GW of new CCGT & OCGT capacity” “By modelling the whole Californian system we can make the overall system cost visible” The Department of Energy and Climate Change said: Redpoint report from 2012 states: “The UK market should deliver 4. 8 GW of new CCGT capacity to minimize the costs to consumers” © Wärtsilä February 2021 “There is an alternative technology available” “To make better decisions, the total system cost of future capacity mixes should be modeled” “Flexible capacity provides dramatic savings” Outcome • $890 million annual savings without any additional investment cost • 50 % lower system balancing costs • All costs visible • $870 million annual savings without any additional investment cost • 50% lower system balancing costs • All costs visible
There is a BIG potential for savings! The Redpoint Study showed • More accurate information for market mechanism development • Technology specific savings • $870 million annual savings (5% of annual system operating cost) without any additional investment cost • 54% lower system balancing costs The KEMA DNV Study showed • Better information for future capacity mix planning • Technology specific savings • $890 million annual savings (11% of annual system operating cost) without any additional investment cost • 50% lower system balancing costs 22 © Wärtsilä February 2021 Links to the studies: www. smartpowergeneration. com/downloads
202 MW, Pearsall, Texas / 24 © Wärtsilä WÄRTSILÄ POWER PLANTS Peaking Plant § 24 x Wärtsilä 20 V 34 SG § Delivered 2008 § Fuel: Natural Gas § Operating mode: Wind following Doc. ID: Revision: Status:
225 MW, Red Gate, Texas Flexible Base Load Plant § 12 x Wärtsilä 18 V 50 SG § Delivered 2014 § Fuel: Natural Gas § Operating mode: Real time market player