
Writing with Quantitative Data Elisabeth van Stam Writing

Writing with Quantitative Data Elisabeth van Stam Writing & Multimodal Communication Specialist, STEM Resource
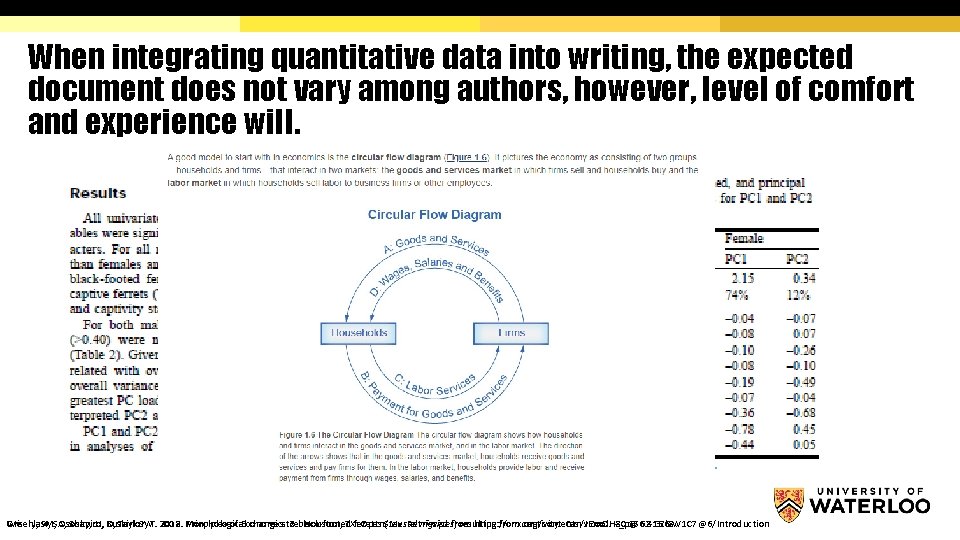
When integrating quantitative data into writing, the expected document does not vary among authors, however, level of comfort and experience will. Wisely, SM, SA, Ososky, JJ, Buskirk SW. changes to (Mustel nigripes) resulting from captivity. Can J Zool. 80: 1562 -1568. Greenlaw, Shapiro, D, Taylor, T. 2002. 2018. Morphological Principles of Economics 2 e. black-footed Houston, TX: feretts Open. Stax. Retrieved from https: //cnx. org/contents/v. Em. OH-_p@6. 8: 3 Zl. SW 1 C 7@6/Introduction
USING QUANTITATIVE DATA TO TELL YOUR STORY
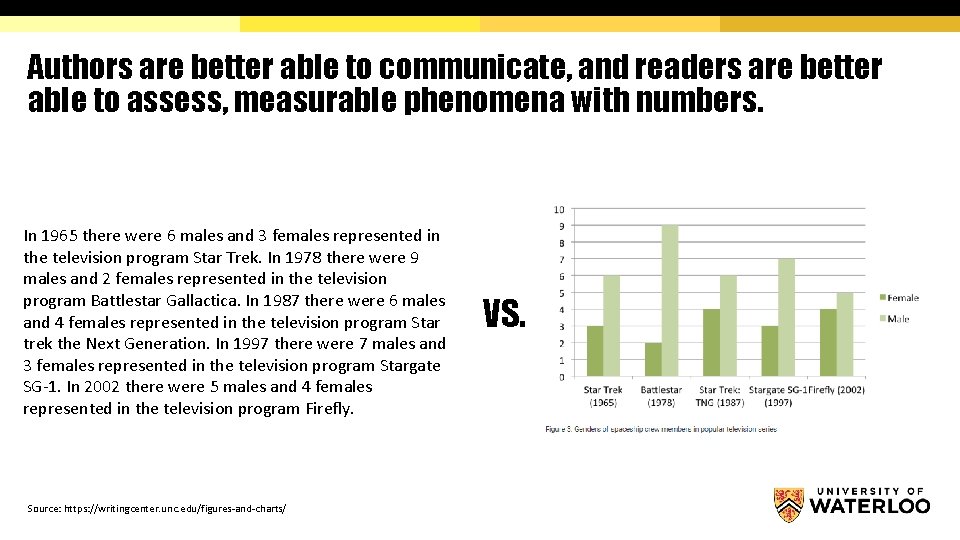
Authors are better able to communicate, and readers are better able to assess, measurable phenomena with numbers. In 1965 there were 6 males and 3 females represented in the television program Star Trek. In 1978 there were 9 males and 2 females represented in the television program Battlestar Gallactica. In 1987 there were 6 males and 4 females represented in the television program Star trek the Next Generation. In 1997 there were 7 males and 3 females represented in the television program Stargate SG-1. In 2002 there were 5 males and 4 females represented in the television program Firefly. Source: https: //writingcenter. unc. edu/figures-and-charts/ VS.
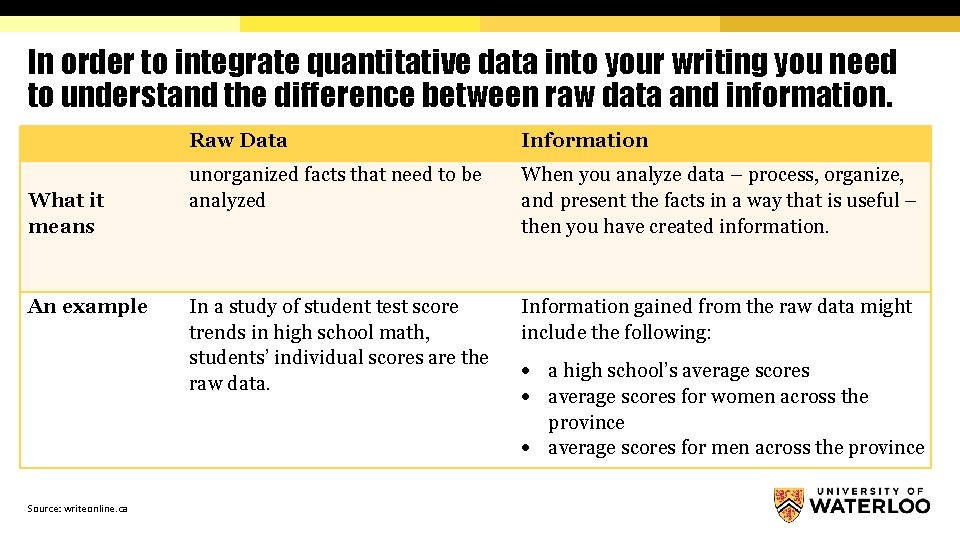
In order to integrate quantitative data into your writing you need to understand the difference between raw data and information. What it means An example Source: writeonline. ca Raw Data Information unorganized facts that need to be analyzed When you analyze data – process, organize, and present the facts in a way that is useful – then you have created information. In a study of student test score trends in high school math, students’ individual scores are the raw data. Information gained from the raw data might include the following: a high school’s average scores for women across the province average scores for men across the province
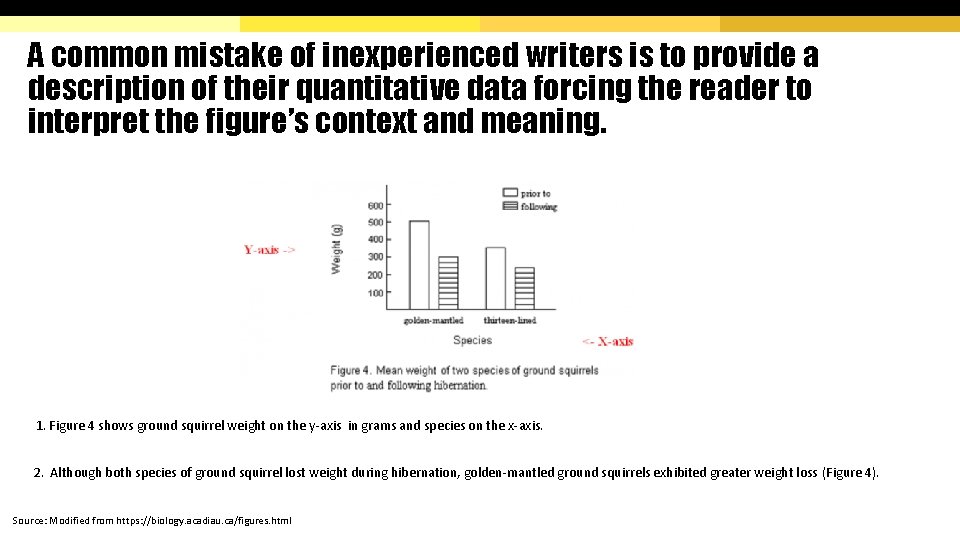
A common mistake of inexperienced writers is to provide a description of their quantitative data forcing the reader to interpret the figure’s context and meaning. 1. Figure 4 shows ground squirrel weight on the y-axis in grams and species on the x-axis. 2. Although both species of ground squirrel lost weight during hibernation, golden-mantled ground squirrels exhibited greater weight loss (Figure 4). Source: Modified from https: //biology. acadiau. ca/figures. html
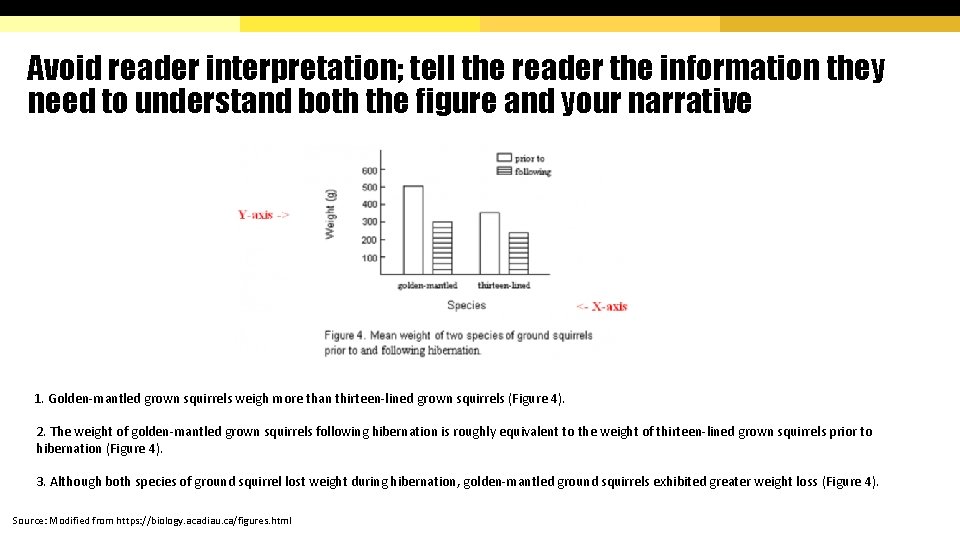
Avoid reader interpretation; tell the reader the information they need to understand both the figure and your narrative 1. Golden-mantled grown squirrels weigh more than thirteen-lined grown squirrels (Figure 4). 2. The weight of golden-mantled grown squirrels following hibernation is roughly equivalent to the weight of thirteen-lined grown squirrels prior to hibernation (Figure 4). 3. Although both species of ground squirrel lost weight during hibernation, golden-mantled ground squirrels exhibited greater weight loss (Figure 4). Source: Modified from https: //biology. acadiau. ca/figures. html

Discussion and Reflection Source: http: //edaozyp. pbworks. com/f/1441976831/discussion. jpg

FORMATTING TABLES AND FIGURES
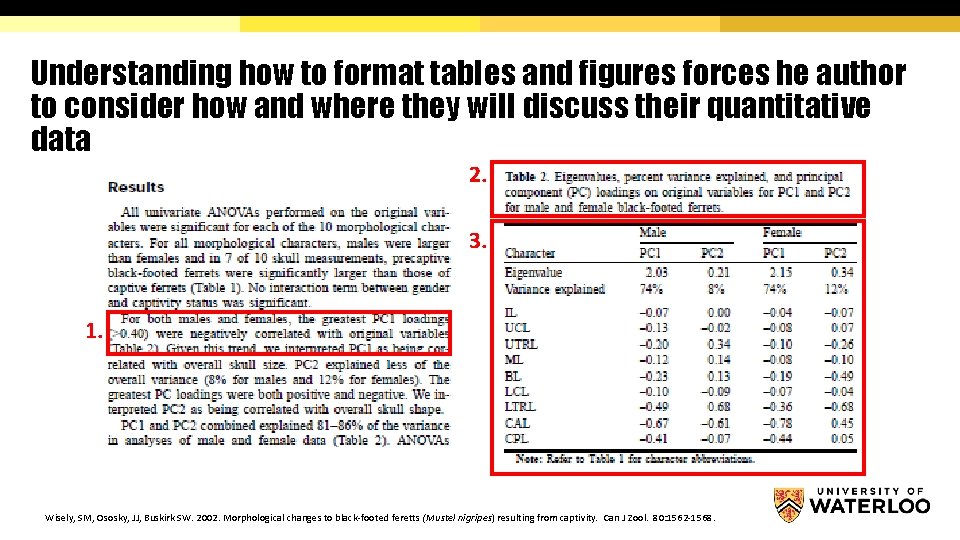
Understanding how to format tables and figures forces he author to consider how and where they will discuss their quantitative data 2. 3. 1. Wisely, SM, Ososky, JJ, Buskirk SW. 2002. Morphological changes to black-footed feretts (Mustel nigripes) resulting from captivity. Can J Zool. 80: 1562 -1568.
There are three different ways to incorporate quantitative data into writing. § Text § Seed production was higher for plants in the full-sun treatment (52. 3 +/-6. 8 seeds) than for those receiving filtered light (14. 7+/- 3. 2 seeds, t=11. 8, df=55, p<0. 001. ) Source: http: //abacus. bates. edu/~ganderso/biology/resources/writing/HTWtablefigs. html
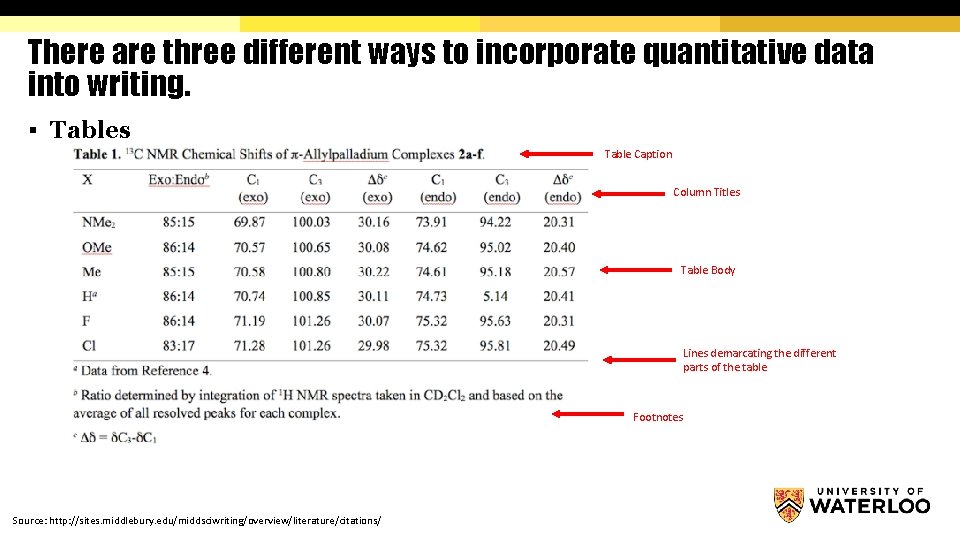
There are three different ways to incorporate quantitative data into writing. § Tables Table Caption Column Titles Table Body Lines demarcating the different parts of the table Footnotes Source: http: //sites. middlebury. edu/middsciwriting/overview/literature/citations/
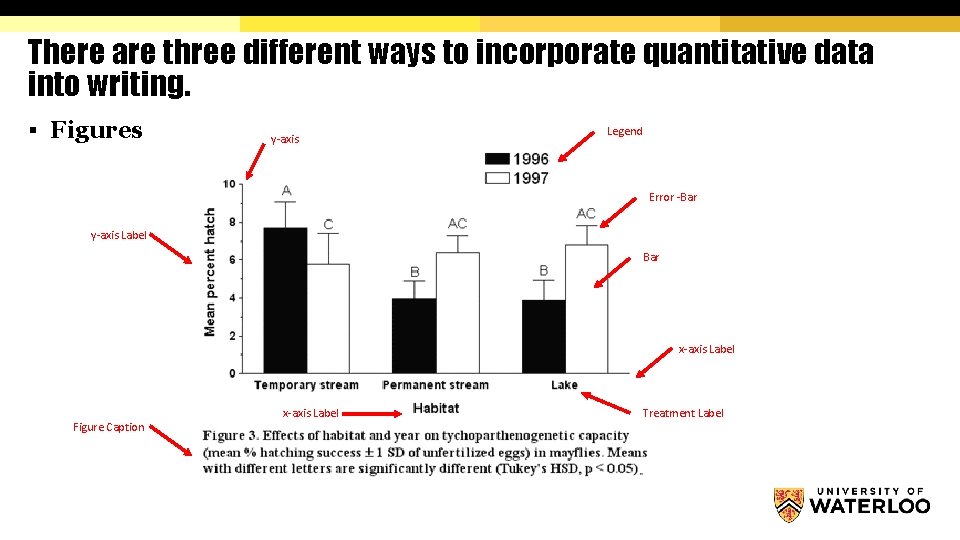
There are three different ways to incorporate quantitative data into writing. § Figures y-axis Legend Error -Bar y-axis Label Bar x-axis Label Figure Caption x-axis Label Treatment Label
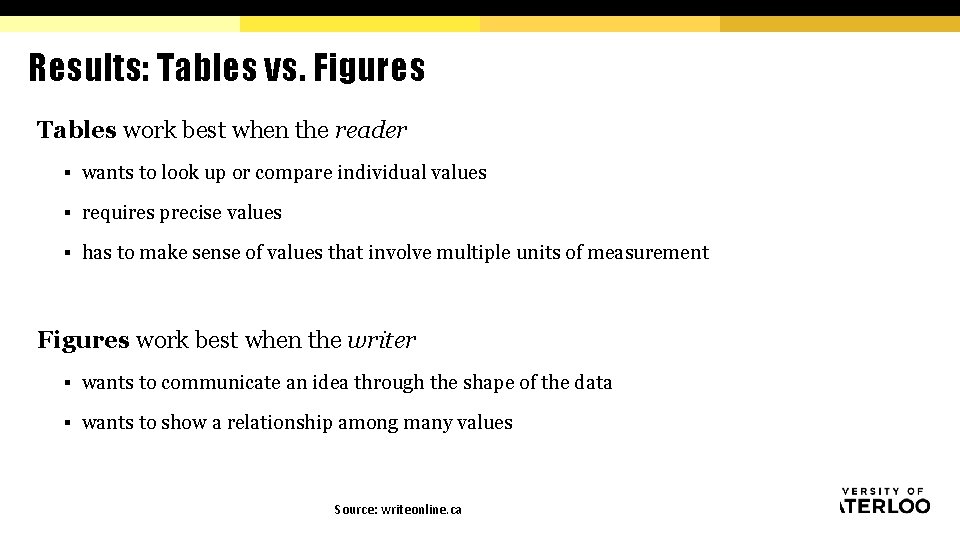
Results: Tables vs. Figures Tables work best when the reader § wants to look up or compare individual values § requires precise values § has to make sense of values that involve multiple units of measurement Figures work best when the writer § wants to communicate an idea through the shape of the data § wants to show a relationship among many values Source: writeonline. ca
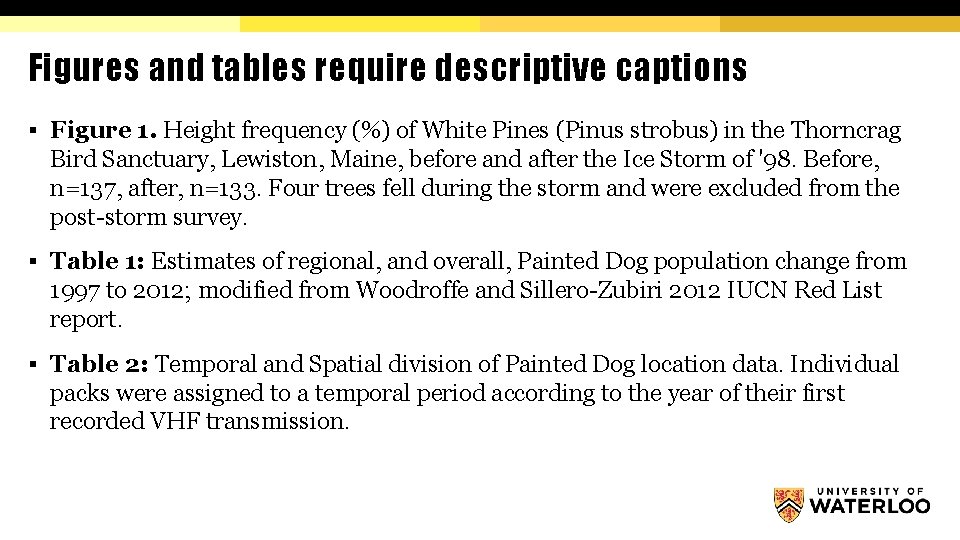
Figures and tables require descriptive captions § Figure 1. Height frequency (%) of White Pines (Pinus strobus) in the Thorncrag Bird Sanctuary, Lewiston, Maine, before and after the Ice Storm of '98. Before, n=137, after, n=133. Four trees fell during the storm and were excluded from the post-storm survey. § Table 1: Estimates of regional, and overall, Painted Dog population change from 1997 to 2012; modified from Woodroffe and Sillero-Zubiri 2012 IUCN Red List report. § Table 2: Temporal and Spatial division of Painted Dog location data. Individual packs were assigned to a temporal period according to the year of their first recorded VHF transmission.
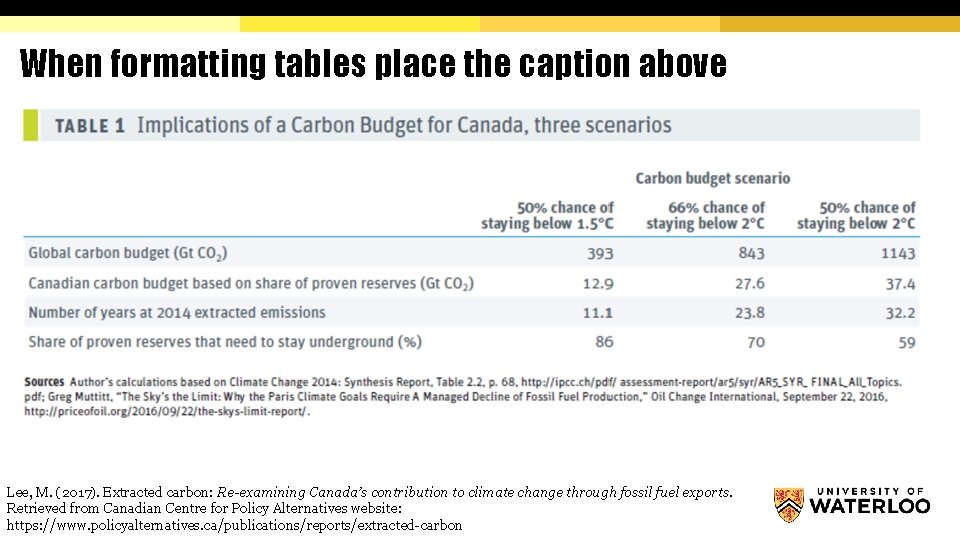
When formatting tables place the caption above Lee, M. (2017). Extracted carbon: Re-examining Canada’s contribution to climate change through fossil fuel exports. Retrieved from Canadian Centre for Policy Alternatives website: https: //www. policyalternatives. ca/publications/reports/extracted-carbon
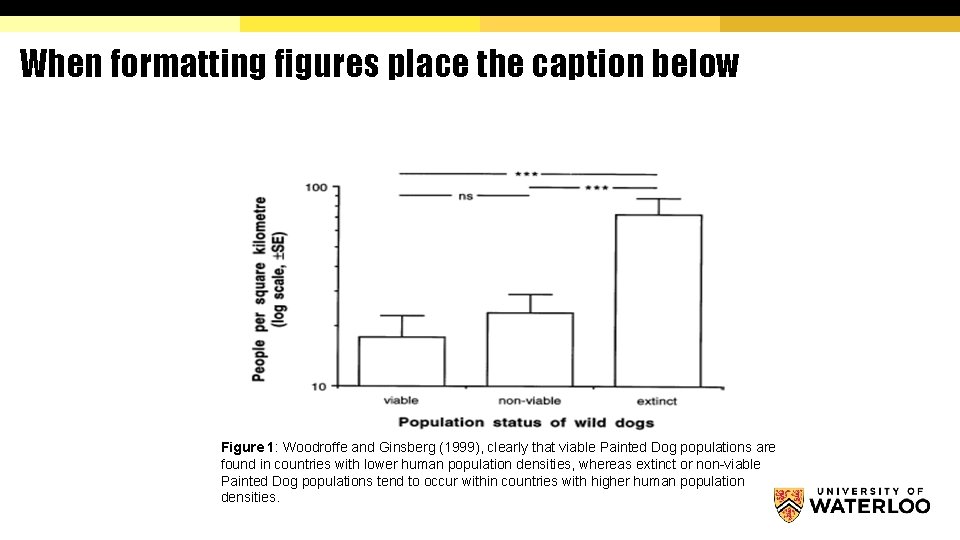
When formatting figures place the caption below Figure 1: Woodroffe and Ginsberg (1999), clearly that viable Painted Dog populations are found in countries with lower human population densities, whereas extinct or non-viable Painted Dog populations tend to occur within countries with higher human population densities.

Discussion and Reflection Source: http: //edaozyp. pbworks. com/f/1441976831/discussion. jpg

RESOURCES FOR STUDENTS AND INSTRUCTORS

University of Manchester Academic Phrasebank

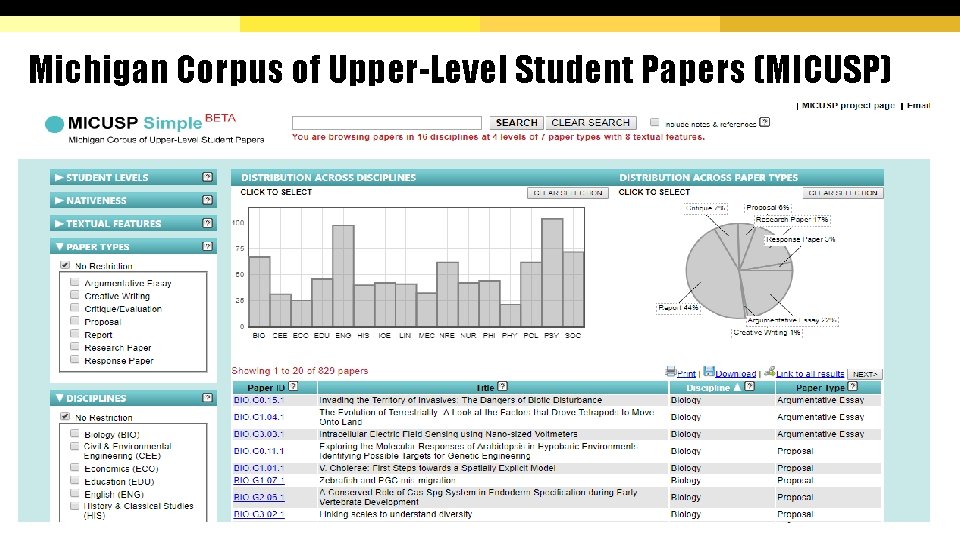
Michigan Corpus of Upper-Level Student Papers (MICUSP)
- Slides: 22