Writing a storyboard 1 Organize data locate trends

Writing a storyboard: 1. Organize data & locate trends. 2. Select figures that best represent trends. 3. Write bullet points for each figure. 4. Integrate figures into “storyboard: ” – Assess how each figure contributes to the major theme – REVISE figures to focus on the major theme. – REVISE bullet points to focus on the major theme. – Add/remove figures. 5. Write supporting text. Reading a storyboard: 1. Read a single figure to assess accuracy and completeness of the data description. 2. Read a series of figures to assess the main theme or “story” of the research article. Assess the logical sequencing of the images.

Challenge 1: Reading a single figure. 1. 2. 3. 4. 5. What does this visual show? (results) What conclusions can be drawn from this visual? (discussion) What does each bar show? (caption) How might these data have been obtained? (methods) What questions do you still have about this visual? Note: CE, CCC, and RTE are the journals with the highest impact factor in the field of Writing Studies. NCTE/CCCC’s Recent War on Scholarship 2005; 22; 198 Written Communication Richard H. Haswell

Challenge 2: Reading a series of figures. 1. What do these visuals show? 2. What conclusions/trends can be drawn from these visuals? 3. How do these visuals relate to each other? Do they support each other, contradict each other, or …. ? 4. What other data might you want to see in addition to these? Kentucky Department of Education. (2003). Kentucky Performance Report. [WWW Document] URL http: //app 1. kde. state. ky. us/secure_cats_reports_03/index. cfm? action=display_regionstate (visited 2004, Jan 4).

Proficient White Male Female Total Gifted/Talented ESS Limited English Migrant Title 3 Other Asian Hispanic Disability (No acc) Disability (acc) Disability No Disability Vocational/ Enrolled Vocational/3 Credits Reduced/Free Lunch Not Approved Novice Reduced/Free Lunch Approved Apprentice African American Distinguished


Challenge 3: Write 2 -3 bullet points for each figure.

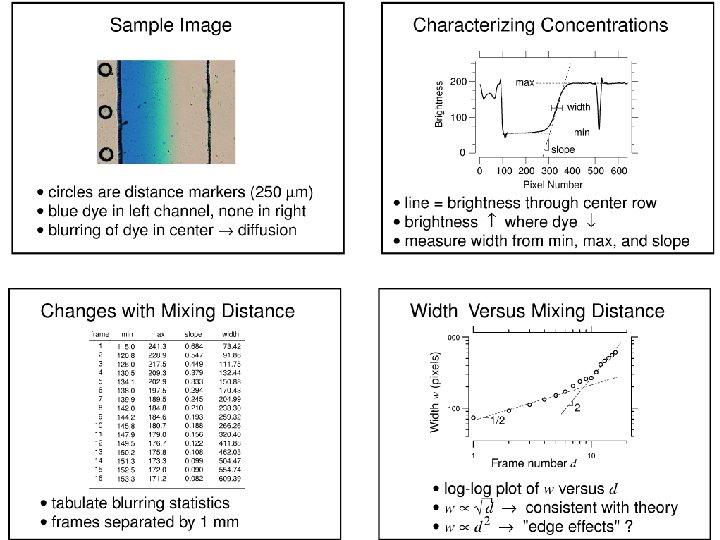
Challenge 4: Integrate figures into a storyboard. • • • Assemble figures into a “storyboard” Assess how each figure contributes to the major theme REVISE figures to focus on the major theme REVISE bullet points to focus on the major theme Add figures to fill in gaps Remove figures to eliminate redundancy Sample Draft Storyboard

Challenge 5: Translate bullet points into report text. a. b. c. d. Use “storyboard” as an “outline” of your report. Develop bullets into well-supported arguments. Integrate figures with text. Read and revise to fill in gaps. Add abstract, references, and other supporting material. Images Introduction Methods Images Results Images Discussion Conclusion
- Slides: 9