Write on Front Cover Page Definition of Climate


- Slides: 50
Write on Front Cover Page Definition of Climate - q The weather for a particular area over a long period of time Consists of: q Average yearly temperature q Annual temperature range q Average moisture conditions or precipitation vs. evapotranspiration
Page 1 Identify five factors that affect climate and explain how each affects climate.
Page 1
Page 1 As Latitude increases average DECREASES yearly temperature _______. Because temperature varies due to the angle, intensity, and duration of insolation
How does latitude affect climate? Temperature As latitude ____, increases the average decreases annual temperature _____. 0° Latitude 90°
Page 1 Yearly Temperature Ranges: Yearly Temperature Range: is the difference between the highest monthly average temperature and the lowest monthly average temperature 1. ² High temperatures ² Small temp range ² Low latitude ² Equatorial region
Page 1 Yearly Temperature Ranges: 2. ² Medium temperatures ² Medium temp range ² MID latitudes ² 25°-60° Latitudes ²USA
Page 1 Yearly Temperature Ranges: 3. ² Low temperatures ² Large temp range ² High latitudes ² 60°+ Latitudes ²Polar Region
Page 1 Yearly Temperature Ranges: 4. ² Southern Hemisphere
Page 1 As Latitude increases yearly temperature ranges _______. INCREASES TEMP RANGE 0 90
How does latitude affect climate? Temp Range As latitude ____, increases the average increases yearly temperature range _____. 0° Latitude 90°
How about an example
Page 1 Average Yearly Temperature VS. Yearly Temperature Range Avg. Yearly Temperature Valdivia, Chile 53° F Peking, China 53 ° F Yearly Temp. Range 16 ° F (From 46°F – 62°F) 55 ° F (From 24°F – 79°F)
Page 1 Average Yearly Temperature VS. Yearly Temperature Range Latitude for Peking 40° N & Valdivia 39. 5°S- almost the same GOOGLE MAPS
Page 1
2. ELEVATION : As air rises, it expands and cools. Page 1 _____ low average yearly temp. (Mountain top) Look at the snow! high average ______ yearly temp. (sea level) go to the beach! As altitude increases, average yearly temperature _____. decreases C. This is an indirect relationship.
Page 1 How does elevation affect climate? Temperature increases the average As elevation _____, annual temperature _____. decreases Elevation
How about an example
Page 1 • • Mt. Kilimanjaro in Tanzania Latitude 3° South (Very close to Equator) Temperature at base 85°F (sea level) Temperature at Summit 0°F (19, 330 ft. ) As elevation increases, average yearly temperature decreases.
Example Page 1 As elevation increases, average yearly temperature decreases.
Answers to Questions on Page 2 1. 2. 3. 4. 5. 1 2 1 4 3
Answers to Questions on Pages 3 & 4 1. 2. 3. 4. 5. 1 4 2 2 3 6. 1 9. 2 7. 4 10. 3 8. 1
Page 5
Page 5 How does closeness to a large body of water affect climate? moderates the temperature. Water _____ Cooler summers. _______ Warmer winters. _______ Cities A & B are located at the same latitude. City B is closer to a large body of water. Its temperature line is flatter (moderated).
Coastal vs. Continental Page 5 smaller • Coastal areas have marine climates with ____ yearly temperature ranges. • Continental climates (land areas) have continental climates larger yearly temperature ranges. with _____ • Sea or land locations affect temperature ranges. Since land gains and loses heat much more quickly warmer than water, land areas tend to have ______ cooler winters. Coastal areas summers and _____ near the ocean have cooler summers and warmer winters. X = coastal climate Small yearly temp. range Y = continental climate Large yearly temp. range
Page 5 How about an example
Page 5 These 2 cities are located at the same latitude, but do they have the same climate? Look at the climographs- describe their ave. annual temp, annual temp range, & precipitation
Page 5 These 2 cities are located at the same latitude, but why don’t they have the same climate? Iceland Yakuts. K
Coastal vs. Continental Climates Page 5 Coastal: cooler summers, warmer winters Continental: warmer summers, cooler winters Water moderates the Climate
Page 5
Surface ocean currents ESRT p. 4 Page 5
Page 5 How do ocean currents affect climate? Warm Currents: warmer climate Cold Currents: cooler climate
Page 5
• Warmer or Colder? • Due to ocean currents, the: Page 5 warmer • East coast of North America is ________ than normal colder • West coast of North America is _______ than normal warmer • East coast of South America is ______________ than normal colder • West coast of Africa and Europe is ______ than normal warmer • Northwestern Europe is __________ than normal
Answers to Questions on Pages 6 & 7 1. 2 2. 4 3. 1 4. 3 5. 3 6. 1 7. 4 8. 4 9. 4 10. 3 11. 3 12. 3 13. 3 14. 3 15. 4 16. 3
RAINFALL FACTORS • Latitude & Mountain Barriers Page 8
Page 8 Mountain Barriers
Page 8 Windward Prevailing circulation Leeward 4. Air condenses COOL & HUMID WARM & DRY 5. Precipitation 6. Air sinks 3. Air cools 7. Air compresses 2. Air expands 1. Air rises OCEAN 8. Warms MOUNTAINS
How does the Orographic Effect affect climate? cool, moist Windward Side: ______ warm, dry Leeward Side: _______
Page 8 Orographic or Rainshadow Effect
Page 8 How about an example
Seattle vs Spokane Page 8 The leeward sides of the CASCADE MTS. receive much less precipitation The windward sides of the MOUNTAINS receive a great deal more precipitation
Seattle vs Spokane Page 8 The leeward sides of the CASCADE MTS. receive much less precipitation The windward sides of the MOUNTAINS receive a great deal more precipitation
Seattle vs Spokane Page 8 The leeward sides of the CASCADE MTS. receive much less precipitation WHERE ARE THE MOUNTAINS? ?
Page 8 1. Latitudes: 0° & 60° North & South 2. Convergent winds & Low pressure 3. Latitudes: 30° North & South & 90° North & South 4. divergent winds & High pressure
Page 8
Answers to Questions on Pages 9, 10, & 11 1. 2. 3. 4. 5. 6. 7. 2 4 1 3 3 2 3 8. 3 9. 2 10. 3 11. 1 12. 2 13. 2 14. 1
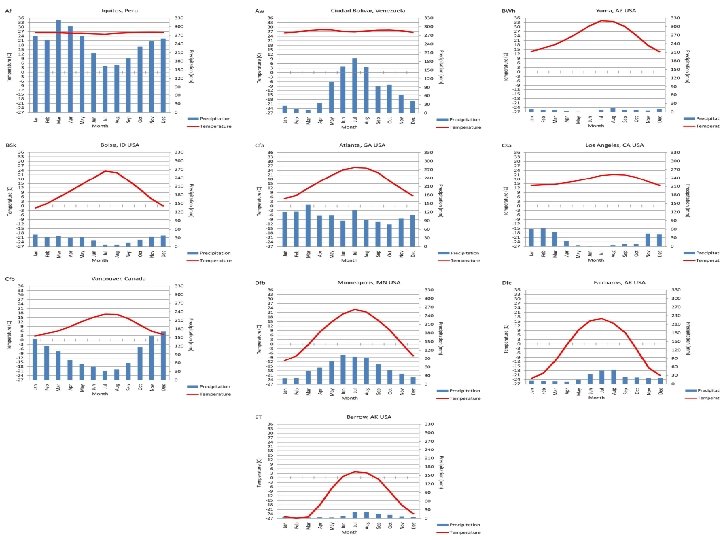
Back of Notepacket v Are graphs that show the climate of a particular area v Climographs include average monthly temperatures (yearly temperatures) v Climographs demonstrate temperature range v Climographs show monthly precipitation totals
Back of Notepacket