WRAP Wind Blown Fugitive Dust and Ammonia Emissions

WRAP Wind Blown Fugitive Dust and Ammonia Emissions Updates WRAP Regional Modeling Center UC Riverside/ENVIRON Presented at RPO National Workgroup Meeting November 4 – 6, 2003 St. Louis, Missouri

Project Team Fugitive Dust • Gerard Mansell; ENVIRON • Martinus Wolf, Paula Fields; ERG • Jack Gillies; DRI • Mohammad Omary; UCR • Bill Barnard; MACTEC Engr. & Consulting • Michael Uhl; DAQM, Clark County, NV Ammonia • Mark Chitjian; UCR • Gerard Mansell; ENVIRON

Outline • • • Project Background & Overview Literature Review Estimation Methodology Agricultural Considerations Data Sources Summary of Assumptions Program Implementation Results Recommendations

Background and Overview of Project • Develop General Methodology to Facilitate Future Revisions and Control Strategy Development • Develop Integrated SMOKE Processing Modules for PM 10 and PM 2. 5 Emissions Modeling • Develop PM 10 and PM 2. 5 Emission Inventory Applicable to the Western Region

Overview of Technical Approach • • Categorize Vacant Land Types Identify Wind Tunnel Emission Factors Develop Meteorological Data Develop Threshold Wind Velocities, Wind Events, Precipitation Events • Apply Emission Factors to Vacant Land Categories

Literature Review • Portable field wind tunnels have been used to investigate particle entrainment thresholds, emission potentials, and transport of sediment by wind. • Major contributions of information on: – thresholds from Gillette et al. (1980), Gillette et al. (1982), Gillette (1988), Nickling and Gillies (1989); – emission fluxes from Nickling and Gillies (1989), James et al. (2001), Columbia Plateau PM 10 Program (CP 3), Houser and Nickling (2001). • Key information has also come from dust emission modeling (e. g. , Alfaro et al. , 2003) and desert soil characterization studies (e. g. , Chatenet et al. , 1996).

Wind Tunnel Study Results: Thresholds *(Gillette et al. , 1980; Gillette et al. , 1982; Gillette, 1988; Nickling & Gillies, 1989) * Comparison between modeled relationship of threshold friction velocity and aerodynamic roughness length and wind tunnel data.

Wind Tunnel Study Results: Emissions The emission flux as a function of friction velocity predicted by the Alfaro and Gomes (2001) model constrained by the four soil geometric mean diameter classes of Alfaro et al. (2003).

Wind Tunnel Study Results: Emissions as a function of texture Relations between the soil types deduced from aggregate size distributions of various desert soils and soil textural categories (Chatenet et al. 1996). The “gray” highlighted textural classes indicate the 4 sediment types; the arrows indicate the pathways linking these types to the other textures. These can be linked to the North American soil texture triangle.

Wind Tunnel Study Results: Emissions Comparison between model relationship for FS and CS sizes and the wind tunnel data of Nickling and Gillies (1989). Ten (out of 13) sites have a dust production potential similar to the FS model and one site (Mesa agricultural) is closely aligned with the CS model (after Alfaro et al. , 2003).
 0. 035 0.")
Emission Rates by Soil Group for Stable Soils Emission Factor (ton/acre/hour) 0. 035 0. 03 0. 025 Soil Group 1 Soil Group 2 0. 02 Soil Group 3 Soil Group 4 Soil Group 5 0. 01 0. 005 0 20 - 24. 9 25 - 29. 9 30 - 34. 9 35 - 39. 9 40 - 44. 9 10 -m Wind Speed (mph) 45 - 49. 9 50 - 54. 9
 0. 03 0.")
Emission Rates by Soil Group for Unstable Soils Emission Factor (ton/acre/hour) 0. 03 0. 025 0. 02 Soil Group 1 Soil Group 2 0. 015 Soil Group 3 Soil Group 4 Soil Group 5 0. 01 0. 005 0 20 - 24. 9 25 - 29. 9 30 - 34. 9 35 - 39. 9 40 - 44. 9 10 -m Wind Speed (mph) 45 - 49. 9 50 - 54. 9

Agricultural Considerations • Non-climatic factors significantly decrease soil loss from agricultural lands • Similar approach to CARB, 1997 • Five “adjustment” factors simulate these effects: – Bare soil within fields – Bare borders surrounding fields – Long-term irrigation – Crop canopy cover – Post-harvest vegetative cover (residue)

Canopy Cover and Residue Cover Adjustment Factor

Agricultural Adjustment Factor Development • New regional data collected for WRAP project: – Crop calendars with growth curves from Revised Universal Soil Loss Equation (RUSLE 2) model – Residues remaining after harvest due to conservation tillage practices from Purdue’s Conservation Technology Information Center (CTIC) – Irrigation events from crop budget databases • Factors applied by county/crop type, crop management zones (CMZs)
 – Biogenic Emission Landcover Database (BELD 3)")
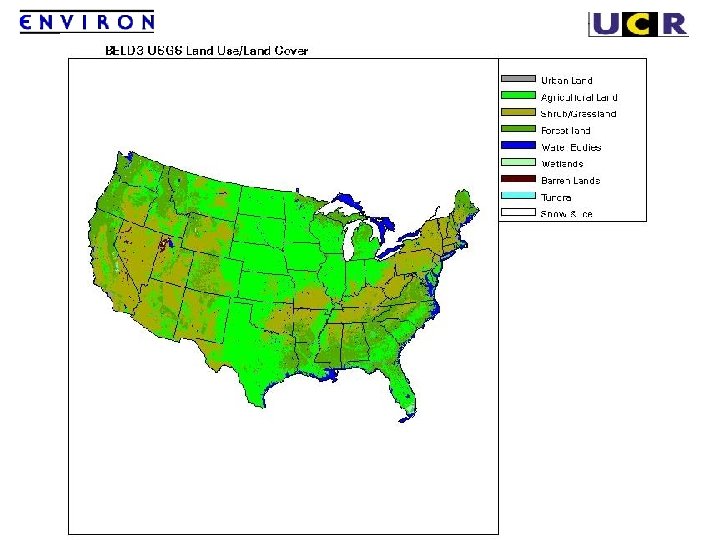
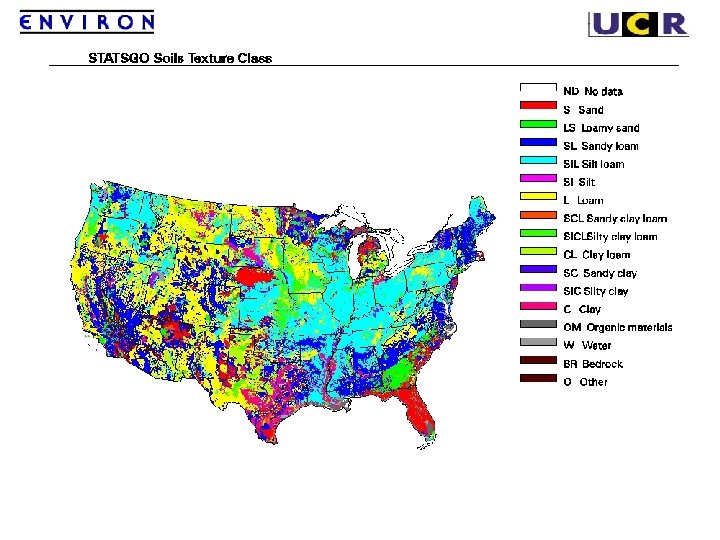
Data Sources • Land Use/Land Cover (LULC) – Biogenic Emission Landcover Database (BELD 3) – North American Land Cover Characteristics – National Land Cover Database (NLCD) • Soils Characteristics – State Soil Geographic Database (STATSGO) – Soil Landscape of Canada (SLC_V 2) – International Soil Reference and Information Centre • Meteorological Data – 1996 MM 5 36 -km (Wind Velocity, Precipitation, Snow/Ice, Soil Temperature)

Land Use/Land Cover Data • BELD 3 LULC Data

Meteorological Data • 1996 MM 5 – 1996 Annual, hourly, gridded meteorology – 36 -km horizontal resolution – 10 -m wind speeds – Precipitation rates – Snow/ice cover flag – Soil temperature

Data Compilation for Land Use and Soil Types • Land use and soil texture aggregated to 12 -km resolution • Major land use categories – Urban – Agricultural – Shrub and grasslands – Forest – Barren and Desert • Land use fractions from 1 -km data retained as percentages • Dominate soil texture at 12 -km resolution

Soil Texture Categorization • Standard soil types mapped to 5 major types for dust calculations STATSGO Soil Texture Code – Silty Sand Clay No Data 0 – Sandy Silt Sand 1 Loamy Sand 2 – Loam Sandy Loam 3 Silt Loam 4 – Sand Silt 5 Loam 6 – Silt Sandy Clay Loam Silty Clay Loam Sandy Clay Silty Clay 7 8 9 10 11 12 Soil Group Code 0 4 4 2 1 5 3 2 5 1

Vacant Land Stability • Windblown dust emissions affected by soil stability • Stability determination based on land types • Urban lands may be stable or unstable

Urban Land Stability • Urban lands divided into core and boundary areas • Core = 92. 67%; Boundary = 8. 33% • Core urban areas: – 8 % unstable – 92% stable • Boundary urban areas: – 30% unstable – 70% stable

Reservoir Characteristics • Reservoirs characteristics based on stability – Stable = limited – Unstable = unlimited • Stable reservoirs are depleted within 1 hour • Unstable reservoirs are depleted within 10 hours • Reservoirs require 24 hours to recharge

Precipitation and Freeze Events • • No dust emissions during rain events Rainfall from MM 5 at 36 -km resolution No dust emissions if snow/ice cover present Dust emissions re-initiated: – 72 hours after rain – 72 hours after snow/ice meltdown – 12 hours after thaw

Vegetative Cover Adjustments • Vegetation cover reduces dust emissions • Methodology developed for bare soil • Emissions reduction factors developed from White (2000) • Vegetation density based on land use types

Vegetative Cover Adjustments

Summary of Assumptions • • Threshold velocity = 20 mph Vacant land stability Urban lands Dust reservoirs Reservoir depletion and recharge times Precipitation, snow and freeze events Vegetation density

Program Implementation • Daily/Hourly Meteorological Data • State/County, Crop Management Zone, and Soil Type, For Each 12 km Cell. • Area fractions For Each 12 km Cell, and Land Use For Each Area Fraction. • Agricultural Adjustment Data • Emission Rates by Soil and Wind Speed Categories

Agricultural Input Data • • County and CMZs for 12 -km grid cells Crop area percentages for 12 -km cells Barren, border and crop fractions for BELD 3 crops Long term irrigation factors by soil type Irrigation fraction by county and crop Tillage fractions by crop and county Planting and harvesting dates by crop (crop calendars) • Crop canopy cover by crop (growth curves) • Residue cover

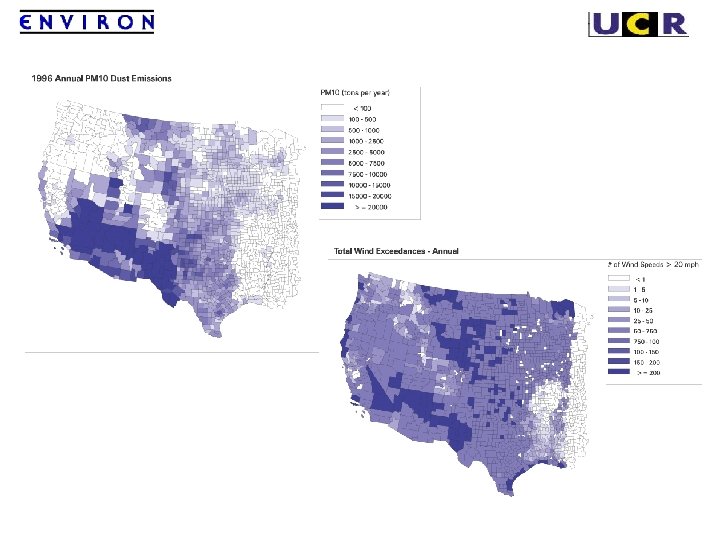
Summary of Annual PM 10 Emissions

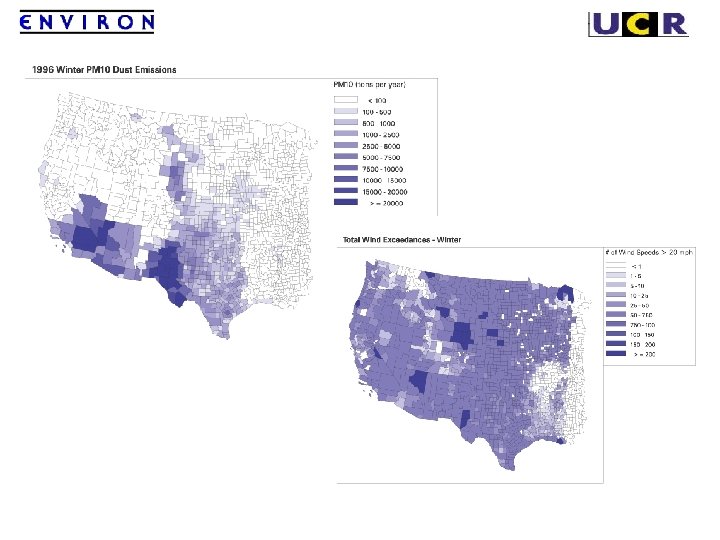
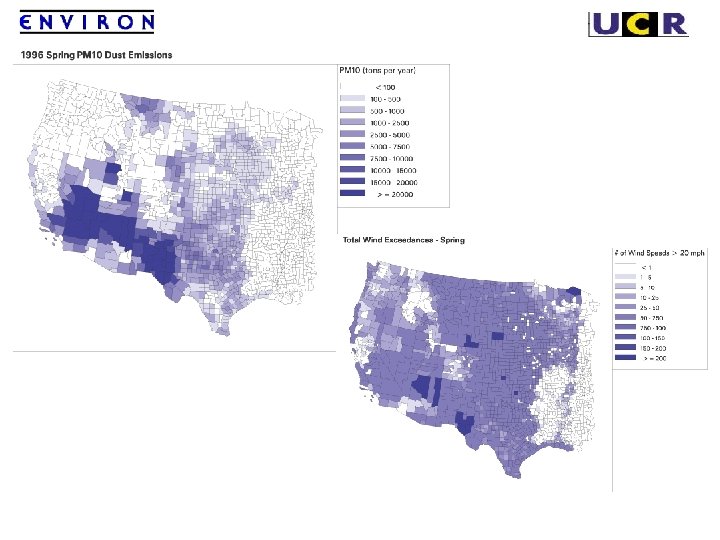
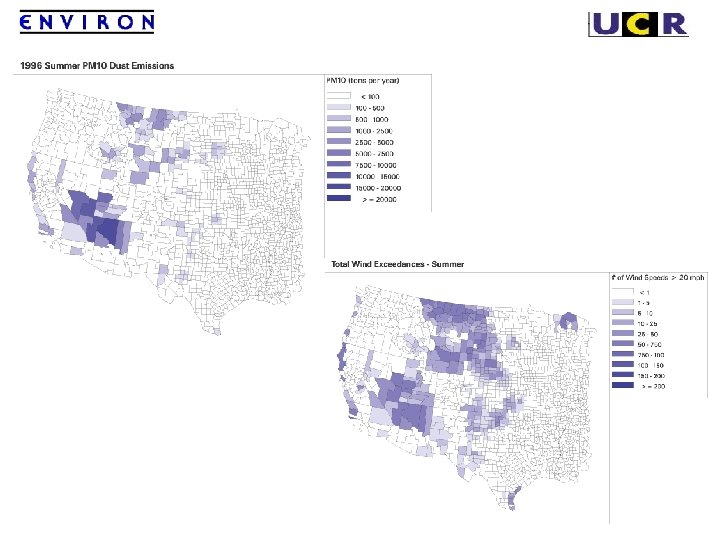
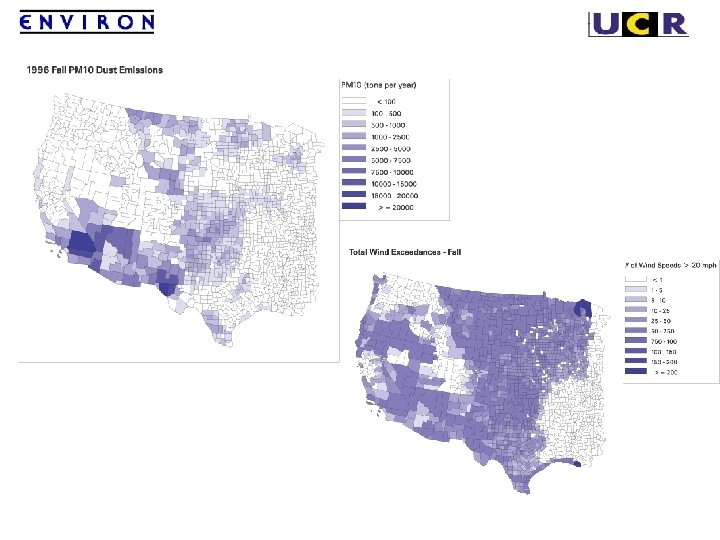
PM 10 Dust Emissions by Month

Monthly PM 10 Emissions by Landuse Type

Monthly PM 10 Emissions by Crop Type

Annual PM 10 and PM 2. 5

Monthly PM 10 Emissions

Monthly PM 10 Emissions

Monthly PM 10 Emissions

Monthly PM 10 Emissions

Monthly PM 10 Emissions

Monthly PM 10 Emissions

Sensitivity Simulation • Evaluate impact of threshold velocity and reservoir assumptions • Extend emissions factor relations to lower wind speeds • Relax reservoir recharge assumptions: – 6 hours between wind events – 24 hours after rain events – 24 hours after snow/ice meltdown – 6 hours after thaw

Recommendations • Methodology review and refinement • Current, detailed data to characterize vacant lands • Methodology validation with small-scale, high resolution domain • Comparison with other methodologies • Identification and evaluation of additional wind tunnel studies • Application to other domains, years

WRAP Ammonia Emissions Updates

Model Flow Activity Data Annual Inventory -by source -by county Emission Factors Emission Estimation Meteorological Data Soils Data Spatial and Temporal Allocation Arc. Gis Ammonia Emission Model NLCD Census Data Allocation Association Table Domain Definition Gridded Inventory -total NH 3 -by grid cell Reports Summaries QA/QC

GIS-Based Emissions Model Development • Designed to : – treat relationship of ammonia emissions to environmental variables – incorporate high resolution spatial data (LU/LC databases; population density; geo-coded point sources) – incorporate detailed source classification schemes • Based on Arc/INFO GIS • Flexible input data sources/formats; easily modified input tabular data (activity data, EF, spatial surrogate relationships, domain definition) • Efficient processing capabilities • Modular • Intuitive user interface

Focus on Largest Sources • Livestock - dairy, beef, pigs, poultry, sheep, horses • Fertilizer • Soils – highly uncertain, may at time act as source or sink, potentially very large source

Minor Sources • Mobile - on-road and off-road • Domestic - respiration, perspiration, cigarettes, pets, etc. • Landfills • Composting • Industrial • Wildfire/Ag fire

Spatial Allocation • Point Sources – As many sources as possible Landfills Confined Feeding Operation Industrial Large Poultry Facilities Compost Dairies • National Land Cover Data (NLCD) • Census Coverages – Domestic Sources • Environmental Parameters – i. e. , Soil p. H

Temporal Allocation • Empirically Based Seasonal and Diurnal Profiles • Temporally Varying Environmental Parameters Wind Speed Air Temperature Soil Surface Temperature

NLCD • • 30 meter resolution 21 Land Cover Classification Categories Based on Landsat Thematic Mapper Data Developed by Multi-Resolution Land Characterization Consortium • USGS • EPA • Forest Service • NOAA

NLCD Classification Codes 11 12 21 22 23 31 32 33 41 42 43 Open Water Perennial Ice/Snow Low Intensity Residential High Intensity Residential Commercial/Industrial/Trans portation Bare Rock/Sand/Clay Quarries/Strip Mines/Gravel Pits Transitional Deciduous Forest Evergreen Forest Mixed Forest 51 61 71 81 82 83 84 85 91 92 Shrubland Orchards/Vineyards/Other Grasslands/Herbaceous Pasture/Hay Row Crops Small Grains Fallow Urban/Recreational Grasses Woody Wetlands Emergent Herbaceous Wetlands

WRAP NH 3 Model Main Menu

Emission Calculation Menu

Annual Gridded Domestic NH 3 Emissions

Literature Review • • Eleven Relevant Recently Published Papers Temporal Allocation – Sakurai and Fujita, 2002; van. Hove et al. , 2002; Pinder at al. , 2003; Roelle and Aneja, 2001; De Visscher et al. , 2002; Anderson et al. , 2003 Livestock Emission Factors – Jarvis and Ledgard, 2002; Battye et al. , 2003; Pinder at al. , 2003 Keener et al. , 2001; Doorn et al. , 2002; De Visscher et al. , 2002 Mobile Emission Factors – Durbin et al 2002 Soil Emission Factors – Battye et al. , 2003; Roelle and Aneja 2001

Schedule • Draft 1996 NH 3 modeling inventory by December 2003 • Next Step: 2002 NH 3 inventory
- Slides: 63