WRAP Fugitive Dust Emission Summary and Evaluation Ao
")


 – Annual VMT data from FHWA Statistics")


 • Evaluate/Summarize")
- Slides: 53
WRAP Fugitive Dust Emission Summary and Evaluation (Ao. H Phase II/TSS Task 7 b) ENVIRON International Corporation 15 November 2005 Tempe, AZ
Outline • • Project Objectives Fugitive Dust Source Categories Emission Estimation Methodologies 2002 Annual County-level Summaries 2002 Annual Gridded Summaries PM 2. 5/PM 10 Ratios Next Steps
Project Objectives • Summarize all fugitive dust emission sources • Evaluate dust emissions for reasonableness and consistency – Review estimation methodologies (AP-42, State/local studies, regional models, etc. . ) – Review fine fraction (PM 10/PM 2. 5) • Develop SCC-level summaries: – County-level – Model-ready, gridded • Develop summaries by geographic region • Consider 2002 and 2018 EIs
Fugitive Dust Source Categories • Agricultural Dust – Harvesting – Tilling – Transport – Feedlots • Construction Dust – Mining/Quarrying – Road Construction – Residential – Industrial/Commercial/Institutional • Road Dust – Paved – Unpaved • Windblown Dust
Estimation Methodologies • Agricultural Tilling – 2002 NEI grown from 1998 • Growth factors vary by tilling type (0. 77 – 1. 16) – Activity is acres tilled by type and crop (from CTIC) – EF = 4. 8*k*s 0. 6*p • k=particle size multiplier (PM 10 = 0. 21; PM 2. 5 = 0. 042) • S = silt content (USDA data; varies by soil type) • P = # of passes/tilling per year (varies by crop) – E = EF * A
Estimation Methodologies • Construction – Residential – Emissions are function of acres disturbed and volume of soil excavated (varies by type of structure) – Activity data (housing starts by structure type) from Dept. of Commerce – Emission factors vary by structure type and duration of construction (0. 011 tons PM 10/acre-month – 0. 11 tons PM 10/acre-month) – Adjustments applied for soil moisture, silt content and control efficiency
Estimation Methodologies • Construction – Non-Residential – Emissions are function of acres disturbed – Activity data (value of construction in $MM, allocated from national to county based on employment statistics) from Dept. of Commerce – Number of acres disturbed estimated as 1. 55 acres/$MM applied to county-level construction valuation data – Emission factor = 0. 19 tons/acre/month (assumed 11 month construction duration) – Adjustments applied for soil moisture, silt content and control efficiency
Estimation Methodologies • Road Construction – Emissions are function of acres disturbed; developed from – – – FHWA data State-level new miles of road construction from 2002 FHWA state expenditure data by road type Converted to $/mile using NCDOT conversion data; converted to acres disturbed/mile by road type State data allocated to county based on residential building starts Emission factor = 0. 42 tons/acre/month; assumed 12 month duration Adjustments applied for soil moisture, silt content and control efficiency
Estimation Methodologies • Paved Road Dust – Uncontrolled emissions estimated at state level by roadway class and – – month Calculated as State/Roadway class VMT * TAF * EF Spatially allocated to counties based using VMT surrogate Controls applied to Non-Attainment counties EF = [k*(s. L/2)0. 65 *(W/3)1. 5 -C]*[1 -P/(4*N)] • • • k= particle size multiplier (PM 10 = 7. 3; PM 2. 5 = 1. 8) s. L = silt loading W= avg. vehicle weight C = EF for 1980 fleet N= # days in month P= # days with precip. > 0. 01 in – Annual VMT data from FHWA Statistics – County emissions = State Emissions * (VMTcounty/VMTState) – Assumed control measure: Vacuum sweeping twice/month; 79% control efficiency. ; Rule penetration varies by roadway class and NA status; 100% Rule Effectiveness
Estimation Methodologies • Unpaved Road Dust – Uncontrolled emissions estimated at state level by roadway class and – – month Calculated as State/Roadway class VMT * TAF * EF Spatially allocated to counties based using 1990 rural population surrogate Controls applied to Non-Attainment counties EF = [k*(s/12)a *(SPD/30)b]/(M/0. 5)c-C • • • k= particle size multiplier (PM 10 = 0. 27; PM 2. 5 = 1. 8) s = silt loading SPD = mean vehicle speed M = moisture content C = EF for 1980 fleet a, b, c = empirical constants – EF adjusted for precip: Efcorr= EF * [(D-p)/D)] • D = # days in month • P = # days with precip > 0. 01 in.
Estimation Methodologies • Unpaved Road Dust (continued) – Annual VMT data from FHWA Statistics • Separate estimates for county and non-county roadways • County-maintained VMT by road type and ADTV • State/Federal-maintained VMT by arterial classification; county-maintained VMT used – Annual VMT estimates allocated seasonally and monthly – County emissions = State Emissions * (Rural Pop. county/Rural Pop. State) – Assumed control measures vary by Non-Attainment classification (paving and/or chemical stabilization). Control efficiency, rule penetration and rule effectiveness vary
Estimation Methodologies • Windblown Dust – WRAP Phase II WB Dust Model – 2000 Landuse/Landcover data • BELD 3 county-level crop percentages – STATSGO Soils data – 2002 MM 5 Meteorology (36 - and 12 -km) – Latest Transport Fractions (EPA, 2005) – PMC/PMF = 0. 9/0. 1
RPO-Specific Revisions/Enhancements • WRAP – Road Dust – Developed by ENVIRON. • CA emissions interpolated from previous EI development • Unpaved VMT based on NET 96 updated with state survey results • VMT data adjusted based on Clark Co. ADTV revisions factor • Silt loading from IL State Water Survey • Precipitation data from NCDC • Applicable control measures from State survey results – Agricultural Dust - Developed by ERG based on 2002 draft NEI (gap-filled by EPA/Pechan). Additional state submissions included as part of WRAP EI Update process. – Construction Dust - 2002 NEI estimates submitted by States
RPO-Specific Revisions/Enhancements • CENRAP – Agricultural Dust – Developed by STI based on local activity data, county- level silt loading and tilling practices, monthly allocation by state. Includes some livestock feedlot dust emissions – Construction and Road Dust from 2002 NEI • VISTAS – 2002 NEI State submissions for all sources • MWRPO – Agricultural and Construction Dust (IL & IN only) - Based on 2002 State CERR data – Road Dust – WRAP 2002 inventory data – All Fugitive dust emissions dramatically reduce through application of transport fractions (90%-97%). Based on monitoring data analyzed by LADCO • MANE-VU – 2002 NEI for all dust sources
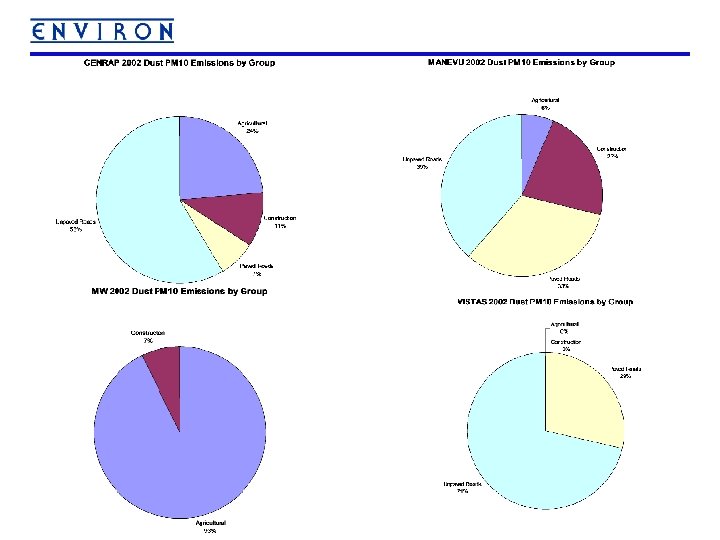
2002 Fugitive Dust Inventory
2002 Fugitive Dust Inventory
2002 Fugitive Dust Inventory
2002 Fugitive Dust Inventory
2002 Fugitive Dust Inventory
2002 Fugitive Dust Inventory
2002 Fugitive Dust Inventory
2002 Fugitive Dust Inventory
2002 Fugitive Dust Inventory
2002 Fugitive Dust Inventory
2002 Fugitive Dust Inventory
2002 Fugitive Dust Inventory
2002 Fugitive Dust Inventory
2002 Fugitive Dust Inventory
2002 Fugitive Dust Inventory
2002 Fugitive Dust Inventory
2002 Fugitive Dust Inventory
2002 Fugitive Dust Inventory
2002 Fugitive Dust Inventory
2002 Fugitive Dust Inventory
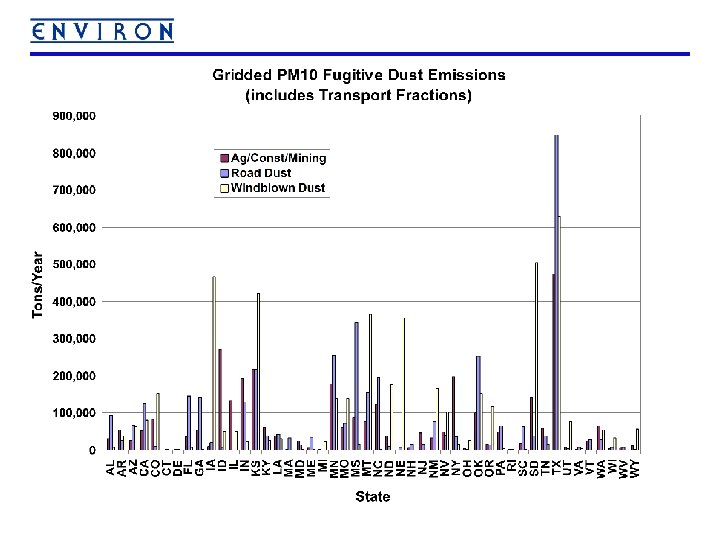
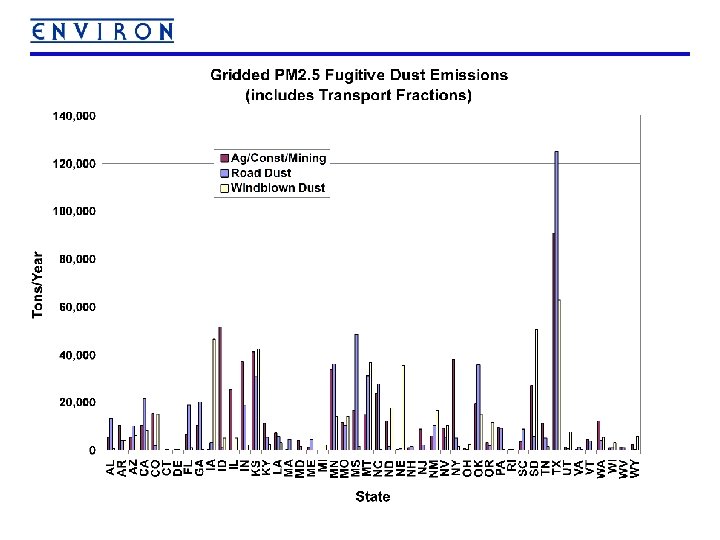
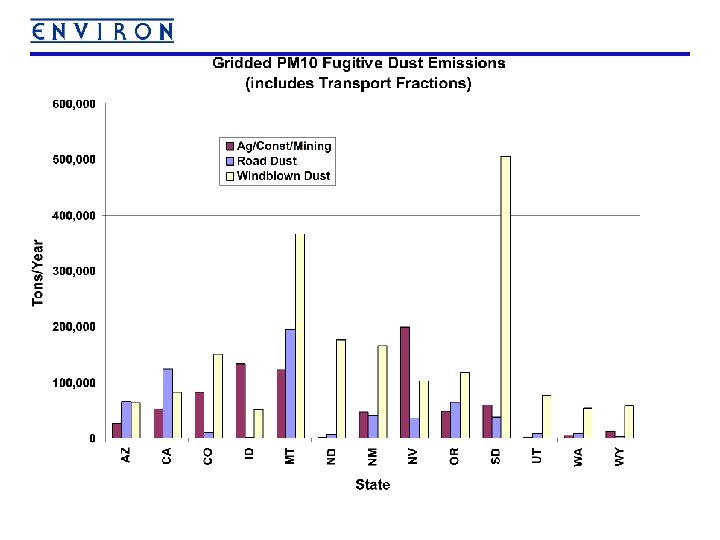
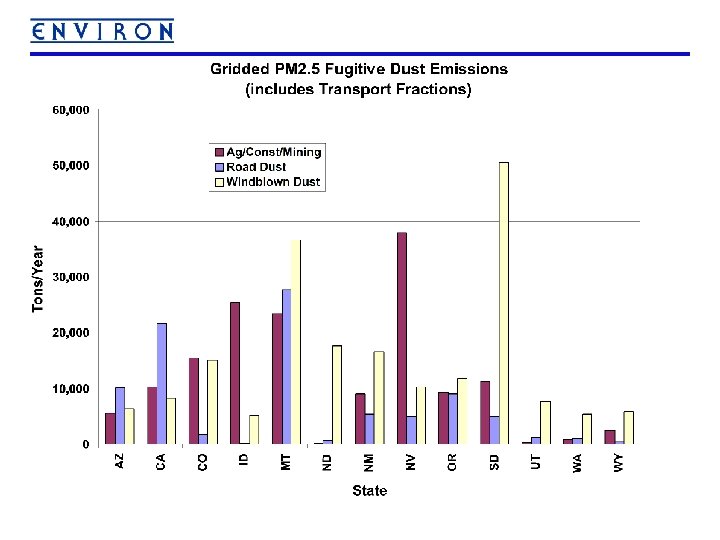
Spatial Distribution of Fugitive Dust Emissions
Spatial Distribution of Fugitive Dust Emissions
Spatial Distribution of Fugitive Dust Emissions
Spatial Distribution of Fugitive Dust Emissions
Spatial Distribution of Fugitive Dust Emissions
Spatial Distribution of Fugitive Dust Emissions
Proposed Revisions to Fine Fraction Ratios Used for AP-42 Fugitive Dust Emission Factors Source Category Paved Roads Unpaved Roads Construction & Demolition Aggregate Handling/Storage Piles Industrial Wind Erosion Agricultural Tilling AP-42 Section 13. 2. 1 13. 2. 2 PM 2. 5/PM 10 Ratio Current Proposed 0. 25 0. 15 0. 10 -- 0. 208 0. 10 13. 2. 4 0. 314 0. 10 (traffic) 0. 15 (transfer) 13. 2. 5 0. 40 0. 15 -- 0. 222 0. 20
PM 2. 5/PM 10 Ratios
PM 2. 5/PM 10 Ratios
PM 2. 5/PM 10 Ratios
PM 2. 5/PM 10 Ratios
PM 2. 5/PM 10 Ratios from Gridded Data
PM 2. 5/PM 10 Ratios from Gridded Data
Next Steps • Revise PM 2. 5/PM 10 fractions (? ? ) • Evaluate/Summarize Revisions for Base 02 a • Evaluate 2018 inventory • Prepare Technical Memorandum