WQX Web and OISC FIFRA Data and followon

WQX Web and OISC FIFRA Data, and follow-on work in 2015 Larry Theller, ABE, Purdue University April 16, 2015
 OISC FIFRA data upload project (done) – Establish Node")
NEIEN Grant Progress • A) OISC FIFRA data upload project (done) – Establish Node – Train OISC Staff – Transfer IT Knowledge • B) Load Duration Curve model upgrade (in progress) – Improve LDC interface to WQX – Mine WQX for calibration data for online model
 • EPA is specifically authorized to: (1)")
Federal Insecticide, Fungicide, and Rodenticide Act (FIFRA) • EPA is specifically authorized to: (1) strengthen the registration process by shifting the burden of proof to the chemical manufacturer, (2) enforce compliance against banned and unregistered products, and (3) promulgate the regulatory framework missing from the original law. • FIFRA provides EPA with the authority to oversee the sale and use of pesticides. However, because FIFRA does not fully preempt state/tribal or local law, each state/tribe and local government may also regulate pesticide use.
 is charged with administering")
OISC • The Office of the Indiana State Chemist (OISC) is charged with administering several agricultural laws involving animal feeds, fertilizers, pesticides and seeds. • The goals of these laws are to ensure truth-inlabeling, food safety, user safety and the protection of our environment.

Purdue-OISC WQX NODE Network Design Proposed, Tested, but Not Implemented Win 2003 Server My. SQL Backup of Prod. database abe 2 k 3 s 2 Authenticated QUERY to CDX Red Hat Server My. SQL Main Development Server Data Loader Test Query Test abeip 867 Interim Production Server Rollover to: 8 -Core Red Hat Server Oracle Templeton. ecn Permanent Production Server Ubuntu Dev Server My. SQL Development (Test) computer
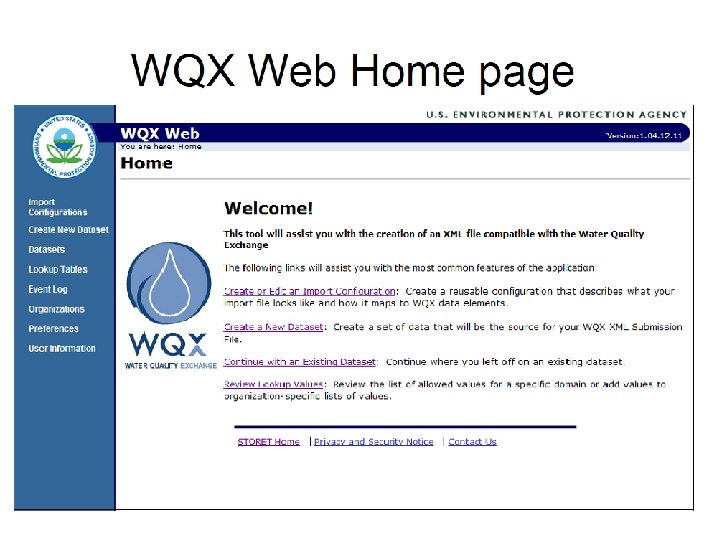

Current WQX Web Design OISC Spreadsheet of results Excel QC done and Reformat to XML Authenticated upload to staging database 1 Authenticated XML upload to CDX 2 Staging CDX

The pink colored tab is used to export data for upload; The yellow tabs to set-up the input data; The green tabs provide a linked reference for documented elements in WQX.

In this typical spreadsheet layout, the measurements are in columns, and each set of samples from a location is a row.

The columns need to pivot so each measurement becomes one row, and the data collection notes need to be replicated for each measurement.
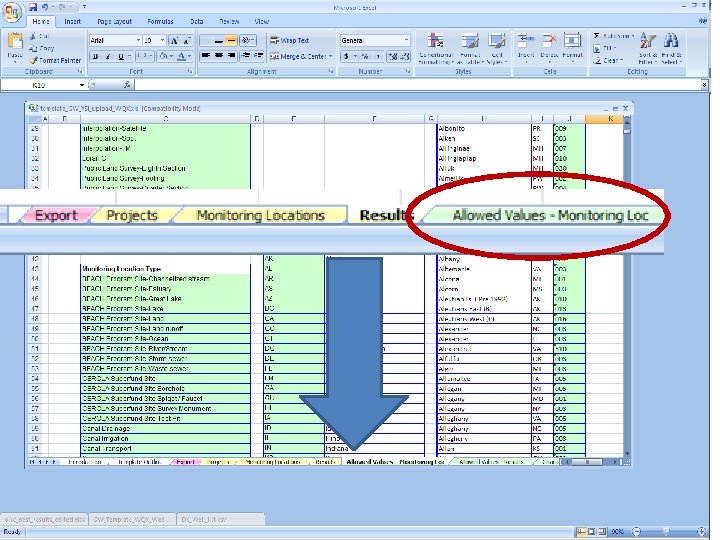

The EPA template has dictionaries of data elements. For example there are 3046 analytical methods in this table, with Method ID, Name and Context (Agency)

The biggest issue for OISC was that analytical methods for quantitative analysis of unregistered and new pesticides (e. g. nicotininoids) are not included in the template, and must be created by hand.

Success loading data sets
 –")
Grant 2: Tools to consume data • Load and Flow Duration Curve (LDC) – Auto Upload of flow data from USGS – Auto Upload of water quality data from USGS – Manual Upload of water quality data from WQX Current Grant: WQX Data in Action

Needs Flow and matching WQ data

9 years of Water Quality Data Matching Flow Data

Currently user downloads file and examines it, then uploads to model.

Water Quality Data

Alternative: STORET map window for text query

Alternative: STORET Text query User is downloading a CSV file from STORET and processing it in two screens then uploading to us. This is a perfect example of a step that needs to be replaced with a REST service.

Water Quality Data

Alternative: USGS and WQ Portal


Model analyzes the two data sets and picks matching time periods

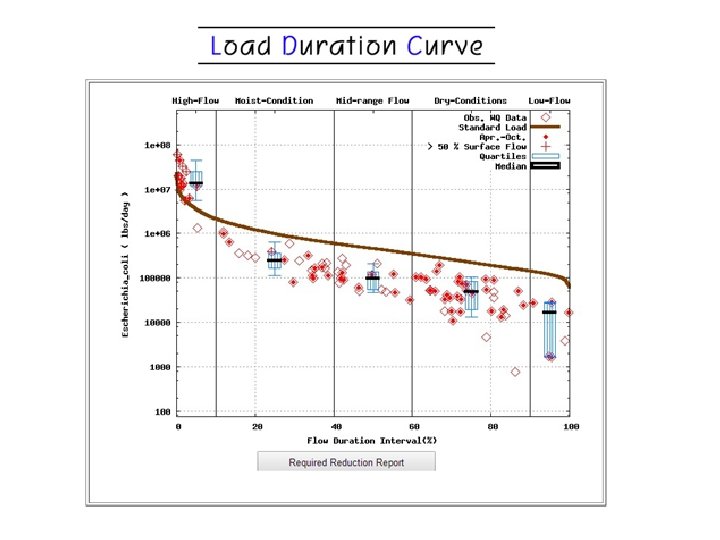
User has established a load target. Annual Load, plus required reduction for each Flow Regime

Provides BMPs, based on the target compound, which are from list implemented in STEPL

STEPL opens and asks for user input

Populates reduction information from LDC User can run an optimization module to compare efficiency (including efficacy in the flow regimes) of BMPs for the specific load target. Current grant seeks to pre-calculate these efficiencies from WQX data and provide them as streaming data to models, rather than as a usercreated one time effort.

Web-based LDC Tool and STEPL Web-based LDC Tool Online STEPL WEB Observed Annual Load Calibration of Simulated Annual Load Identifying Required Reduction Simulation of BMP Effect

https: //engineering. purdue. edu/~ldc/

The End
- Slides: 33