WP 7 MULTI DOMAINS WP 7 Multi domains


 Data feasibility (SGA-1) Data combination (SGA-2)")
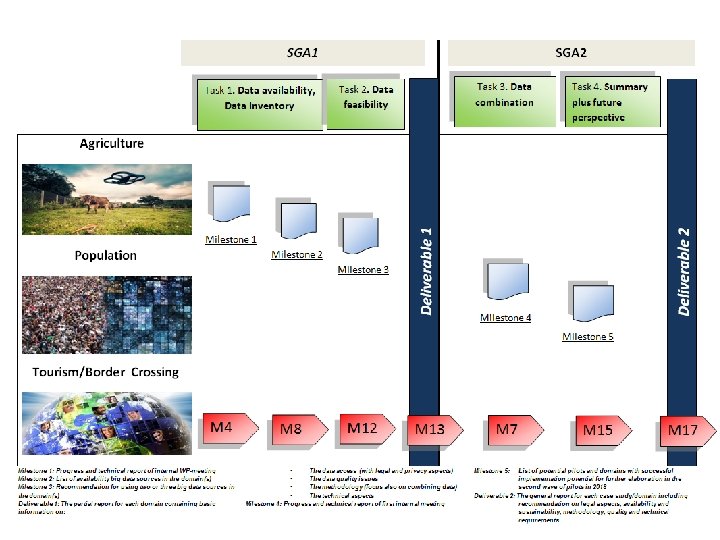
 Milestone 1. Progress and technical report of internal WPmeeting; by M")


: „List of")
 Population")


- Slides: 30
WP 7 MULTI DOMAINS
WP 7 Multi domains s main do Multi 7 P W WP 7 M WP 7 Multi domains Mult i dom i do 7 WP Mu lti ma ins s ains W P 7 ult lti u M in ma do do m ain s 7 WP ins lti u 7 M s ain a dom m i do lt Mu WP 7 Multi domains WP WP WP 7 M 7 M ulti dom ain s 7 M WP ulti s ain ins dom WP u 7 M lti a dom ult i do ma ins
1. Population
2. Tourism/border crossing
3. Agriculture
WP 7 TEAM Janusz Dygaszewicz Project Manager of Polish work Anna Nowicka Leader cooperation Jacek Maślankowski Coordinator of methodology PARTNERS Piet Daas Nigel Swier Coordinator of domain area (SGA-1) Cooperation on domain area John Sheridan Cooperation on domain area Country leaders of each domain • Regional statistical office in Poznań • Regional statistical office in Rzeszów • Department of Agriculture • Regional statistical office in Bydgoszcz • Department of Social Research • Regional statistical office in Olsztyn Tourism/ Population border crossing AGRICULTURE
Aim of WP 7 is to find out how a combination of: Big Data sources administrative data statistical data may enrich statistical output in domains:
WP 7 - Future perspectives Suggest pilots and domains with successful implementation potential for further elaboration in the second wave of pilots in 2018
WP 7 – General tasks Data access (SGA-1) Data feasibility (SGA-1) Data combination (SGA-2) Summary plus future perspectives (SGA-2)
Milestones and deliverables(SGA-1) Milestone 1. Progress and technical report of internal WPmeeting; by M 4 Milestone 2. List of availability Big Data sources in the domain(s); by M 8 Milestone 3. Recommendation for using two or three Big Data sources in the domain(s); by M 12 DELIVERABLE THE PARTIAL REPORT FOR EACH DOMAIN CONTAINING BASIC INFORMATION ON: We are here now The data access (with legal and privacy aspects) The data quality issues The methodology (focus also on combining data) The technical aspects by M 13
TASK 1 & TASK 2 BRAINSTORMING RESULTS QUESTIONNAIRE RESULTS MILESTONE 7. 4 PROGRESS AND TECHNICAL REPORT OF INTERNAL WP-MEETING INTERNAL MEETING MILESTONE 7. 5 „LIST OF AVAILABLE BIG DATA SOURCES IN THE DOMAIN(S)”
Why did we do the brainstorm? to create the widest possible range of Big Data sources (a cafeteria); possible sources of data that public statistics could use for new developments or supplement existing ones, so that in the later stages these sources can be verified from different points of view and gradually part of them will be eliminated as the least useful. to analyze as many as possible use cases of using Big Data sources to take into account the most popular source Big Data is a new phenomenon we should take into account that the potential of each source may still change.
to the QUESTIONNAIRE From BRAINSTORMING
Why did WP 7 carry out the questionnaire? to find out more about the possibilities of technical, methodological quality, access in different countries recommending the source to the pilots after 2018 to know the plans for Big Data of different countries questionnaire was sent to countries outside the FPA (but EU country), because we recommend beyond the period of its duration recognize the obstacles of using Big Data sources
The questionnaire results
Questionnaire - results
Results Q 7: What kind of obstacles have you come across while using Big Data sources? 0% 20% 40% Access 46% 52% Metholodogy aspects 48% 52% 34% 66% 28% 72% Yes No 100% 30% 54% Organization IT 80% 70% Legal aspects Quality 60%
Results Respondents were asked i. e. to indicate domain assuming, that the data source is accessible. For each of three domains (Population, Agriculture and Tourism/border crossing) respondents indicated the most promising BD sources: • Mobile sensors (tracking) – Mobile phone location; • Social Networks; • Data produced by Public Agencies; • Internet searches; • Websites; • Mobile sensors (tracking) – Satellite images; • Data produced by Public Agencies; • Mobile sensors (tracking) – Mobile phone location; • Data produced by business – Credit cards; • Websites; • Traffic sensors. Population Agriculture Tourism
Common WP 6 & WP 7 face to face meeting took place on 28 -30 of June in Warsaw 1. 2. 3. • Exchange of information/experience in using BD sources and arrangements for future work WP 7 • Build the list of potential sources for each domain • Preparation and establish a framework for cooperation to SGA-2
Results Access Legal Quality Organization Tourism/ Border crossing Agriculture IT Population Methodology
Results The results were used to elaborate the next milestone (Milestone 2): „List of availability Big Data sources in the domain(s)”; by M 8
Use cases for SGA-2 List of available Big Data sources in the domain(s) Population Domain Name of the use Everyday citizen satisfaction Agriculture Tourism/Border Crossing Estimation of Agricultural statistics – Border movement pilot case study on crop types based case on satellite data Big Data source Responsibility Social media/blogs/Internet portals Satellite images UK – coordinator (SGA-1) Department of Agriculture, RSO Rzeszów, Department of RSO Poznań/Bydgoszcz Brief overview of Webscraping Traffic sensors Olsztyn + IE Social Survey + NL combining data – data fusion on radar Intertemporal disaggregation and the methodology Data/Text/Web mining Machine and optical remote sensing data; interpolation, learning data comparison with traditional Latent variable models, surveys e. g. FSS; combining data – administrative data sources with satellite data. Cross entropy econometrics.
Use case for POPULATION „Everyday citizen satisfaction „ Responsibility: UK – coordinator, supported by PL, PT Data sources: Social media/Blogs/Internet portals Methodology: Webscraping, Data/Text/Web mining, Machine learning The goal of the case study: to examine the level of daily satisfaction by analyzing the content of messages for the presence of defined expressions describing emotional states, e. g. , happiness, joy, sadness, fear, anger; to present the moods of people associated with various public events; to observe morbidity areas, e. g. , flu. Plan of Combining Datasets: Combine in one repository the selected data from all Big Data sources, Comparison with the results of social studies to add more detailed information, Supplement of information gained in social studies. Main benefits and value added for official statistics: Support traditional European Social Survey, supplement of the research methodology of some phenomena that are difficult to measure through traditional polls. Everyday citizen satisfaction
Use case for POPULATION „Everyday citizen satisfaction„ Responsibility: UK – coordinator, supported by PL, PT • • • Data sources: Social media/Blogs/Internet portals Methodology: Webscraping, Data/Text/Web mining, Machine learning The goal of the case study: to examine the level of daily satisfaction by analyzing the content of messages for the presence of defined expressions describing emotional states, e. g. , happiness, joy, sadness, fear, anger; to present the moods of people associated with various public events; to observe morbidity areas, e. g. , flu. Plan of Combining Datasets: Combine in one repository the selected data from all Big Data sources, Comparison with the results of social studies to add more detailed information, Supplement of information gained in social studies. Main benefits and value added for official statistics: Support traditional European Social Survey, supplement of the research methodology of some phenomena that are difficult to measure through traditional polls.
Use case for TOURISM/ BORDER CROSSING Border movement
Use cases for TOURISM/ BORDER CROSSING „Border movement” Responsibility: PL – coordinator, supported by NL and PT. • Data sources: Traffic sensors. • Methodology: • intertemporal disaggregation and interpolation; • latent variable models; • cross entropy econometrics. • The goal of the case study: to estimate border traffic through internal border of EU (Polish-German, Polish. Slovakian, Polish-Czech and Polish-Lithuanian border) also regarding to some mirror statistics. Partial estimation of domestic traffic may be an extra result. • Plan of Combining Datasets: • Intertemporal disaggregation of data if it is the case (data frequency issue); • Latent variable model for data imputation for roads without traffic sensors; • Data smoothing if needed; • Preparing comparable data sets (common set of variables); • Combining traffic data from different sources with cross-entropy econometrics method. Main benefits and value added for official statistics: Decreased burden of interviewers, more detailed results than from the survey solely, data consistent with mirror statistics.
Use case for AGRICULTURE Estimation of Agricultural statistics – pilot case study on crop types based on satellite data
Use case for AGRICULTURE Estimation of Agricultural statistics – pilot case study on crop types based on satellite data Responsibility: PL – coordinator, supported by IE. • • Data sources: Satellite images, administrative data, in situ surveys. Methodology: combining data – data fusion on radar and optical remote sensing data; data comparison with traditional surveys e. g. FSS; combining data – administrative data source s with satellite data. The goal of the case study: Crop type: look at the types of crops being grown and see if we can tell this accurately from the imagery; analysis of possibilities of using satellite images. Plan of Combining Datasets: Data fusion – combining data sources by spatial reference. Main benefits and value added for official statistics: Increase the quality of the agricultural surveys; Decrease of respondents burden; More detailed data published by official statistics; Potential decrease of the cost of conducting surveys.
a. nowicka@stat. gov. pl