Wouldnt it be great if Systematic Screening in

Wouldn’t it be great if … Systematic Screening in Ci 3 T Models Kathleen Lynne Lane, Ph. D. , BCBA-D, CF-L 1 University of Kansas

Wouldn’t it be great if … students could be detected at the first sign of concern?

Implementing Ci 3 T Models: A Respectful Partnership
 Tier 3 Tertiary")
Comprehensive, Integrated, Three-Tiered Model of Prevention (Lane, Kalberg, & Menzies, 2009) Tier 3 Tertiary Prevention (≈5%) Tier 2 Secondary Prevention (≈15%) Tier 1 Primary Prevention (≈80%) Academic Validated Curricula ◇ Behavioral PBIS Framework ◇ Social Validated Curricula

Thank you… For Your Commitment Internalizing Shift to a systems level perspective Externalizing ED <1% EBD 12 -20%

Social Validity Treatment Integrity Systematic Screening Academic Behavior

Student Risk Screening Scale for Internalizing and Externalizing (SRSS-IE; Drummond, 1994; Lane & Menzies, 2009) for Elementary Schools

Student Risk Screening Scale for Internalizing and Externalizing (SRSS-IE; Drummond, 1994; Lane & Menzies, 2009)

SRSS-IE: Cut Scores Elementary School SRSS-E 7 SRSS-I 5 Items 1 -7 Items 8 -12 Middle and High School SRSS-E 7 SRSS-I 6 Items 1 -7 Items 4, 8 -12 0 -3 = low risk 0 -1 = low risk 0 -3 = low risk 4 -8 = moderate risk 2 -3 = moderate risk 4 -8 = moderate risk 4 -5 = moderate risk 9 -21 = high risk 4 -15 = high risk 9 -21 = high risk 6 -18 = high risk Elementary School Level: Lane, K. L. , Oakes, W. P. , Swogger, E. D. , Schatschneider, C. , Menzies, H. , M. , & Sanchez, J. (2015). Student risk screening scale for internalizing and externalizing behaviors: Preliminary cut scores to support data-informed decision making. Behavioral Disorders, 40, 159 -170. Middle and High School Levels: Lane, K. L. , Oakes, W. P. , Cantwell, E. D. , Schatschneider, C. , Menzies, H. , Crittenden, M. , & Messenger, M. (2016). Student Risk Screening Scale for Internalizing and Externalizing Behaviors: Preliminary cut scores to support data-informed decision making in middle and high schools. Behavioral Disorders, 42(1), 271 -284
 Results – All")
Sample Elementary School Fall % of Students Screened SRSS-E 7 (externalizing) Results – All Students 100% 90% 80% 70% 60% 50% 40% 30% 20% 10% 0% 6. 93% N = 25 4. 56% N = 16 5. 25% N = 17 3. 96% N = 12 3. 79% N = 12 9. 97% 11. 88% 15. 77% 17. 59% 23. 82% N = 86 N = 35 N = 57 N = 36 N = 50 N = 250 69. 25% F 14 N = 300 85. 47% N = 250 77. 16% N = 255 84. 16% F 15 Screening Time Point F 16 F 17 Low Risk (0 -3) Moderate (4 -8) High (9 -21) N = 255 80. 44% F 18

Fall 2018 SRSS-Externalizing Results: Grade level Grade Level K 1 st 2 nd N Screened Low n (%) Moderate n (%) High n (%) 58 51 (87. 93%) 6 (10. 34%) 1 (1. 72%) 52 40 (76. 92%) 8 (15. 38%) 4 (7. 69%) 61 51 (83. 61%) 6 (9. 84%) 4 (6. 56%)
 Results – All")
Sample Elementary School Fall % of Students Screened SRSS-I 5 (internalizing) Results – All Students 100% 90% 80% 70% 60% 50% 40% 30% 20% 10% 0% N = 72 5. 41% N = 19 5. 56% N = 18 N = 32 7. 57% N = 24 10. 56% 19. 94% 12. 25% 13. 89% 14. 20% 13. 20% N = 85 N = 43 N = 45 N = 40 23. 55% N = 204 N = 289 82. 34% N = 261 80. 56% N = 231 76. 24% 78. 23% 56. 51% F 14 F 15 Screening Time Point F 16 F 17 Low Risk (0 -1) Moderate (2 -3) High (4 -15) F 18 N = 248

Student Risk Screening Scale Fall 2004 – 2012 Middle School 100% 6. 00 17. 00 3. 00 Low 2. 50 11. 00 Moderate High 0. 63 2. 34 7. 87 6. 29 1. 68 1. 34 2. 15 2. 40 7. 77 6. 11 3. 58 6. 35 Percentage of Students 80% 60% 91. 25 40% 77. 00 86. 50 Fall 2004 Fall 2005 Fall 2006 89. 79 93. 08 90. 55 92. 56 94. 28 20% 0% Fall 2007 Fall 2008 Fall 2009 Screening Time Point Fall 2010 Fall 2011 Fall 2012 Source: Lane, K. L. , Oakes, W. P. , & Magill, L. M. , (2014). Primary prevention efforts: How do we implement and monitor the Tier 1 component of our comprehensive, integrated, three-tiered model of prevention. Preventing School Failure, 58, 143 -158. doi: 10. 1080/1045988 X. 2014. 893978 [Figure 4. Middle school behavior screening data over time at the fall time point. Adapted from Figure 4. 6 p. 127 Lane, K. L. , Menzies, H. M, Oakes, W. P. , & Kalberg, J. R. (2012). Systematic screenings of behavior to support instruction: From preschool to high school. New York, NY: Guilford Press. ]

Middle School Study 1: Behavioral & Academic Characteristics of SRSS Risk Groups Variable Risk Low (n = 422) M (SD) Moderate (n = 51) M (SD) High (n = 12) M (SD) ODR 1. 50 (2. 85) 5. 02 (5. 32) 8. 42 (7. 01) L<M<H In-School Suspensions 0. 08 (0. 38) 0. 35 (1. 04) 1. 71 (2. 26) L<M<H GPA 3. 35 (0. 52) 2. 63 (0. 65) 2. 32 (0. 59) L>M, H M=H Course Failures 0. 68 (1. 50) 2. 78 (3. 46) 4. 17 (3. 49) L<M, H M=H (Lane, Parks, Kalberg, & Carter, 2007) Significance Testing

Screening Data: High School Yrs 1 -3 Fall- SRSSIE-I Low 2016 Moderate High Fall- SRSSIE-E Low 80. 28% 10. 36% 9. 36% 2016 89. 56% 8. 02% 2. 42% 2017 90. 18% 4. 16% 5. 66% 2017 91. 29% 6. 18% 2. 54% 2018 90. 91% 3. 86% 5. 23% 2018 92. 22% 6. 20% 1. 58% WTR-SRSSIE-I Low WTR-SRSSIE-E Low 2016 87. 25% 9. 49% 3. 26% 2017 86. 14% 9. 02% 4. 85% 2018 88. 79% 8. 52% 2. 69% Moderate High

www. ci 3 t. org

Wouldn’t it be great if … each school had a comprehensive, integrated, three-tiered model to meet students’ multiple needs?
 Tier 3 Tertiary")
Comprehensive, Integrated, Three-Tiered Model of Prevention (Lane, Kalberg, & Menzies, 2009) Tier 3 Tertiary Prevention (≈5%) Tier 2 Secondary Prevention (≈15%) Tier 1 Primary Prevention (≈80%) Academic Validated Curricula ◇ Behavioral PBIS Framework ◇ Social Validated Curricula

Practitioner University Partnership … Ci 3 T Training & Implementation Phase Year 2013 -14 14 -15 Elementary School Ci 3 T Training Implementation Year 1 Implementation Year 2 Sustain and Develop Practices Middle and High Schools Ci 3 T Training Implementation Year 1 Implementation Year 2 Sustain and Develop Practices College and Career Center Ci 3 T Training Implementation Year 1 Implementation Year 2 Sustain and Develop Practices 15 -16 16 -17 17 -18 18 -19 19 -20

Ci 3 T Primary Plan: Roles and Responsibilities all stakeholder groups

g n i h c a e T r o f s e r u d e c o r P : n a l P y r a Ci 3 T Prim ary Plan: P rocedures f or Reinforc ing Ci 3 g n i r o t i n o M r o f s e r u d e c o r P : n a l P y r a T Prim

Low-Intensity Strategies Opportunities to Respond Behavior Specific Praise Active Supervision Instructional Feedback Self-monitoring High p Requests Precorrection Incorporating Choice Behavior Contracts

Planning for an integrated approach
 Tier 3 Tertiary")
Comprehensive, Integrated, Three-Tiered Model of Prevention (Lane, Kalberg, & Menzies, 2009) Tier 3 Tertiary Prevention (≈5%) Tier 2 Secondary Prevention (≈15%) Tier 1 Primary Prevention (≈80%) Academic Validated Curricula ◇ Behavioral PBIS Framework ◇ Social Validated Curricula
 Tier 3 Tertiary")
Comprehensive, Integrated, Three-Tiered Model of Prevention (Lane, Kalberg, & Menzies, 2009) Tier 3 Tertiary Prevention (≈5%) Tier 2 Secondary Prevention (≈15%) Secondary (Tier 2) Intervention Grids Tier 1 Primary Prevention (≈80%) Academic Validated Curricula ◇ Behavioral PBIS Framework ◇ Social Validated Curricula
 or Daily Behavior Report Card")
Sample Elementary Intervention Grid Support Direct Behavior Rating (DBR) or Daily Behavior Report Card (DBRC) Description School-wide Data: Entry Criteria Behavior DBR is typically completed daily following specified observation period(s) (e. g. , math intervention; ELA core instruction). The most appropriate rater is a person who can directly observe the student during the observation period, typically the teacher. DBR is used to monitor specific behaviors identified as relevant for the student and setting. For example, many DBRs monitor academic engagement, respect, and disruption as core school based behavioral competencies, and may adapt or add a behavior based on the student’s specific needs. After each observation period, the rater uses the provided scale to indicate the degree to which the student displayed each behavior. When used as part of a Tier 2 intervention, the rater reminds the students of the expected behaviors prior beginning the observation. At the conclusion of each observation, the rater uses the provided scale to indicate the degree to which the student displayed each behavior. The rater meets briefly with the student to share the DBR rating, providing behavior specific praise and instructional feedback. Home-school communication procedures may be established (e. g. , information is shared with parent/caregiver daily, with return acknowledgement and possible home consequences). Data to Monitor Exit Criteria Progress Student measures Student goals Direct Behavior met for 10 -12 SRSS-E 7 score: Rating (DBR; daily) weeks (team Moderate (4 -8) and/or review of SRSS-I 5 score: Social validity progress to Moderate (2 -3) Teacher: IRP-15 determine) Student: DBR AND Student Social SRSS-E 7 and Evidence of teacher Validity I 5 scores are implementation of form/interview in the low risk Ci 3 T primary (Tier 1) category plan [treatment Treatment integrity: direct DBR treatment observation] integrity measure AND Parent permission, in accordance with district policy
 Tier 3 Tertiary")
Comprehensive, Integrated, Three-Tiered Model of Prevention (Lane, Kalberg, & Menzies, 2009) Tier 3 Tertiary Prevention (≈5%) Tier 2 Tertiary (Tier 3) Intervention Grids Secondary Prevention (≈15%) Tier 1 Primary Prevention (≈80%) Academic Validated Curricula ◇ Behavioral PBIS Framework ◇ Social Validated Curricula
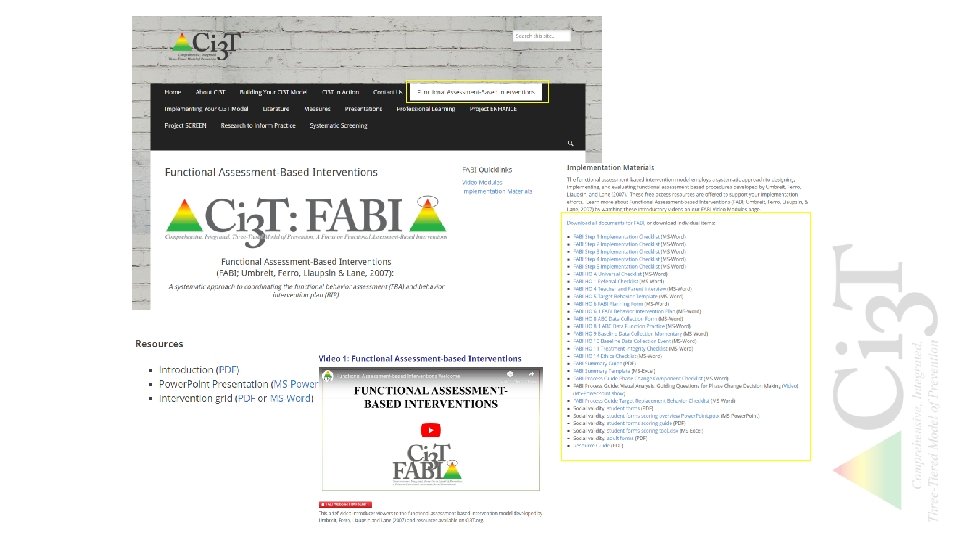
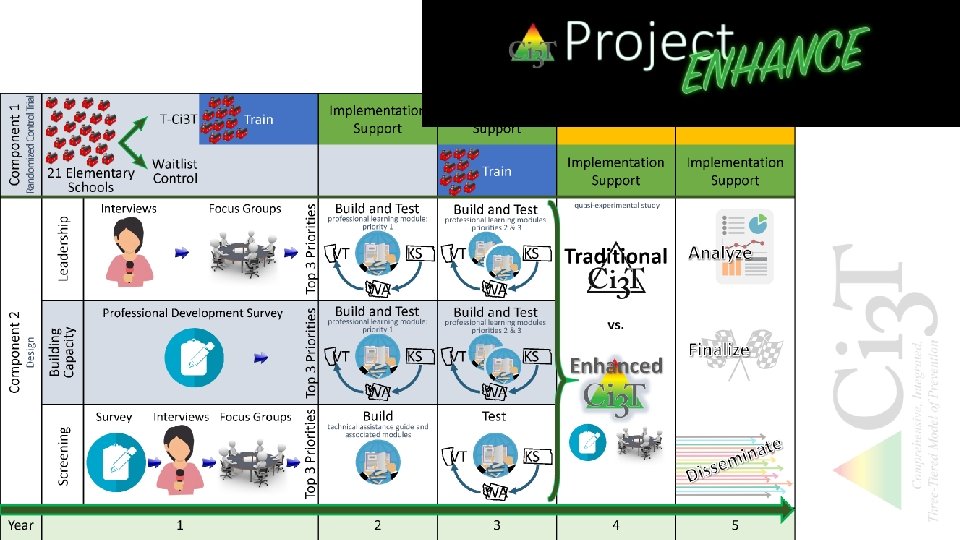

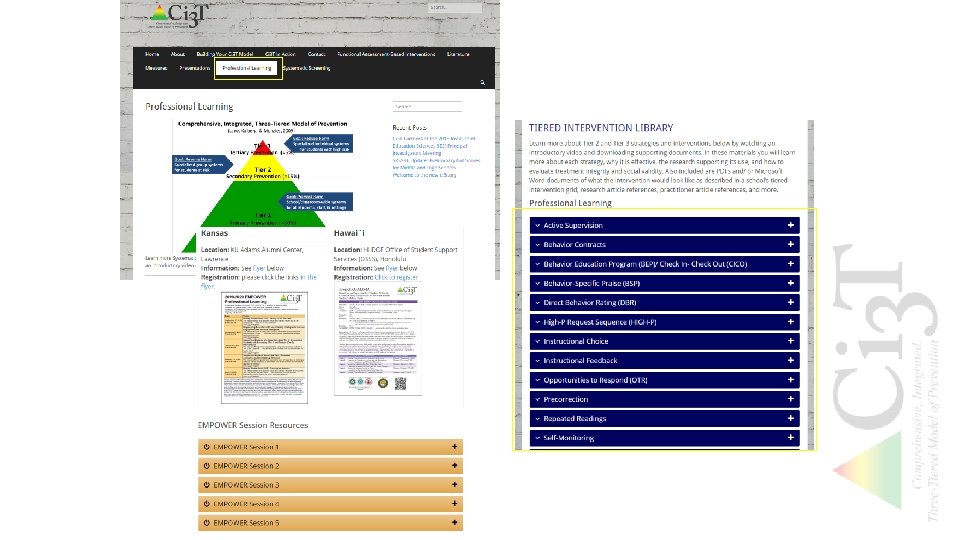
Project ENHANCE Overview

Project ENHANCE Overview

Project ENHANCE Overview

Project ENHANCE Overview

Project ENHANCE Overview

Project ENHANCE Overview

www. ci 3 t. org
- Slides: 39