World Population Connection Video 1 In approximately what


 1 AD 200 400 600 800 1000 1100 1200 1300 1400")


 is the percentage")
 is the total")
 is the number")
 is the number")

 is the total")


- Slides: 28
World Population Connection
Video 1. In approximately what year did 2. Were there any points in the film 3. you In which begin time to notice period a large did the most 4. Are there any areas of the 5. when Won’t in science and youadvances noticed slight decreases in population growth occur? During increase in population growth? population? Ifenable so, in what part(s) of the technology our planet world which are likely toto What time historical period, events, which scientific parts of the world did you notice decreasing accommodate a growing remain relatively advances world experienced or societal the changes most at population? What historical events in population? unpopulated by that time have growth? those timeperiodsmay maythe haveyear contributed totothe population contributed that population 2030? Why would this be decreases? growth? so?
Year Population (millions) 1 AD 200 400 600 800 1000 1100 1200 1300 1400 1500 1600 1750 1800 1850 1900 1950 2000 2050 170 190 200 220 265 320 360 350 425 545 610 760 900 1, 211 1, 625 2, 515 6, 073 9, 539 Graph the Data Year = X axis Population = Y axis (I suggest doing in billions) What kind of graph do you get? J-curve = reveals exponential growth
Population Riddles ALily father complained that his son’s allowance pads have started to grow in a of $5 per week was too much. The son replied, 40 -acre pond. The pads double in “Okay, Dad. How about this? You give me a size for each dayday and willmonth, take 40 days penny the first of the 2 cents for tonext, cover the entire pond. On for which the 4 cents for the next, 8 cents the next, on for every day ofexactly the month. ” dayand willsothe pads cover half The father readily consented. Who was the of the pond? more clever? What would the son’s allowance be on day 31? $ 10, 737, 418. 24 Day 39
Earth: The Apple of our Eye • 3/4 represents the oceans • 1/8 represents inhospitable land (desert, swamp, polar, high elev. ) – Leaves 1/8 for people to live • 3/32 for areas too rocky, too wet, too cold, or poor soil to actually produce food; also cities, urban sprawl, etc. • Peel represents actual top soil – 25 billion tons/yr lost to erosion & over farming Nat. Geo: 7 Billion
Population Explosion • Earth is finite = all environments have a carrying capacity – Pop. growth cannot continue indefinitely – Can expand capacity with technology & $$ • Ex: Japan ( capacity, land) – Limited by system’s ability to renew itself and/or safely absorb wastes • Critics of “we are overpopulated” say we can fit entire global population into state of Texas – BUT could the land actually sustain all these people? Will we have the tech. in time?
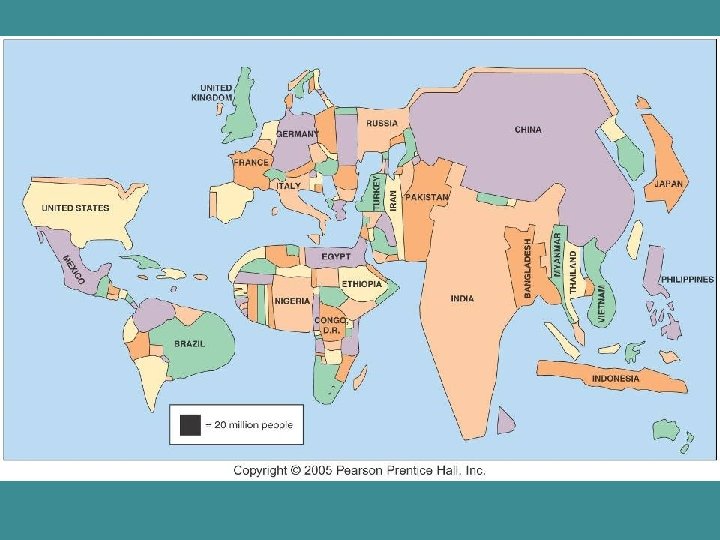
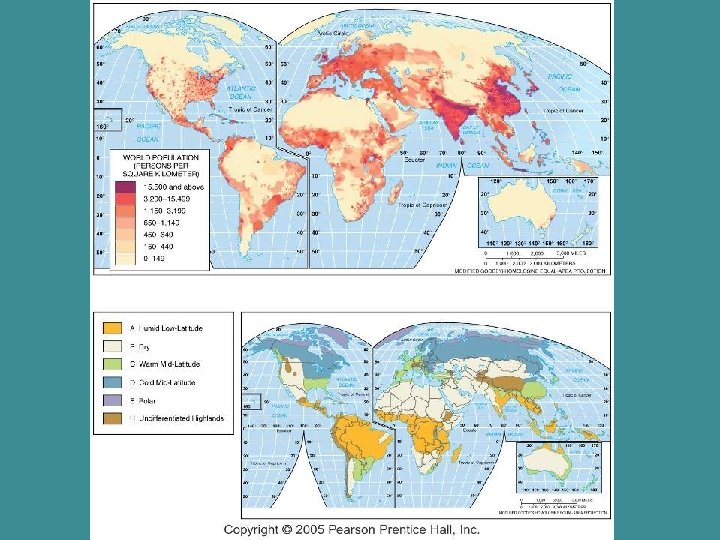
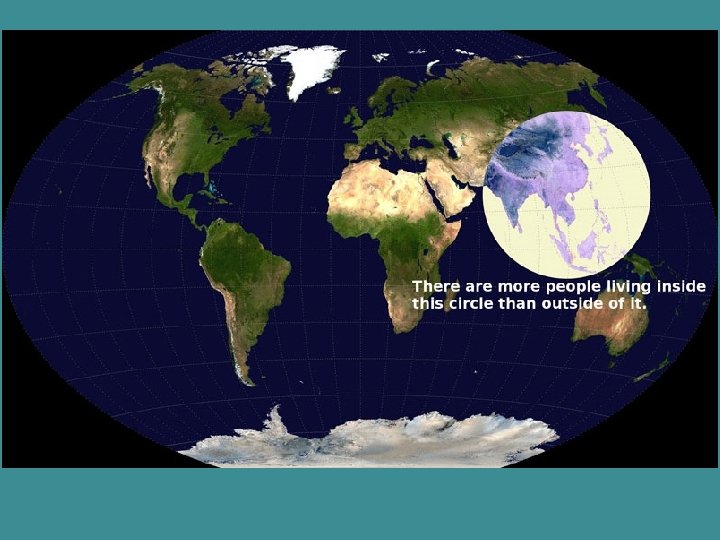
Population Distribution • What regions of the world have the 5 main population clusters? – East Asia, Southeast Asia, Europe – NE US/ SE Canada & West Africa • What regions of the world are sparsely populated? (5 too’s) – Deserts, rainforests, polar areas, high elevations Nat Geo: Are You Typical?
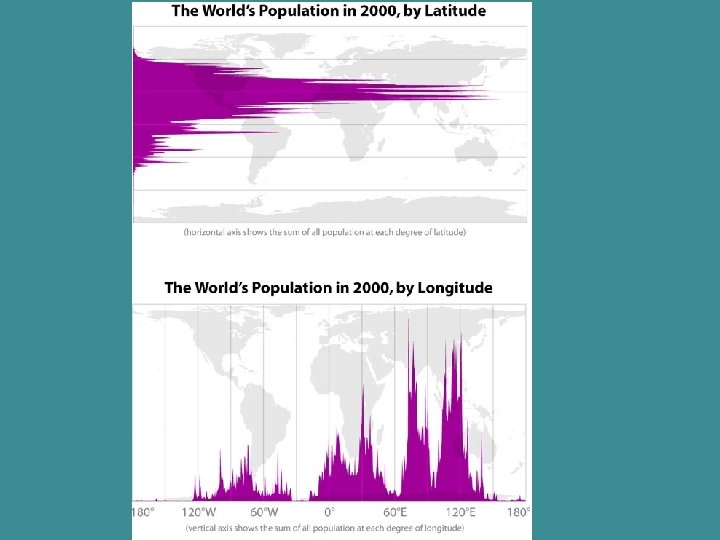
Population Distribution • 90% live N of Equator – Land distribution is a factor • 1/2 live on 5% of land; or 9/10 on less than 20% – Over half now in cities • Most live close to sea level – Most arable land, closest to waterways • 2/3 live w/in 300 miles of ocean
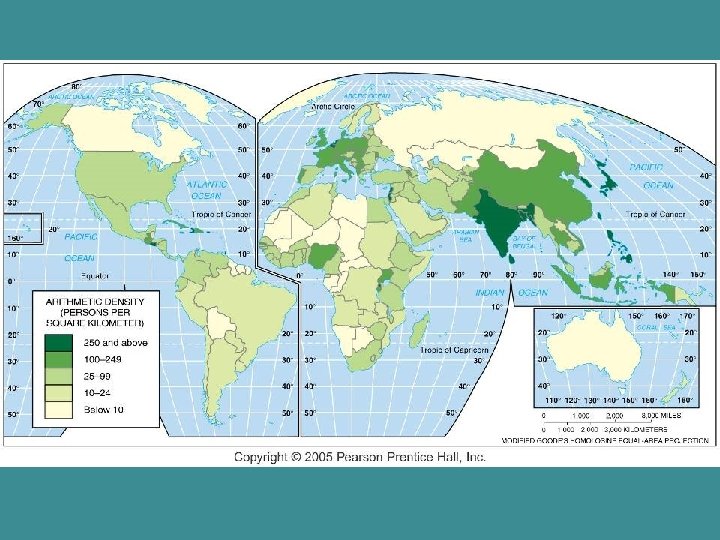
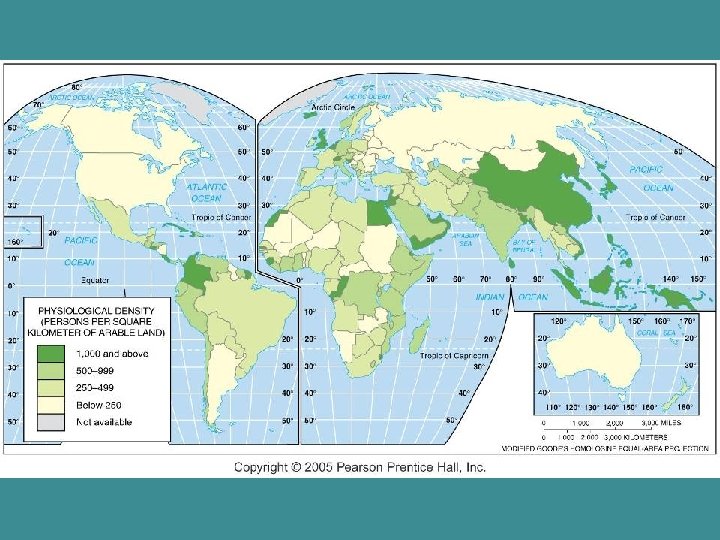
Densities • Arithmetic – Total population/ total land area – Compares # of ppl trying to live in an area • Physiological – Total population/ total arable land area – the p. d. , the pressure on land • The difference b/w the two can indicate capacity to meet needs
Densities • Agricultural – Total # of farmers/ total arable land area – Can indicate economic differences • MDC’s have low ag. dens b/c of better technology work more in service industry • Comparing Densities – See Table 2 -1 (pg 53)
Population of the world split into equal sections of one billion.
Natural Increase Rates Fig. 2 -10: The natural increase rate (NIR) is the percentage growth or decline in the population of a country per year (not including net migration). Countries in Africa and Southwest Asia have the highest current rates, while Russia and some European countries have negative rates.
Crude Birth Rates Fig. 2 -11: The crude birth rate (CBR) is the total number of births in a country per 1, 000 population per year. The lowest rates are in Europe, and the highest rates are in Africa and several Asian countries.
Total Fertility Rates Fig. 2 -12: The total fertility rate (TFR) is the number of children an average woman in a society will have through her childbearing years. The lowest rates are in Europe, and the highest are in Africa and parts of the Middle East.
Infant Mortality Rates Fig. 2 -39: The infant mortality rate (IMR) is the number of infant deaths per 1, 000 live births per year. The highest infant mortality rates are found in some of the poorest countries of Africa and Asia.
Life Expectancy at birth Fig. 2 -11: Life expectancy at birth is the average number of years a newborn infant can expect to live. The highest life expectancies are generally in the wealthiest countries, and the lowest in the poorest countries.
Crude Death Rates Fig. 2 -12: The crude death rate (CDR) is the total number of deaths in a country per 1, 000 population per year. Because wealthy countries are in a late stage of the demographic transition, they often have a higher CDR than poorer countries.
Baby-O-Matic • Family Life: status of woman in household, ability to make decisions • Education: More educ = fewer children, esp. for women • Social Security: need more kids if no way to support themselves in old age • Status Symbol: Large families can be seen as impt to culture; others, it’s personal success
Baby-O-Matic • Time & $ Management: children are a drain on parents in some areas; an economic asset in others • Health: with high chance of IM, ppl will have more kids as “insurance” • Personal Beliefs: Society says if lg. or sm. is good; what shape is society in? • Timing: Longer you wait = fewer kids; career minded ppl have fewer kids
PRB Data Sheets • Place regional averages in the boxes • List the most developed and least developed countries at the bottom be prepared to justify your choices
WORLD DATA • More Devel: – IMF= 5 – <15= 16% LE= 78 NIR= 0. 1% 65+= 16% GNI PPP= $33, 460 • Less Devel 1: – IMF= 45 – <15= 29% LE= 68 65+= 6% NIR= 1. 4% GNI PPP= $5, 900 • Less Devel 2: – IMF= 49 – <15= 32% LE= 66 65+= 5% NIR= 1. 7% GNI PPP= $5, 380 LE= 59 65+= 3% NIR= 2. 4% GNI PPP= $1, 440 • Least Devel: – IMF= 72 – <15= 41%
Population Reference Bureau • Go to www. prb. org and explore! There are various areas to get information from • Might be best to download the 2013 Data Sheet as a PDF • Answer the questions provided to get a sense of regional patterns.