World Oil Production Trend How U S Shale


 Low natural gas price 2) Technology")


- Slides: 53
World Oil Production Trend: How U. S. Shale Oil Production Changes the Trend
Oil Price 1. 2. 3. 4. 5. 6. 7. A play Hubbert curve Technology Examples Lambda Hubbert Curve Lambda Hubbert Change Price Forecast
1. A Play
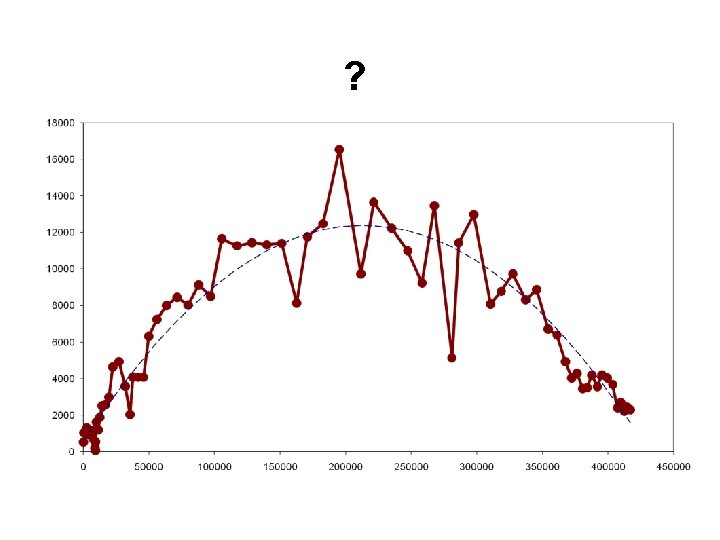
What is this?
This is Haynesville It is the number of rigs
Why is the rig count going down? 1) Low natural gas price 2) Technology 3) Depletion
This suggests: Shale can have quick peaks and declines
2. Hubbert is a trend
Discovery and Production Discovery Hubbert Curve Discovery, Production T 0 T 1 T 2 Time Production Hubbert Curve
US Lower 48 Production over time, up to 2005
CQ Hubbert Curve CQ Quadratic Hubbert Curve 0 URR Time CQD URR 0 Cumulative Hubbert Curve Time
Quadratic Hubbert Curve Based on Geological MAXIMUM Supply Production 0 URR Cumulative Production
US Lower 48 Production versus cumulative production, up to 2005
US Lower 48 Production over time, up to 2005
3. Technology
US Technology 2005
4. Examples of Hubbert and Technology
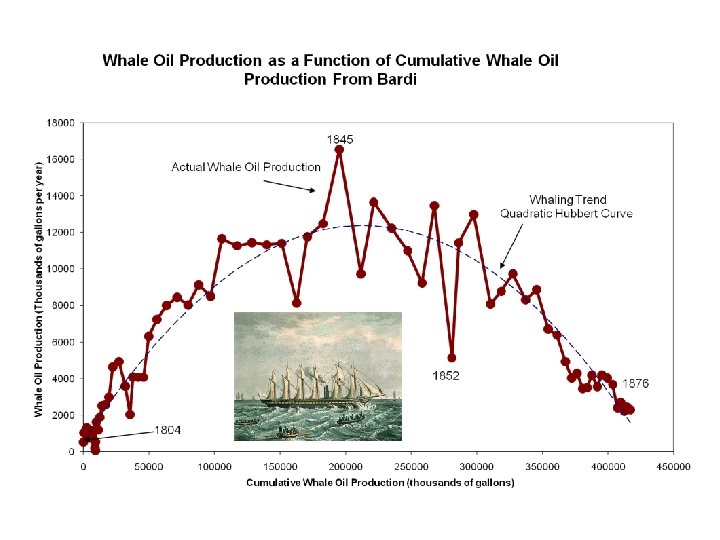
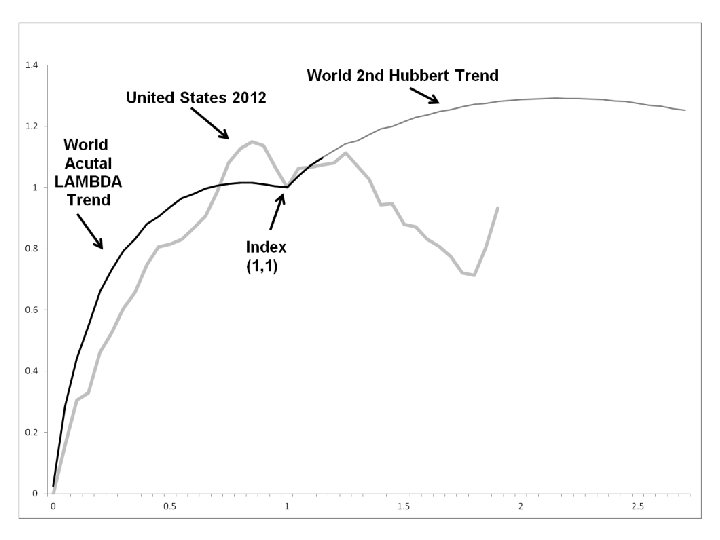
What is this?
It is the US
This is the US on Steroids
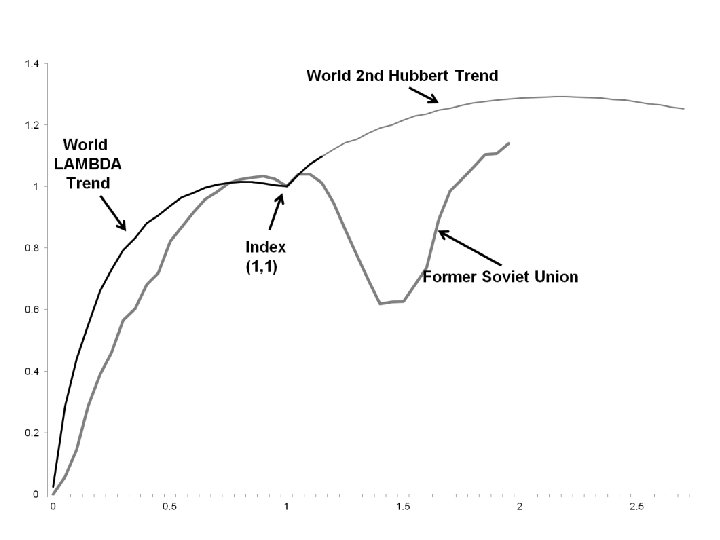
What is this?
This is the Soviet Union
This is the Soviet Union on Steroids
5. Lambda Hubbert Risk aversion
Quadratic Hubbert Curve Based on Geological MAXIMUM Supply Production 0 URR Cumulative Production
Quadratic Hubbert Curve Production Hubbert Curve Based on Path of Actual Oil Geological Maximum Supply Production Paths of potential oil production expansion 0 URR Cumulative Production
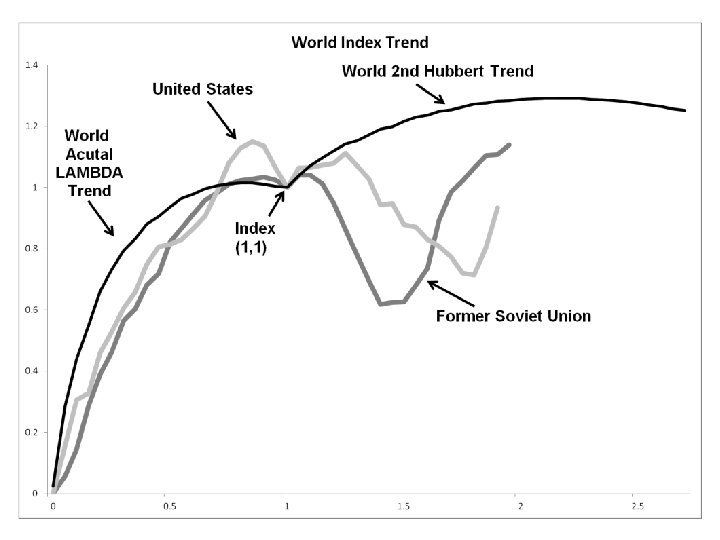
Venezuela and US 2005 Indexed Hubbert Curve
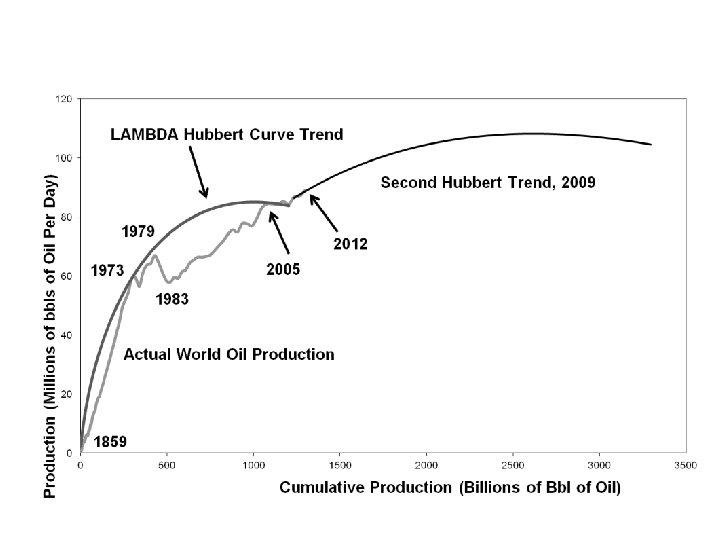
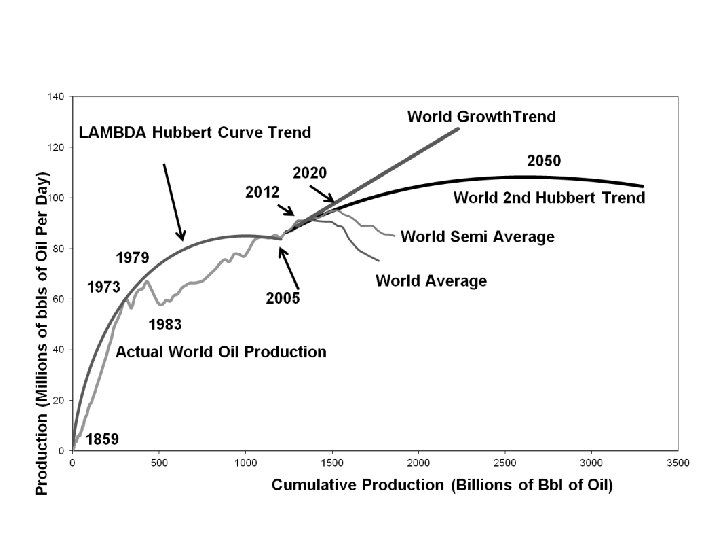
World Lambda Hubbert Curve 2009
World Normal and Lambda Hubbert Curve 2009
World Lambda Hubbert Curve 2009
Normal Quadratic Hubbert Curve Equation Lambda Hubbert Curve Equation QP = b 1 * CQP + b 2 * CQP 1+λ
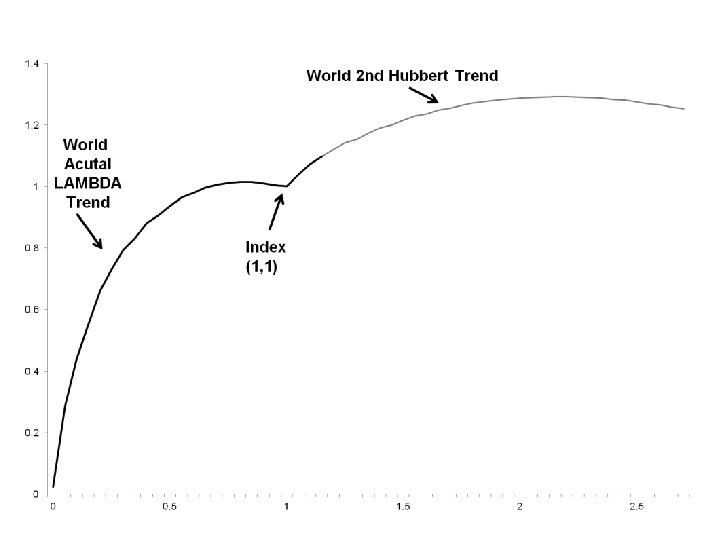
World Lambda Hubbert Curve 2009
World Lambda Hubbert Curve 2009
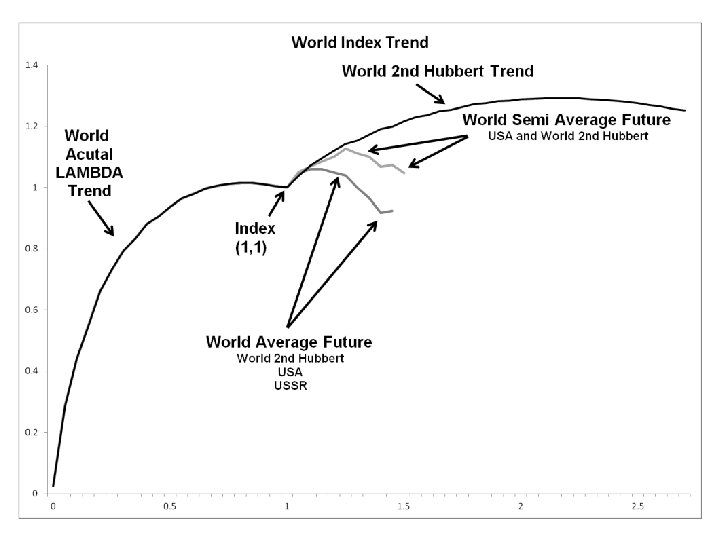
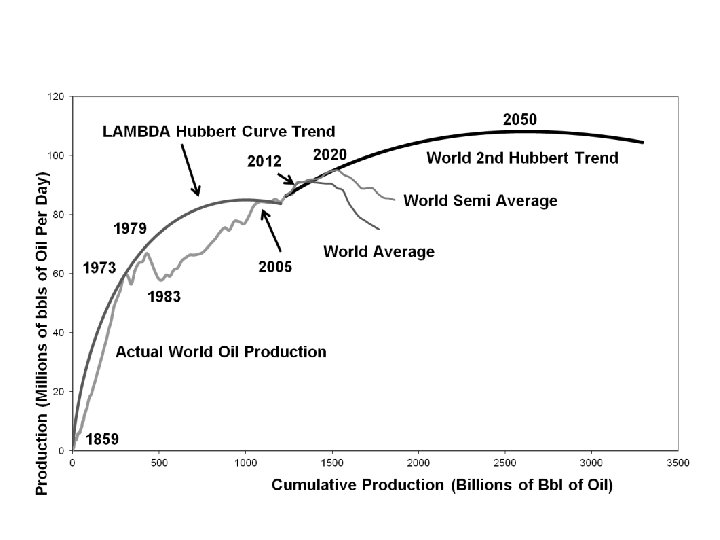
World Lambda Hubbert Multi-Curve 2012
World Lambda Hubbert Multi-Curve 2012
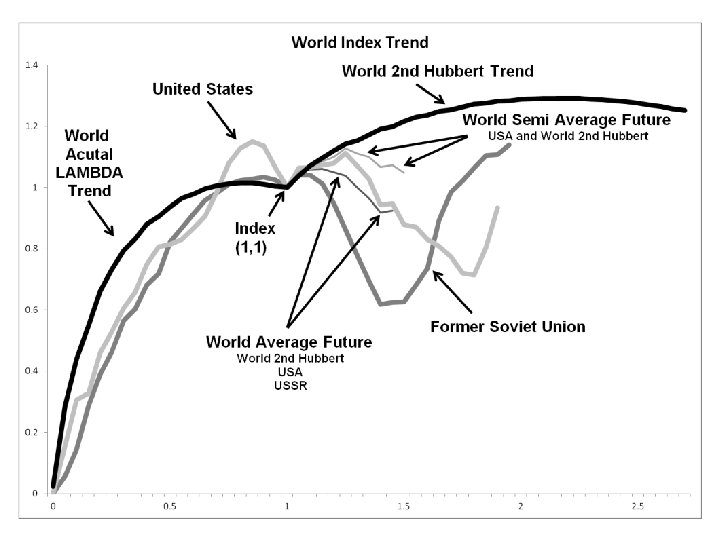
6. Lambda Hubbert Change Forecast
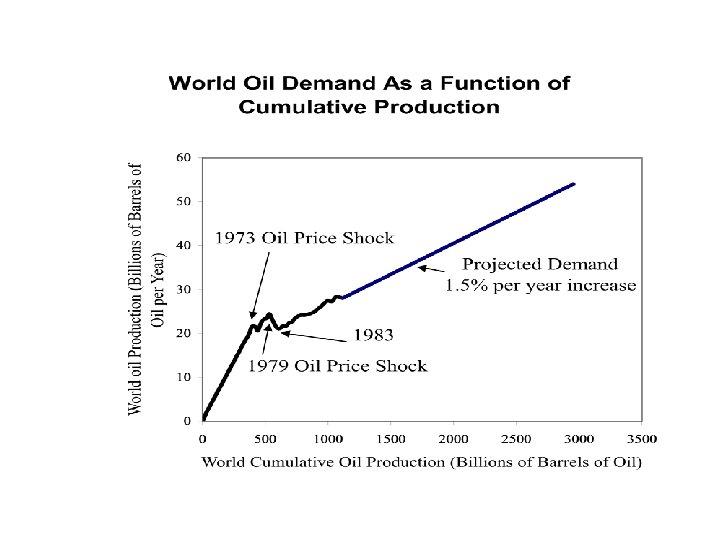
7. Price Forecasts Consolidating TRENDS
Conclusion 1. 2. 3. 4. Hubbert, Hubbert. Lambda Hubbert Multi-cycle Lambda Hubbert Looking at history shows: 2 nd cycles often short
5. World economy is hanging in the balance 6. A price shock can come at any time We are still in an Energy Crisis