World Happiness Report 2019 CoEditors Associate Editors John


 Social support")


 Negative Affect 0, 30 0,")


 Independent Variable")
 0, 1 0, 081 0, 068 0,")
 including inequality of well-being 0, 1 0,")
 including inequality of")
 including inequality of well-being")


- Slides: 32
World Happiness Report 2019 Co-Editors: Associate Editors: John F. Helliwell, Richard Layard, Jeffrey D. Sachs Jan-Emmanuel De Neve, Haifang Huang, Shun Wang, and Lara B. Aknin TABLE OF CONTENTS 1. Happiness and Community: An Overview John F. Helliwell, Richard Layard and Jeffrey D. Sachs 2. Changing World Happiness John F. Helliwell, Haifang Huang and Shun Wang 3. Happiness and Voting Behaviour George Ward 4. Happiness and Prosocial Behavior: An Lara B. Aknin, Ashley V. Whillans, Michael I. Norton Evaluation of the Evidence and Elizabeth W. Dunn 5. The Sad State of Happiness in the United Jean M. Twenge States and the Role of Digital Media 6. Big Data and Well-being Clément Bellet and Paul Frijters 7. Addiction and Unhappiness in America Jeffrey D. Sachs
Happiness Measures • Life Evaluations: Cantril Ladder Ø Respondents’ assessment of their current life based on an 11 -point scale whereby 0 designates one’s worst possible life and 10 denotes the best possible life respondents can imagine for themselves • Positive Affect Ø The average of previous-day affect measures for happiness, laughter, and enjoyment • Negative Affect Ø The average of previous-day affect measures for worry, sadness, and anger
Measurement using Life Evaluations • Provides a single umbrella measure of welfare with inherent reality • Enables research on the determinants of better lives • Error bands show relevance of differences across countries and sub-groups • Supports cost/benefit analysis with a wellbeing focus
Six Supports for Better Lives • • Material support (GDP per capita) Social support (someone to count on) Healthy Life Expectancy Freedom (to make life choices) Generosity (giving, and more. . ) Trust (freedom from corruption, plus. . ) No 7? Inequality of happiness matters
The Global Trajectory of Life Evaluations 5, 7 5, 6 5, 5 5, 4 5, 3 5, 2 5, 1 5, 0 2006 2007 2008 2009 2010 2011 2012 2013 2014 2015 Population weighted (excluding top 5 largest countries) Non-population weighted 2016 2017 2018
Life Evaluations in the Five Largest Countries 8 7 6 5 4 3 2006 2007 2008 2009 China 2010 India 2011 2012 Indonesia 2013 Russia 2014 2015 2016 United States 2017 2018
Global Trajectories of Positive and Negative Affect (blue=pop weighted) Negative Affect 0, 30 0, 76 0, 28 0, 74 0, 26 0, 72 0, 24 0, 70 0, 22 0, 68 0, 20 2006 2007 2008 2009 2010 2011 2012 2013 2014 2015 2016 2017 2018 0, 78 2006 2007 2008 2009 2010 2011 2012 2013 2014 2015 2016 2017 2018 Positive Affect
0, 27 0, 42 0, 24 0, 39 0, 21 0, 36 0, 18 0, 33 0, 15 0, 3 Anger 20 20 20 Sadness 06 0, 45 06 20 07 20 08 20 09 20 10 20 11 20 12 20 13 20 14 20 15 20 16 20 17 20 18 0, 3 07 20 08 20 09 20 10 20 11 20 12 20 13 20 14 20 15 20 16 20 17 20 18 Sources of Global Negative Affect over Time Worry
Happiness Rankings Top and Bottom 10 2016 -2018
Table 2. 1: Regressions to Explain Average Happiness across Countries (Pooled OLS) Independent Variable Log GDP per capita Social support Healthy life expectancy at birth Freedom to make life choices Generosity Perceptions of corruption Positive affect Cantril Ladder (0 -10) 0. 318 (0. 066)*** 2. 422 (0. 381)*** 0. 033 (0. 01)*** 1. 164 (0. 3)*** 0. 635 (0. 277)** -. 540 (0. 294)* Dependent Variable Positive Affect Negative Affect (0 -1) -. 011 0. 008 (0. 01) (0. 008) 0. 253 -. 313 (0. 05)*** (0. 051)*** 0. 001 0. 002 (0. 001) 0. 352 -. 072 (0. 04)*** (0. 041)* 0. 137 0. 008 (0. 03)*** (0. 028) 0. 025 0. 094 (0. 027) (0. 024)*** Negative affect Year fixed effects Number of countries Number of obs. Adjusted R-squared Included 157 1, 516 0. 74 Included 157 1, 513 0. 476 Included 157 1, 515 0. 27 Cantril Ladder (0 -10) 0. 338 (0. 065)*** 1. 977 (0. 397)*** 0. 03 (0. 01)*** 0. 461 (0. 287) 0. 351 (0. 279) -. 612 (0. 287)** 2. 063 (0. 384)*** 0. 242 (0. 429) Included 157 1, 512 0. 76
Comparing United States to Canada (-0. 387) 0, 1 0, 081 0, 068 0, 05 0 -0, 05 -0, 048 -0, 15 -0, 2 -0, 137 -0, 165 GDP per capita Social support Healthy life expectancy Freedom to make life choices -0, 182 Generosity Perceptions of corruption Residual
Comparing United States to Canada (-0. 387) including inequality of well-being 0, 1 0, 066 0, 065 0, 05 0 -0, 05 -0, 015 -0, 042 -0, 15 -0, 149 -0, 134 -0, 173 -0, 2 P 75/P 25 ratio GDP per capita Social support Healthy life Freedom to Generosity Perceptions expectancy make life of corruption choices Residual
Changes in United States: 2005 -08 ~ 2016 -18 (-0. 432) including inequality of well-being 0, 05 0 0, 021 0, 005 -0, 004 -0, 05 -0, 045 -0, 039 -0, 080 -0, 109 -0, 15 -0, 2 P 75/P 25 ratio GDP per capita Social support Healthy life Freedom to Generosity Perceptions expectancy make life of corruption choices -0, 182 Residual
Changes in Canada: 2005 -08 ~ 2016 -18 (-0. 183) including inequality of well-being 0, 08 0, 054 -0, 027 0, 019 0, 03 -0, 004 -0, 018 -0, 049 -0, 07 -0, 059 -0, 12 -0, 17 P 75/P 25 ratio GDP per capita Social support Healthy life Freedom to Generosity Perceptions expectancy make life of corruption choices -0, 153 Residual
Explaining average happiness across and within countries with inequality Log GDP per capita Social support Healthy life expectancy at birth Freedom to make life choices Generosity Perceptions of corruption (1) ***0. 328 (0. 065) ***2. 473 (0. 374) ***0. 031 (0. 009) ***1. 018 (0. 282) **0. 684 (0. 274) -*0. 550 (0. 288) (2) ***0. 934 (0. 209) ***1. 421 (0. 333) -***0. 041 (0. 012) ***0. 784 (0. 200) **0. 384 (0. 189) -**0. 549 (0. 230) P 75/P 25 Country fixed effects Observations Adj. R 2 Within R 2 1, 516 0. 735 X 1, 516 0. 902 0. 154 )3( ***0. 308 (0. 063) ***2. 099 (0. 389) ***0. 029 (0. 009) ***1. 067 (0. 261) **0. 641 (0. 270) -*0. 517 (0. 290) )4( ***0. 821 (0. 203) ***1. 044 (0. 331) -0. 017 (0. 011) ***0. 788 (0. 196) **0. 451 (0. 186) -**0. 543 (0. 223) -***0. 247 (0. 066) -***0. 177 (0. 055) X 1, 516 0. 907 0. 192 1, 516 0. 75
Research results show • Importance of the social context • People happiest where they know, trust, help and enjoy each other • People happier where equality of wellbeing is less • The disadvantaged gain most from living in a high trust environment and where happiness inequality is less
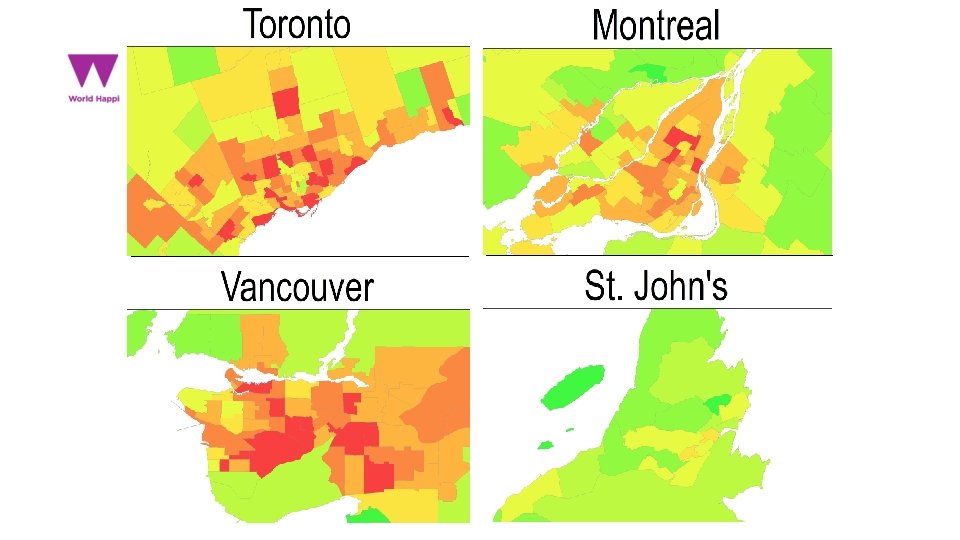
Standard Deviations 0, 9 Community Belonging Matters Canadian Urban and Rural Communities Compared 0, 6 0, 3 0 -0, 3 -0, 6 Urban Mean Life Satisfaction Rural Sense of Mean Household Belonging to Income Local Community
Kindness matters: Life Satisfaction by expected wallet return by neighbour and sense of community belonging 8, 3 8, 4 7, 9 8 7, 6 7, 2 6, 8 Low both: n=11 K High wallet, High belonging, low belonging: low wallet: n=5 K n=25 K High both: n=27 K
Geography matters: Expected wallet return by urban and rural neighbours 70% 61, 0% 60% 50% 41, 4% 40% 31, 1% 30% 20% 10% 42, 7% 15, 9% 7, 9% 0% Not likely Somewhat likely Urban Rural Very likely
But urban strangers are much kinder than you think
Age Matters: SWL effects of community belonging are greater at higher ages Satisfaction with life difference within each age group and the youngest age group in the model with controls, by belonging in CCHS 1 0, 8 0, 6 0, 4 0, 2 0 -0, 2 -0, 4 -0, 6 -0, 8 -1 20 -24 25 -29 30 -34 35 -39 40 -44 45 -49 Weak sense of belonging 50 -54 55 -59 60 -64 65 -69 70 -74 75 -79 Strong sense of belonging 80+
Migration matters: moving to Canada and the UK from 70 countries
SWL Convergence of Immigrants from North America, W. Europe and Oceania
Adding immigrants from Latin America and the Caribbean
and Southern and Eastern Europe
and East and Southeast Asia
and Africa
Sustainable happiness requires • Ensuring that today’s activities improve tomorrow’s possibilities • Paying more attention to the distribution of happiness • Building trust to support resilience • Broadening social identities to create a sense of ‘we’ covering other places, nations, and generations
To get there requires • • • Measuring subjective well-being in all major social and health surveys. Statistics Canada now does this, extensions needed in coverage for indigenous and labour market surveys, etc. Monitoring subjective well-being before, during and after policy interventions. The Social Research and Demonstration Corporation (SRDC) now does this for all its evaluations, and the Office of Literacy and Essential Skills (OLES), a key program branch at Employment and Social Development Canada (ESDC) has just done the same.