World Bank Experience in the Privatization Process Presented

World Bank Experience in the Privatization Process Presented at the Water Policy in the Americas Roundtable 21 September 2000 by Ventura Bengoechea

Outline l l l l Situation Circa 1990 Reform Process in LAC The Role of the WB Achievements Unfinished Agenda Challenges Ahead Learning from Real Cases

Situation circa 1990 Politicians Fiscal Transfers Utility Officials Serve Political Agenda Environmental Degradation Employment Agency Staff Public Utility (Over-staffing) Poor Services Low Tariffs Bad perception Difficult Graphic adapted from V. Foster Population Connected Population w/o Connection Increasing High Tariffs Bad Quality

PSP in Water circa 1990 Service Contracts Austria Chile Germany USA Managmt. Contracts France 1990 Lease Guinea France Spain Poland Concession BOO BOT Divestiture Cote d’Ivoire France Spain USA UK

The Reform Process Politicians Sector Strategy Regulators Tariffs & Service Quality Regulation Environmental Improvements Efficient Service Staff Private/Public Utility Good Services Graphic adapted from V. Foster Adequate Tariffs More Population Connected Incentives for Connections Population w/o Connect.

The Role of the WB l l l Advise on Reform Issues Dissemination of Best Practices Study Tours for Policy Makers as well as Labor Unions Financing of Transaction Advisers TA and Training for Regulators Financing and Equity to the PS

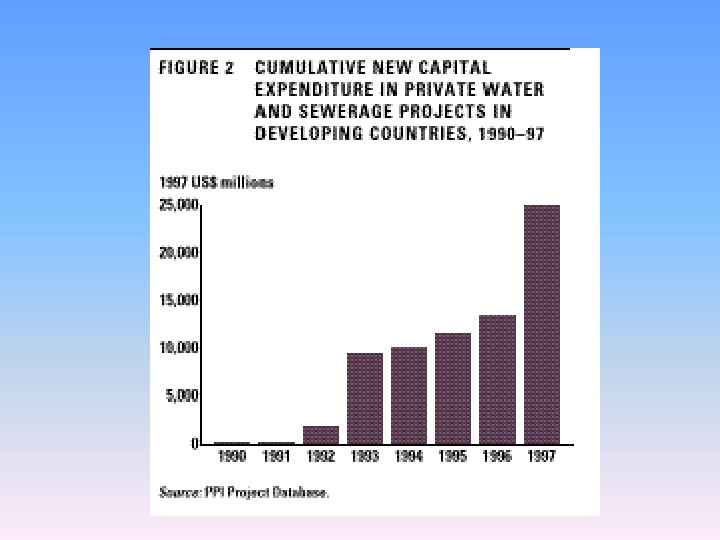
Achievements through PSP l l l Water Service Improvements Increased W&S Coverage Cash Flow Generation & Financing Increase in Sector Investments Customer Attention

Service Contracts Austria Chile Costa Rica Germany India Mexico Russian F. Tunisia USA Venezuela Algeria Bangladesh Burkina Managmt. Contracts France West Bank, Gaza Puerto Rico Trinidad USA Venezuela Jordan Georgia Armenia Kazakhstan Nepal 2000 Lease Colombia Cote d’Ivoire Czech Rep Hungary Guinea France Mozambique Poland Senegal Spain Ghana Guinea-Bissau Niger Tanzania Concession BOO BOT Divestiture Argentina Australia Bolivia Brazil China Colombia France Gabon Germany Indonesia Honduras Mexico Malaysia Morocco Peru Philippines Slovenia South Africa Spain Thailand Turkey Uruguay USA Vietnam Greece Guyana Lebanon Jordan Lithuania Nicaragua Nigeria Panama Paraguay Tunisia India Chile Germany (min) UK USA Thailand signed proposed

A Prospective View for Latin America Investments through 2015 US$100 Billion or US$6 -7 B/yr Expected by Year 2030 Technological Changes. . . Private Sector’s Role as: Lenders, Operators, Investors

The Unfinished Agenda l Limited Deal Flows l l Limited Investments l low aggregate and geographically skewed Transparency of Transactions l l Slow process w/ high transaction costs Sole-source deals, renegotiations Limited Number of Players Weak or Cumbersome Regulation

The Challenges Ahead l l l Huge Investment Needs PS Services to the Poor PSP for Medium & Small Towns Increase Number of PSP, especially small providers Targeted Subsidies Regulation of Services and Standards

Learning from experience Buenos Aires • • • strong Presidential-level support no subsidized alternative macro adjustment underway, currency board clear responsibilities between national, provincial and city government multi-agency steering group unions on board experienced advisors hired to prepare the transaction regulatory design done up-front near cost tariffs before bidding $1 B+ invested in 5 years Caracas • • • support at Vice-Minister level oil country, subsidies culture macroeconomic policy unclear, weak currency 23 munis + 4 states in concession area, no clear agreement among them working group from one Ministry unions on the street transaction prepared “in-house”, no professional advice sought regulatory design postponed tariffs a fraction of O&M costs No bid received

Case Study: The BA Concession l The Achievements made in 4 years: – – – l l Rehabilitation/Renovation Water Quantity & Quality Expansion of Water & Sewer Networks Tariff Evolution & Financial Outlook The Concerns: – – Infrastructure Surcharge New Environmental Objectives Lack or Subjectivity of Regulations Tariff Structure and Demand Management

Achievements in BA through 1996 Rehabilitation & Renovation of the Water Distribution Network (cumulative in kms) 1. 000 Target Achieved 800 584 633 600 400 796 427 439 252 200 134 0 Year 1 Year 2 Year 3 Year 4 817

Achievements in BA through 1996 Water quality in network % 50 Year 1 Year 2 Year 3 Year 4 40 31 % 30 20 10 5 50 % 13% 4% 4% 6% 4% 3% 8% 4% 2% 0% 0 Turbidity Chlorine Bacteriological
 1. 358")
Achievements in BA through 1996 Water expansion population served 1. 500 cumulative) 1. 358 1. 121 1. 200 761 869 900 448 569 600 (Thousans of inhabitants served Target Achieved 300 180 221 0 Year 1 Year 2 Year 3 Year 4
")
Achievements in BA through 1996 Sewerage expansion population served (Thousans of inhabitants served cumulative) Target Achieved 600 550 471 500 400 281 300 200 100 387 342 25 62 114 0 Year 1 Year 2 Year 3 Year 4

BA Financial Outlook Revenues / Costs M$ M$ Costs Revenues 400 350 • Revenues • Costs • Cash Flow • Investments • Debt Cash Flow 300 265 250 260 393 375 333 100 79 80 244 252 245 40 Year 1 Year 2 Year 3 Year 4 Year 1 Investments Year 2 Year 3 Year 4 Debt M$ 270 250 223 210 M$ 400 300 145 100 42 106 100 50 103 0 0 Year 2 96 230 200 Year 1 458 ST LP 330 200 150 122 -10 0 200 104 Year 3 Year 4 148 362 42 188 182 3 Year 1 Year 2 Year 3 Year 4

Tariff vs Consumer Price Index Evolution in BA through 1996 1. 13 1. 08 1. 17 0. 83 0. 731 Tariff

1996 - The BA Concerns • Compulsory Expansion impaired by people’s inability to pay the Infrastructure Charge • New Environmental Objectives & Standards • Tariff Regime hampered rational water use and gave no incentives to expansion • Limitations & Subjectivity of Cost Revisions • Lack of Rules & Regulations

The BA Concerns • Infrastructure Charge – One more case where the wrong subsidies were being applied: Capacity to Pay computed as 4% of a $250/month family income, which is considered as the threshold for extremely poor family. Numbers do not include 21% VAT added to bill

The BA Concerns l Socioeconomic Outlook: 50% of the population to be incorporated belong to the lowest income group.
")
The BA Concerns • Regulatory Issues – Need to incorporate new environmental objectives (Matanza-Riachuelo) & standards – Cost Revision Trigger (7%) no longer valid – Definition and Measurement of Efficiency – Need for an appropriate Risk Allocation – Overall economic equilibrium of the concession
 • MA ~")
Solution: CI SUMA + CIS • SU ~ $2. 00/service (bimonthly) • MA ~ 1. 00/service (bimonthly) • CIS ~ 4. 00/service (30 bimonthly installments) Capacity to Pay computed as 4% of a $250/month family income, which is considered as the threshold for extremely poor family. Numbers do not include 21% VAT added to bill. SUMA and CIS values are now a 5. 31% higher since they are indexed to the K factor.

The Aguas Argentinas Case: New Economic Regulation • From price-cap to benchmark model. • Tariff Equilibrium: – Formalize relationship between Revenues, Investments, Operating Expenditures and Capital Employed (Debt+Equity) – Achieve Financial Equilibrium of the Concession.

The Aguas Argentinas Case: New Economic Regulation • Financial ratios become a key reference. • Adequate Rate of Return for each 5 -year period will be a function of: • Country risk (long-term bond) • Business own risk (UK based) • Company’s projected financial structure (Debt/Equity) • Equilibrium position, subject to efficient operation: Discounted value of Future Net Funds Flow equals 0
- Slides: 28