Workshop 6 Advanced Charts Gantt Chart A Gantt


 2.")


- Slides: 15
Workshop 6 : Advanced Charts
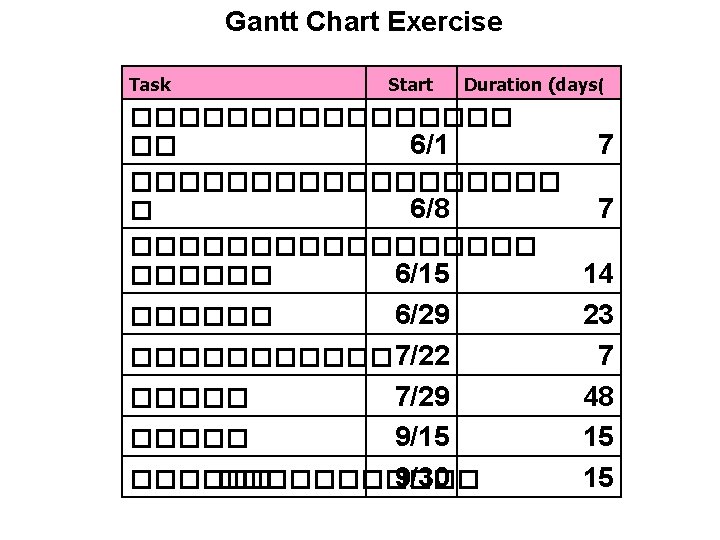
Gantt Chart • A Gantt chart is a horizontal bar chart often used in project management applications. • Excel does not support creating of Gantt chart directly • It can be adapted from stacked bar chart
Customize Chart Graphics • Sometimes changing graphic representation of quantity is attractive • You create your own symbol or icon and wish to use it
Customize Chart Graphics Exercise 1. Prepare your icon (ready made or newly created) 2. Create a normal bar graph 3. Copy your icon into clipboard 4. Click / select a bar 5. Paste into a selected bar 6. Go to Format data series… -> Pattern -> Fill Effect -> Picture to change how the icon is displayed Product/ Quarter Q 1 Q 2 Q 3 A 15 12 13 B 10 7 6 C 4 3 3 Q 4 16 7 2
Adding Trend Line and Forecasting • A trend line indicates long-term movement in time series data after other components have been accounted for. • It tells whether a particular data set (say GDP, oil prices or stock prices) have increased or decreased over the period of time. • Position and slope are calculated using statistical techniques (linear regression). • Trend lines typically are straight lines, some variations use higher degree polynomials
Trend Line Exercise Product / Quarter A B C Q 1 15 10 4 Q 2 12 7 3 Q 3 13 6 3 Q 4 16 7 2 1. Create a normal bar chart 2. Click on a bar 3. Choose Add Trend line… 4. In Type, choose a type you prefer
Forecasting • Trend line can be used to forecast what will happen in the future based on current information • The more collected data used, the more accurate prediction we get Predicted quantity
Forecasting Exercise Product / Quarter A B C Q 1 15 10 4 Q 2 12 7 3 Q 3 13 6 3 Q 4 16 7 2 1. Create a normal bar chart 2. Click on a bar 3. Select Add Trend line… 4. In Type tab, select a type you prefer 5. In Options tab, select how far the prediction will be done. 6. Curve equation can be optionally selected.
Exercise
Histogram • is used to display amount of data that fall in each category (frequency distribution of data) • A set of categories where data to be put in is called “Bin”
Histogram Exercise S/N RPM bin 0 7122. 537 7100 1 7113. 266 7105 2 7170. 542 7110 3 7117. 539 7115 4 7145. 542 7120 5 7190. 167 7125 6 7158. 12 7130 7 7162. 277 7135 8 7124. 075 7140 9 7127. 867 7145 10 7161. 701 7150 11 7120. 203 7155 12 7139. 906 7160 13 7136. 072 7165 14 7152. 337 7170 15 7171. 457 7175 16 7137. 7 7180 17 7120. 393 7185 18 7153. 613 7190 19 7155. 324 7195 20 7193. 218 7200 = 7150 + 50 * rand() – 50 * rand() Copy for 100 items STOP at 7200
Histogram Exercise S/N RPM bin 0 7122. 537 7100 1 7113. 266 7105 2 7170. 542 7110 3 7117. 539 7115 4 7145. 542 7120 5 7190. 167 7125 6 7158. 12 7130 7 7162. 277 7135 8 7124. 075 7140 9 7127. 867 7145 10 7161. 701 7150 11 7120. 203 7155 12 7139. 906 7160 13 7136. 072 7165 14 7152. 337 7170 15 7171. 457 7175 16 7137. 7 7180 17 7120. 393 7185 18 7153. 613 7190 19 7155. 324 7195 20 7193. 218 7200 • Goto menu Tool -> Data Analysis… then select Histogram • Select all data in B 2: B 102, Bin range = C 2: C 22
Histogram Exercise • Fine tune your histogram, then add trend line
Histogram Exercise • Final histogram