
Workplace Diversity Reporting Template Measure and communicate how








- Slides: 36
Workplace Diversity Reporting Template Measure and communicate how diverse talent impacts your workplace
How To Use This Template Studies show that diverse teams are more productive and creative than homogenous teams. In order to attract and retain diverse talent, you need to foster an inclusive environment that empowers employees to be themselves. This template will help you overview and communicate your organization’s diversity. Check the notes field for helpful tips on each slide. Let’s get started!
Presentation Title Presentation Subtitle Month/Day/Year Your Company’s Name/Logo Here
Agenda 1. Company Demographics Overview 2. Demographics by Office 3. Demographics by Department 4. Senior Leadership Diversity 5. Employee Satisfaction 6. Goals & Current Initiatives
Company Demographics Overview
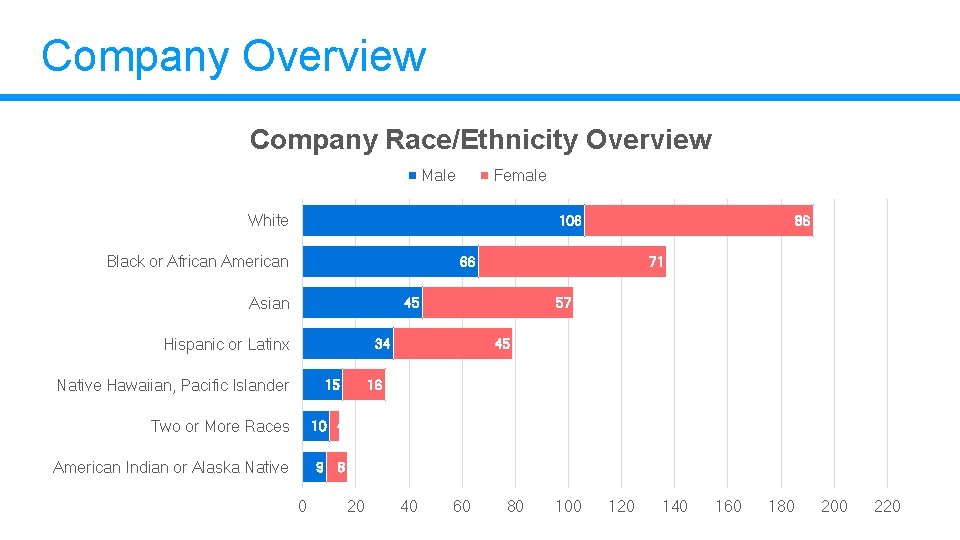
Company Overview Company Race/Ethnicity Overview Male Female White 106 Black or African American 66 Asian 71 45 Hispanic or Latinx 57 34 Native Hawaiian, Pacific Islander 15 Two or More Races 10 4 American Indian or Alaska Native 9 8 0 86 45 16 20 40 60 80 100 120 140 160 180 200 220
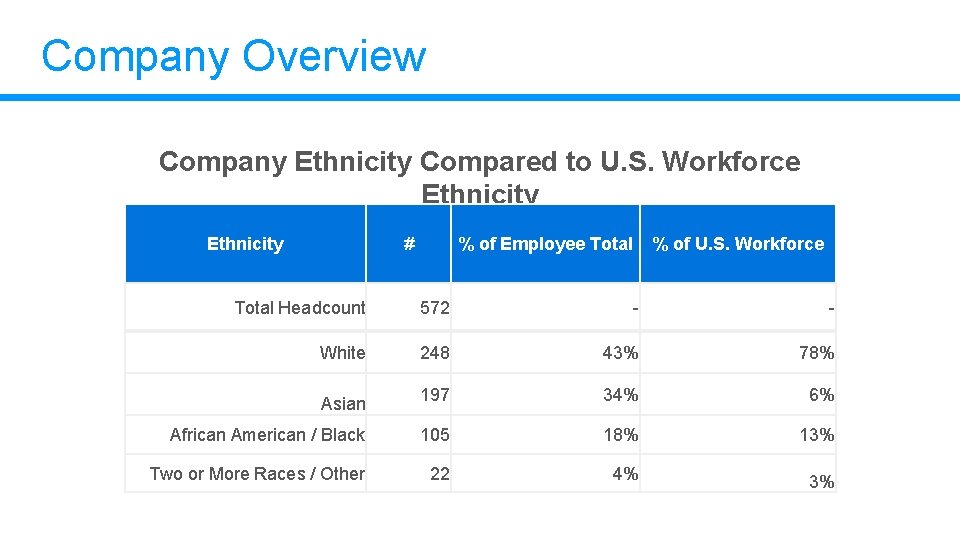
Company Overview Company Ethnicity Compared to U. S. Workforce Ethnicity # % of Employee Total % of U. S. Workforce Total Headcount 572 - - White 248 43% 78% 197 34% 6% African American / Black 105 18% 13% Two or More Races / Other 22 4% 3% Asian
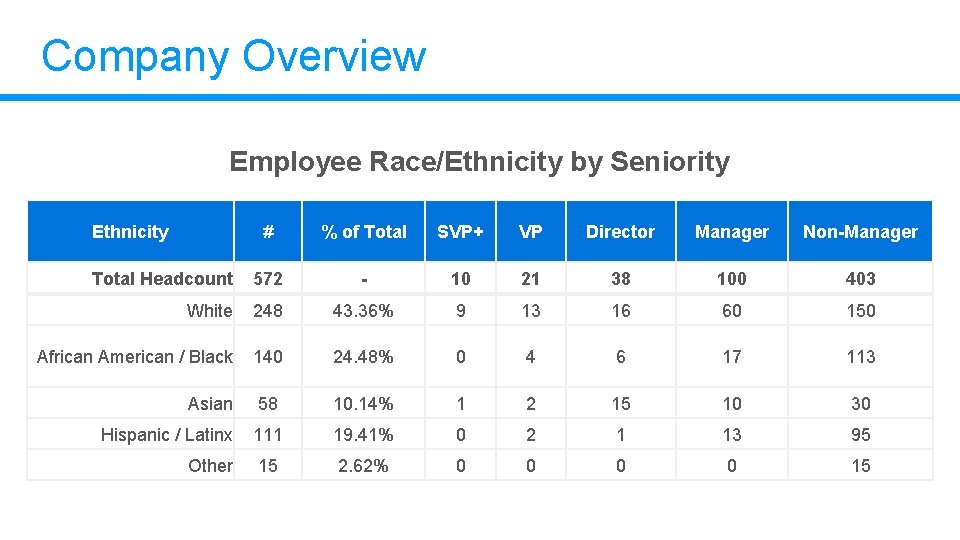
Company Overview Employee Race/Ethnicity by Seniority Ethnicity # % of Total SVP+ VP Director Manager Non-Manager Total Headcount 572 - 10 21 38 100 403 White 248 43. 36% 9 13 16 60 150 African American / Black 140 24. 48% 0 4 6 17 113 Asian 58 10. 14% 1 2 15 10 30 Hispanic / Latinx 111 19. 41% 0 2 1 13 95 Other 15 2. 62% 0 0 15
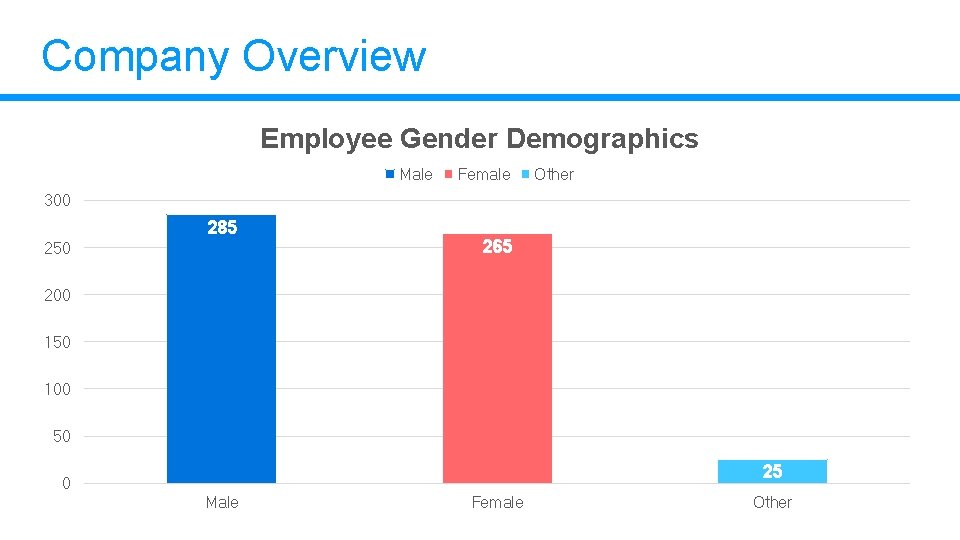
Company Overview Employee Gender Demographics Male Female Other 300 285 265 250 200 150 100 50 25 0 Male Female Other
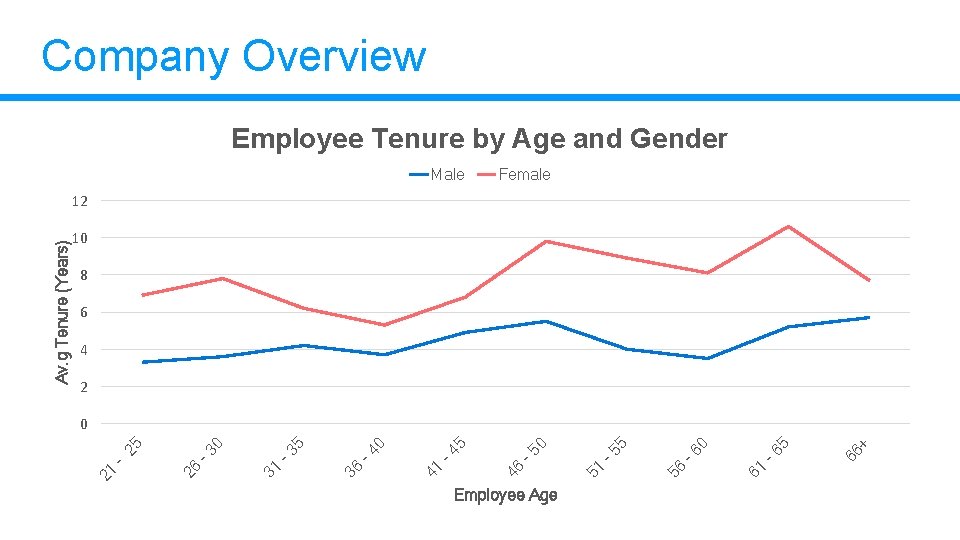
Company Overview Employee Tenure by Age and Gender Male Female 10 8 6 4 2 Employee Age + 66 5 -6 61 56 -6 0 5 -5 51 0 46 -5 5 -4 41 36 -4 0 5 -3 31 0 -3 26 - 25 0 21 Av. g Tenure (Years) 12
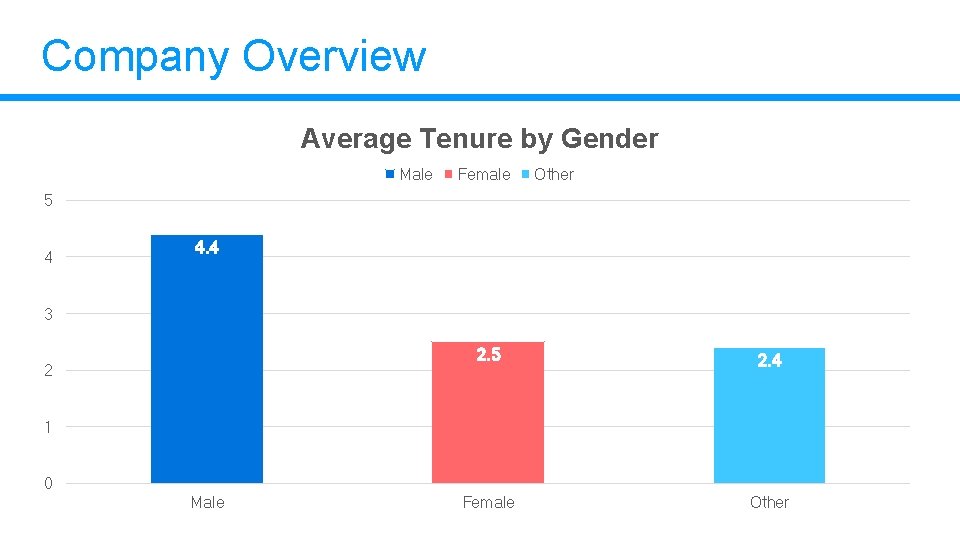
Company Overview Average Tenure by Gender Male Female Other 5 4 4. 4 3 2 2. 5 2. 4 Female Other 1 0 Male
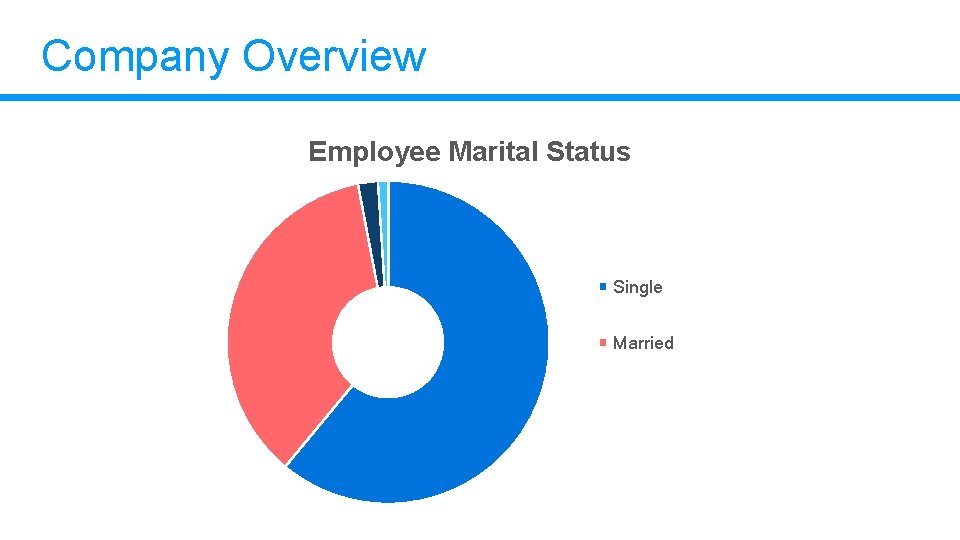
Company Overview Employee Marital Status Single Married
Demographics by Office Location
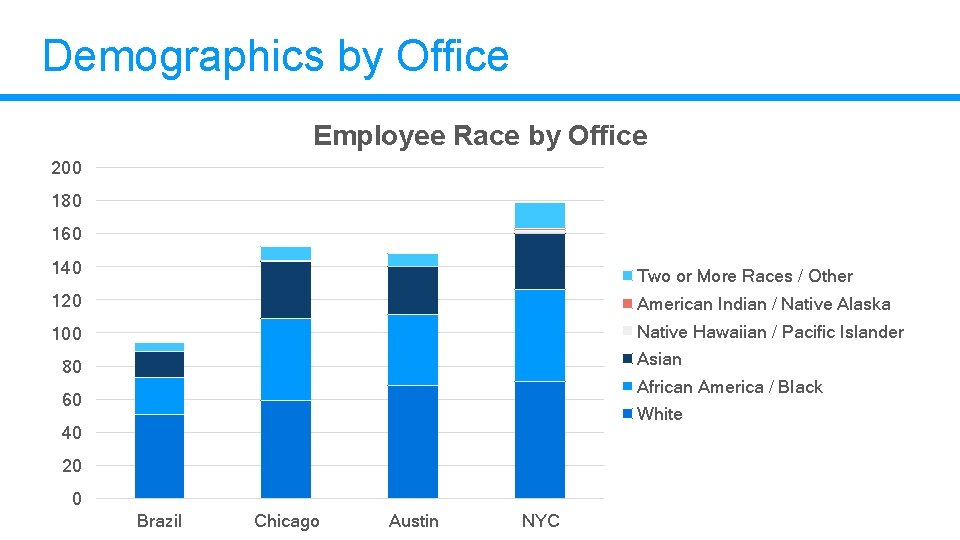
Demographics by Office Employee Race by Office 200 180 160 140 Two or More Races / Other 120 American Indian / Native Alaska 100 Native Hawaiian / Pacific Islander Asian 80 African America / Black 60 White 40 20 0 Brazil Chicago Austin NYC
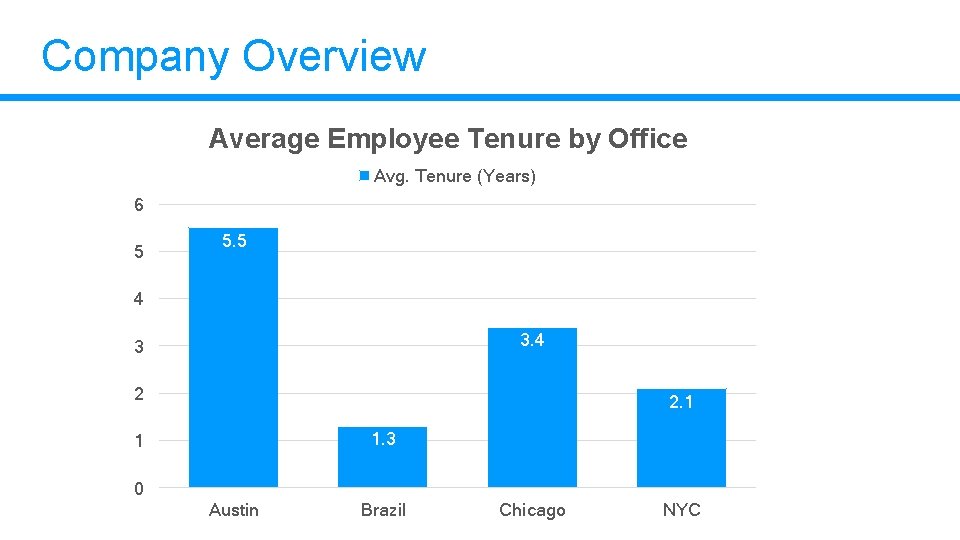
Company Overview Average Employee Tenure by Office Avg. Tenure (Years) 6 5 5. 5 4 3 2 2. 1 1. 3 1 0 Austin Brazil Chicago NYC
Demographics by Department
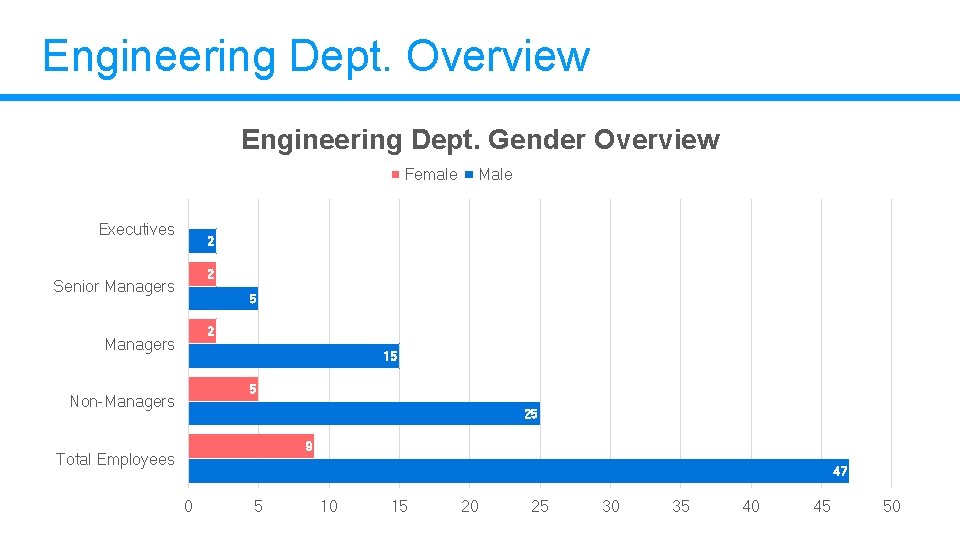
Engineering Dept. Overview Engineering Dept. Gender Overview Female Male 0 Executives 2 2 Senior Managers 5 2 Managers 15 5 Non-Managers 25 9 Total Employees 47 0 5 10 15 20 25 30 35 40 45 50
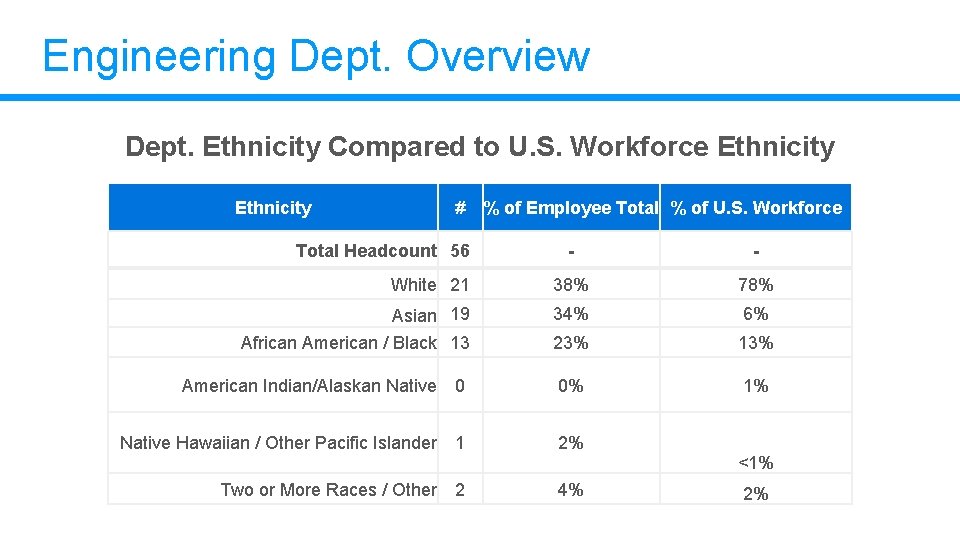
Engineering Dept. Overview Dept. Ethnicity Compared to U. S. Workforce Ethnicity # % of Employee Total % of U. S. Workforce Total Headcount 56 White 21 Asian 19 African American / Black 13 - - 38% 78% 34% 6% 23% 1% American Indian/Alaskan Native 0 0% Native Hawaiian / Other Pacific Islander 1 2% Two or More Races / Other 2 4% <1% 2%
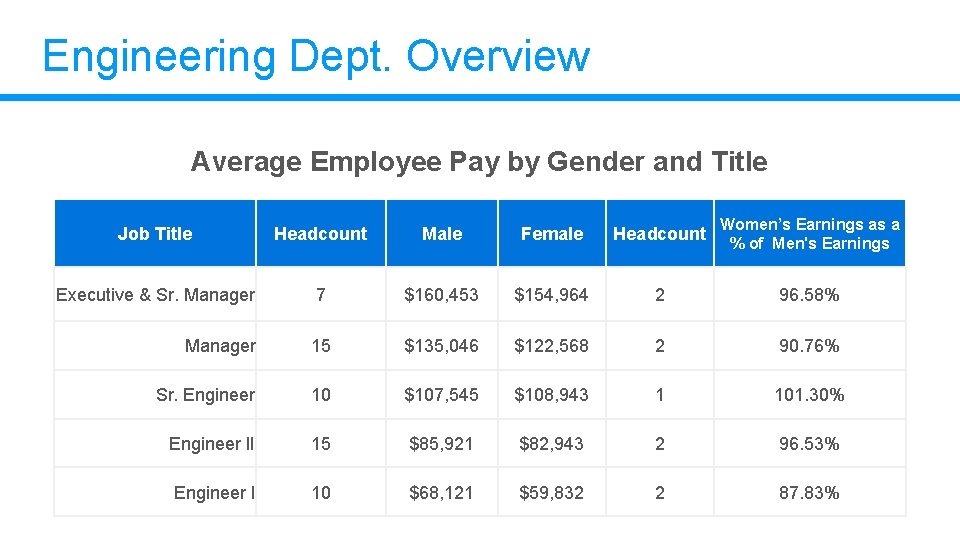
Engineering Dept. Overview Average Employee Pay by Gender and Title Headcount Male Female Headcount Women’s Earnings as a % of Men's Earnings Executive & Sr. Manager 7 $160, 453 $154, 964 2 96. 58% Manager 15 $135, 046 $122, 568 2 90. 76% Sr. Engineer 10 $107, 545 $108, 943 1 101. 30% Engineer II 15 $85, 921 $82, 943 2 96. 53% Engineer I 10 $68, 121 $59, 832 2 87. 83% Job Title
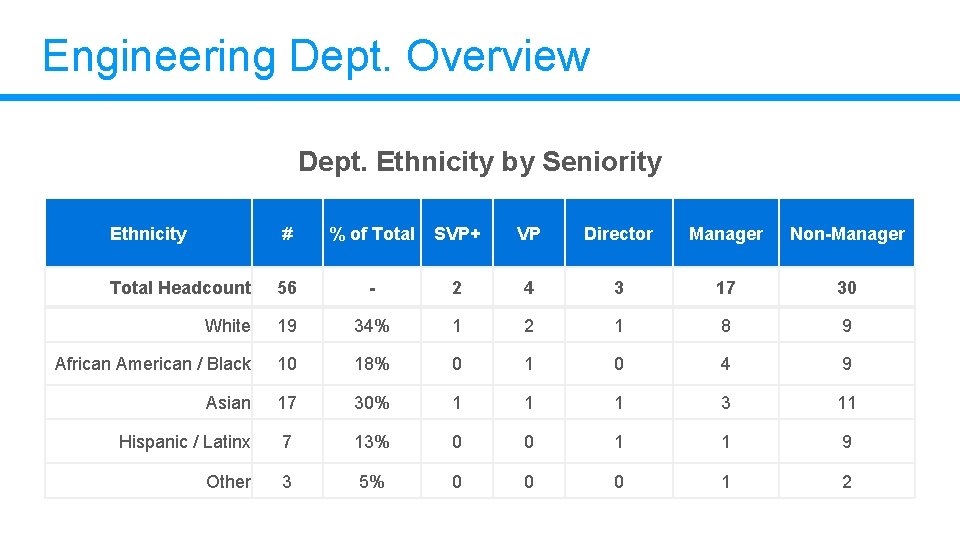
Engineering Dept. Overview Dept. Ethnicity by Seniority Ethnicity # % of Total SVP+ VP Director Manager Non-Manager 4 3 17 30 Total Headcount 56 - 2 White 19 34% 1 2 1 8 9 African American / Black 10 18% 0 1 0 4 9 Asian 17 30% 1 1 1 3 11 Hispanic / Latinx 7 13% 0 0 1 1 9 Other 3 5% 0 0 0 1 2
Senior Leadership Diversity
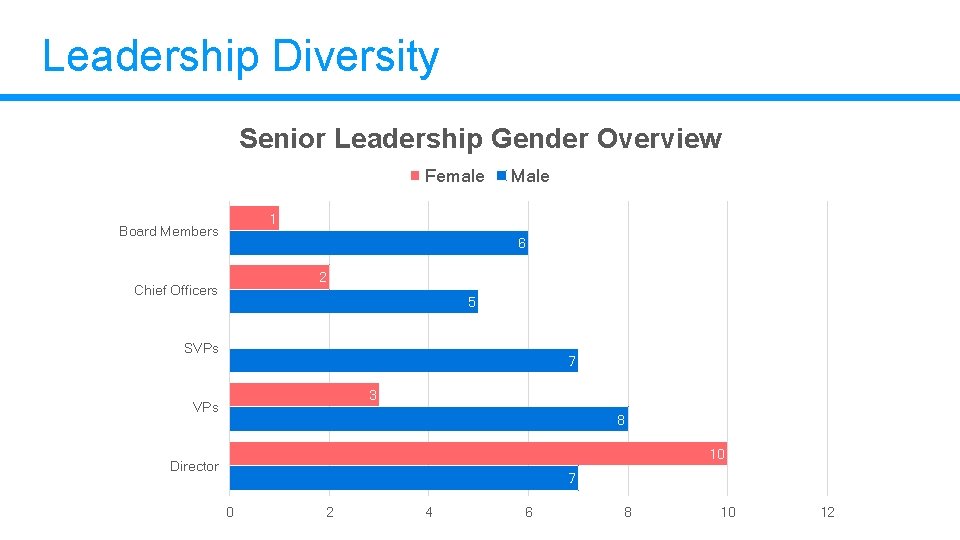
Leadership Diversity Senior Leadership Gender Overview Female Male 1 Board Members 6 2 Chief Officers 5 0 SVPs 7 3 VPs 8 10 Director 7 0 2 4 6 8 10 12
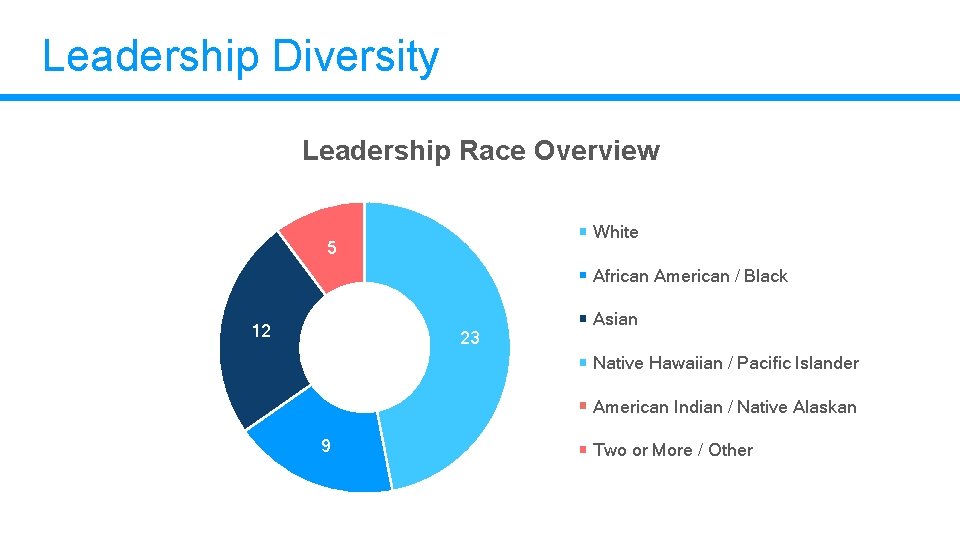
Leadership Diversity Leadership Race Overview White 5 12 23 African American / Black Asian Native Hawaiian / Pacific Islander American Indian / Native Alaskan 9 Two or More / Other
Leadership Diversity New Hires This Month Jane Doe Johnny Doe John Doe Sr. Marketing Manager VP of Client Experience Sr. Sales Manager
Employee Satisfaction
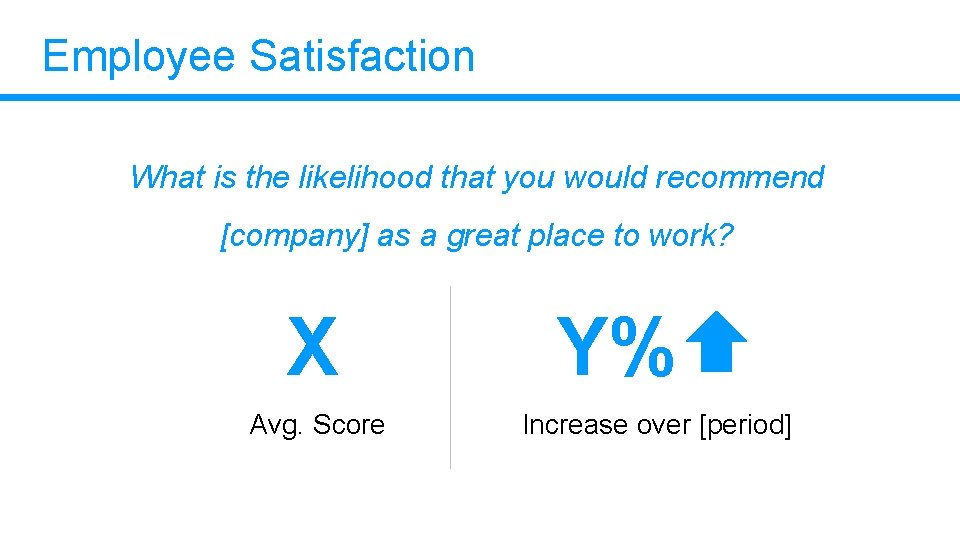
Employee Satisfaction What is the likelihood that you would recommend [company] as a great place to work? X Avg. Score Y% Increase over [period]
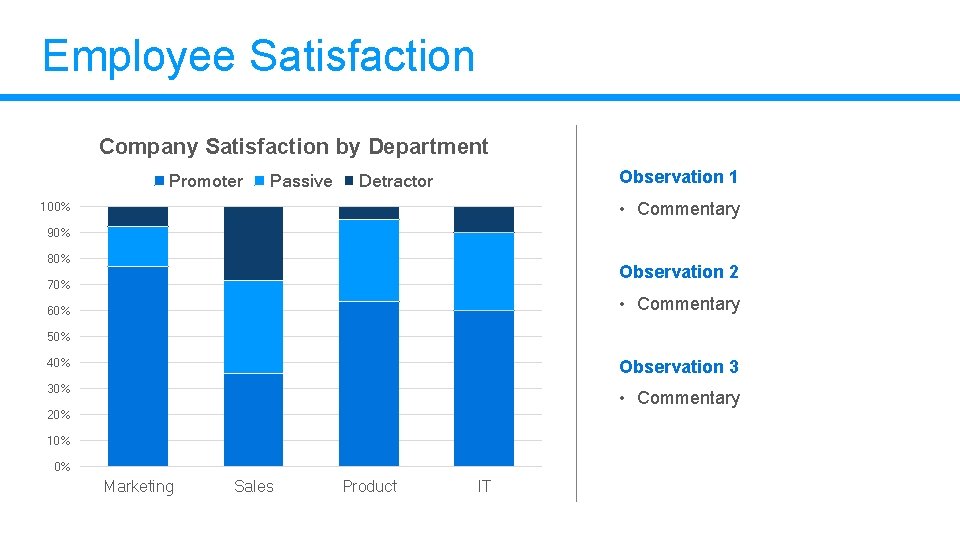
Employee Satisfaction Company Satisfaction by Department Promoter Passive Observation 1 Detractor • Commentary 100% 90% 80% 70% Observation 2 • Commentary 60% 50% 40% Observation 3 30% • Commentary 20% 10% 0% Marketing Sales Product IT
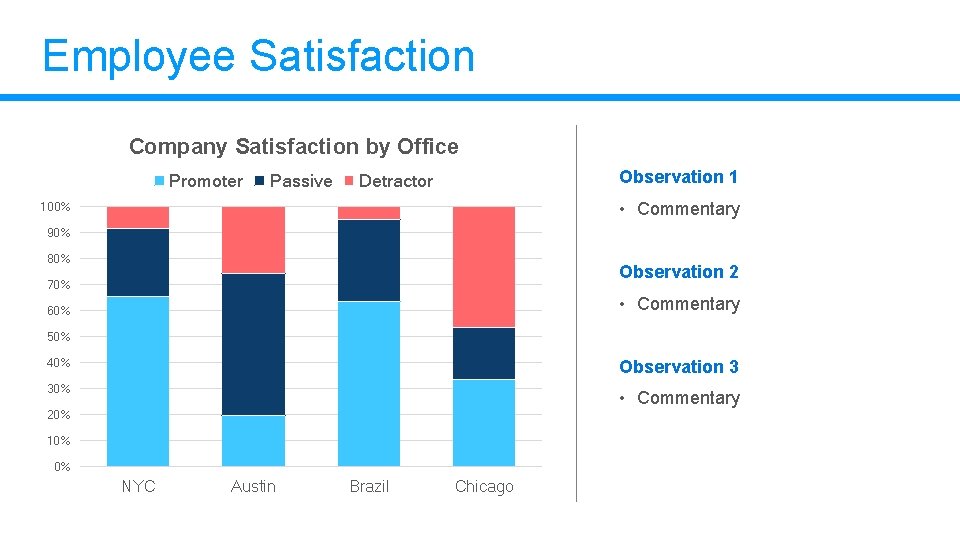
Employee Satisfaction Company Satisfaction by Office Promoter Passive Observation 1 Detractor • Commentary 100% 90% 80% 70% Observation 2 • Commentary 60% 50% 40% Observation 3 30% • Commentary 20% 10% 0% NYC Austin Brazil Chicago
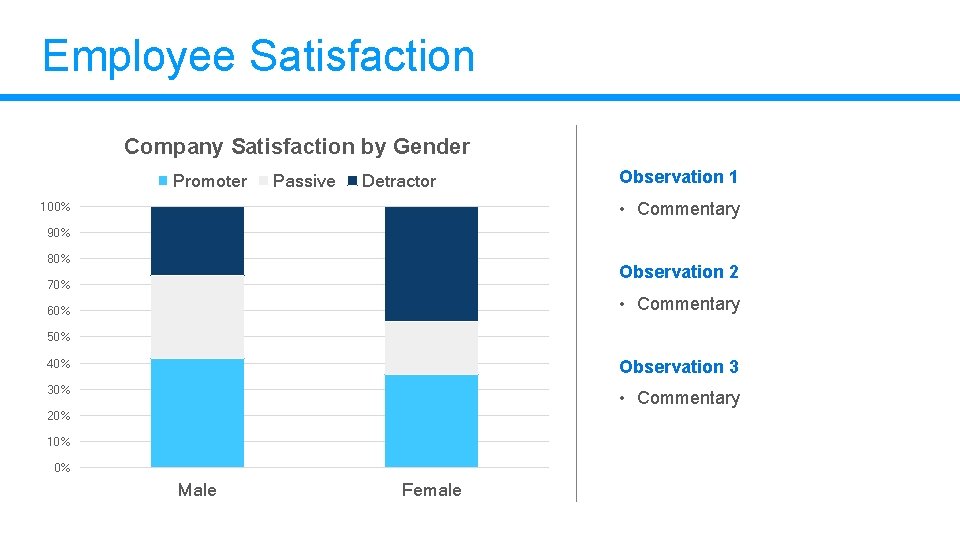
Employee Satisfaction Company Satisfaction by Gender Promoter Passive Observation 1 Detractor • Commentary 100% 90% 80% 70% Observation 2 • Commentary 60% 50% 40% Observation 3 30% • Commentary 20% 10% 0% Male Female
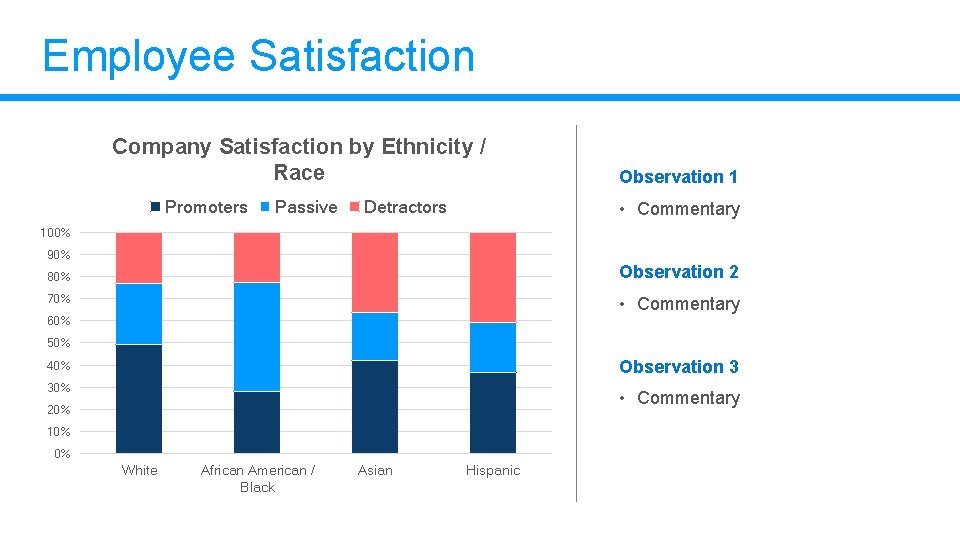
Employee Satisfaction Company Satisfaction by Ethnicity / Race Promoters Passive Detractors Observation 1 • Commentary 100% 90% 80% 70% Observation 2 • Commentary 60% 50% Observation 3 40% 30% • Commentary 20% 10% 0% White African American / Black Asian Hispanic
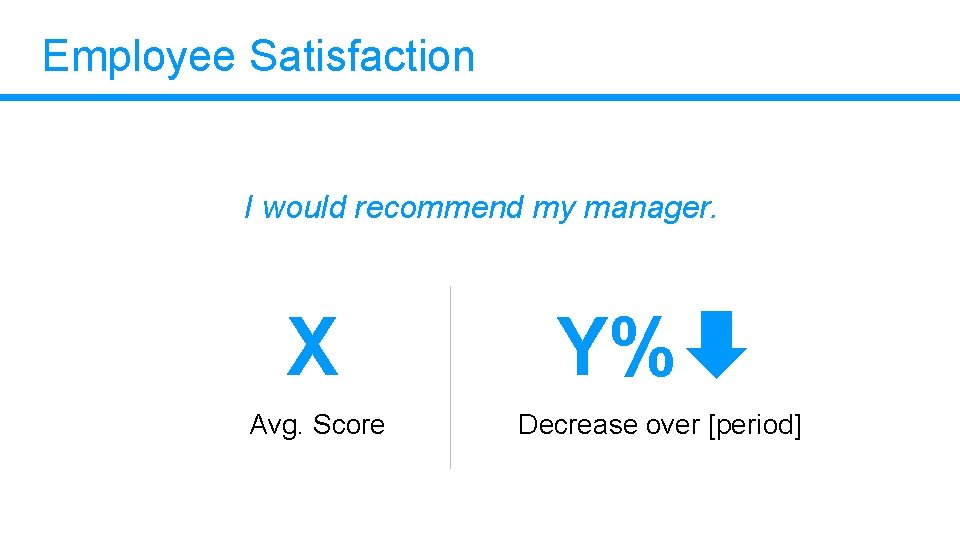
Employee Satisfaction I would recommend my manager. X Avg. Score Y% Decrease over [period]
Employee Satisfaction [Company] values diversity X Avg. Score Y% Increase over [period]
Current Initiatives
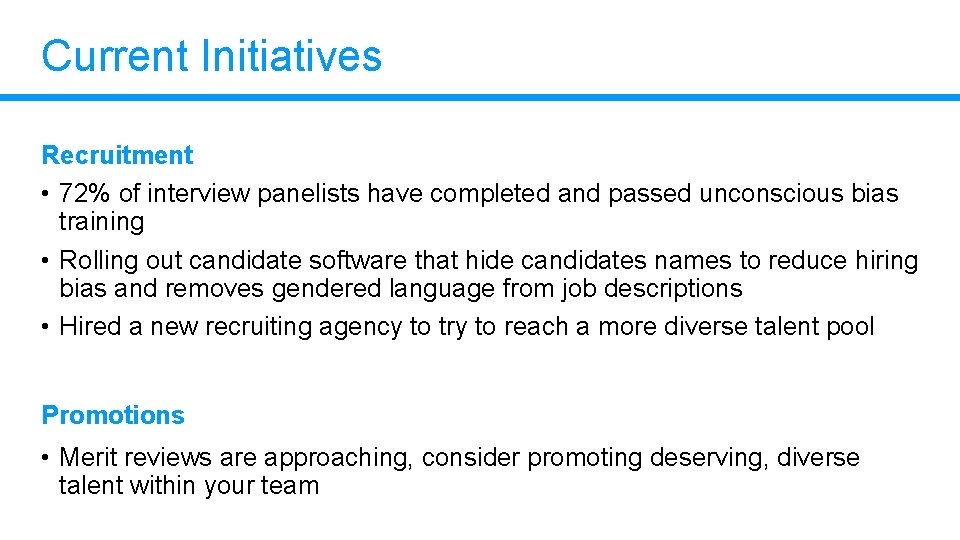
Current Initiatives Recruitment • 72% of interview panelists have completed and passed unconscious bias training • Rolling out candidate software that hide candidates names to reduce hiring bias and removes gendered language from job descriptions • Hired a new recruiting agency to try to reach a more diverse talent pool Promotions • Merit reviews are approaching, consider promoting deserving, diverse talent within your team
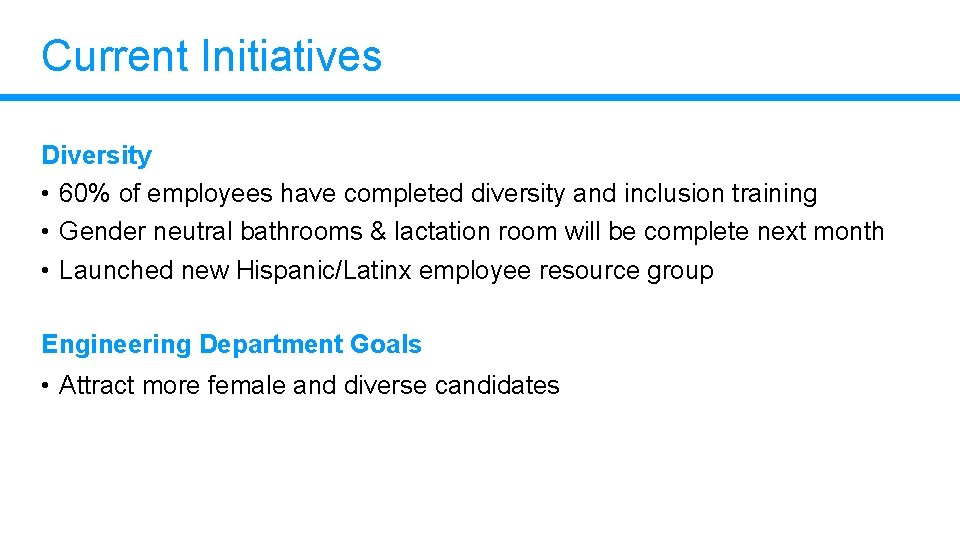
Current Initiatives Diversity • 60% of employees have completed diversity and inclusion training • Gender neutral bathrooms & lactation room will be complete next month • Launched new Hispanic/Latinx employee resource group Engineering Department Goals • Attract more female and diverse candidates
Thank You!