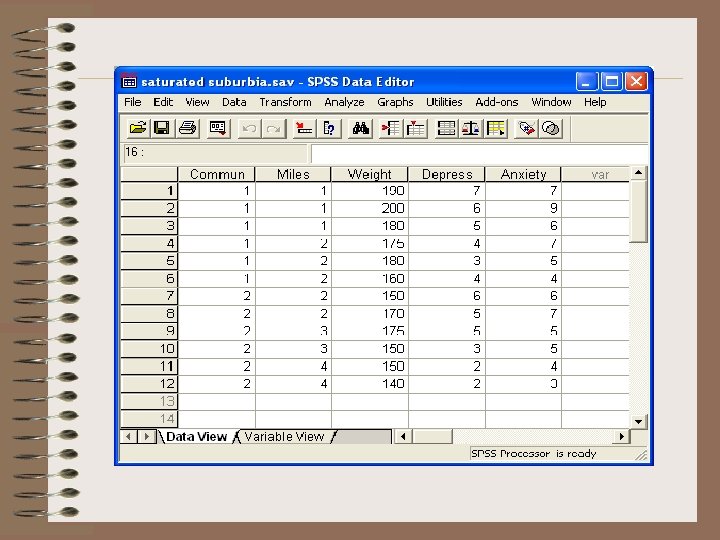
Working with relationships between two variables Size of

– Working with relationships between two variables • Size of Teaching Tip & Stats Test Score

Correlation & Regression • Univariate & Bivariate Statistics – U: frequency distribution, mean, mode, range, standard deviation – B: correlation – two variables • Correlation – linear pattern of relationship between one variable (x) and another variable (y) – an association between two variables – relative position of one variable correlates with relative distribution of another variable – graphical representation of the relationship between two variables • Warning: – No proof of causality – Cannot assume x causes y

Scatterplot! • No Correlation – Random or circular assortment of dots • Positive Correlation – ellipse leaning to right – GPA and SAT – Smoking and Lung Damage • Negative Correlation – ellipse learning to left – Depression & Self-esteem – Studying & test errors
")
Pearson’s Correlation Coefficient • “r” indicates… – strength of relationship (strong, weak, or none) – direction of relationship • positive (direct) – variables move in same direction • negative (inverse) – variables move in opposite directions • r ranges in value from – 1. 0 to +1. 0 -1. 0 Strong Negative 0. 0 No Rel. +1. 0 Strong Positive • Go to website! –playing with scatterplots

Practice with Scatterplots r =. __ __

Correlation Guestimation

Samples vs. Populations • Sample statistics estimate Population parameters – M tries to estimate μ – r tries to estimate ρ (“rho” – greek symbol --- not “p”) • r correlation for a sample • based on a the limited observations we have • ρ actual correlation in population • the true correlation • Beware Sampling Error!! – even if ρ=0 (there’s no actual correlation), you might get r =. 08 or r = -. 26 just by chance. – We look at r, but we want to know about ρ

Hypothesis testing with Correlations • Two possibilities – Ho: ρ = 0 (no actual correlation; The Null Hypothesis) – Ha: ρ ≠ 0 (there is some correlation; The Alternative Hyp. ) • Case #1 (see correlation worksheet) – Correlation between distance and points r = -. 904 – Sample small (n=6), but r is very large – We guess ρ < 0 (we guess there is some correlation in the pop. ) • Case #2 – Correlation between aiming and points, r =. 628 – Sample small (n=6), and r is only moderate in size – We guess ρ = 0 (we guess there is NO correlation in pop. ) • Bottom-line – We can only guess about ρ – We can be wrong in two ways

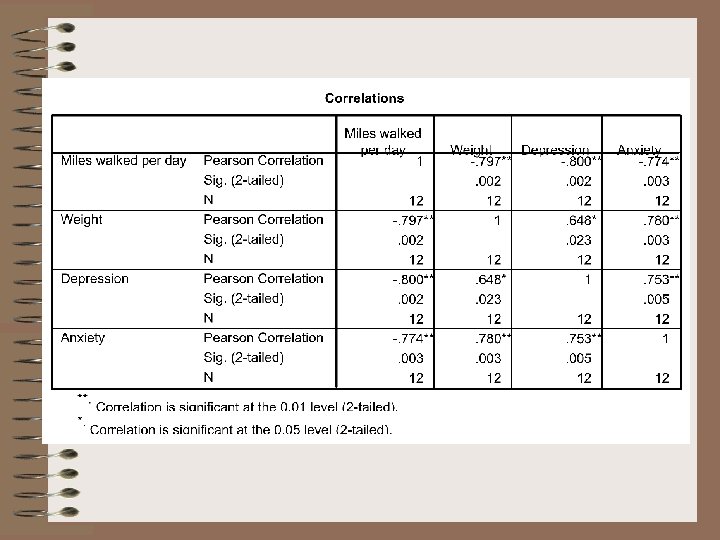
Reading Correlation Matrix r = -. 904 p =. 013 -- Probability of getting a correlation this size by sheer chance. Reject Ho if p ≤. 05. sample size r (4) = -. 904, p. 05

Predictive Potential • Coefficient of Determination – r² – Amount of variance accounted for in y by x – Percentage increase in accuracy you gain by using the regression line to make predictions – Without correlation, you can only guess the mean of y – [Used with regression] 0% 20% 40% 60% 80% 100%

Limitations of Correlation • linearity: – can’t describe non-linear relationships – e. g. , relation between anxiety & performance • truncation of range: – underestimate stength of relationship if you can’t see full range of x value • no proof of causation – third variable problem: • could be 3 rd variable causing change in both variables • directionality: can’t be sure which way causality “flows”

Regression • Regression: Correlation + Prediction – predicting y based on x – e. g. , predicting…. • throwing points (y) • based on distance from target (x) • Regression equation – – formula that specifies a line y’ = bx + a plug in a x value (distance from target) and predict y (points) note • y= actual value of a score • y’= predict value • Go to website! –Regression Playground

Regression Graphic – Regression Line See correlation & regression worksheet y’=47 y’=20 if x=18 then… if x=24 then…

Regression Equation • y’= bx + a – – See correlation & regression worksheet y’ = predicted value of y b = slope of the line x = value of x that you plug-in a = y-intercept (where line crosses y access) • In this case…. – y’ = -4. 263(x) + 125. 401 • So if the distance is 20 feet – y’ = -4. 263(20) + 125. 401 – y’ = -85. 26 + 125. 401 – y’ = 40. 141

SPSS Regression Set-up • “Criterion, ” • y-axis variable, • what you’re trying to predict • “Predictor, ” • x-axis variable, • what you’re basing the prediction on Note: Never refer to the IV or DV when doing regression

Getting Regression Info from SPSS See correlation & regression worksheet a y’ = b (x) + a y’ = -4. 263(20) + 125. 401 b

Predictive Ability • Mantra!! – As variability decreases, prediction accuracy ___ – if we can account for variance, we can make better predictions • As r increases: – r² increases • “variance accounted for” increases • the prediction accuracy increases – prediction error decreases (distance between y’ and y) – Sy’ decreases • the standard error of the residual/predictor • measures overall amount of prediction error • We like big r’s!!!

Drawing a Regression Line by Hand Three steps 1. Plug zero in for x to get a y’ value, and then plot this value – Note: It will be the y-intercept 2. Plug in a large value for x (just so it falls on the right end of the graph), plug it in for x, then plot the resulting point 3. Connect the two points with a straight line!
- Slides: 20