WORKING TOWARD FAIR MAPS Redistricting 101 League of


 • “Census Day” was April 1, 2020. • In the field")
 • Apportionment counts now projected to be provided to states by")


 49")


- Slides: 36
WORKING TOWARD FAIR MAPS: Redistricting 101 League of Women Voters of Nebraska Fair Maps Committee
We’ll be discussing • The Basics of Redistricting • Connection to Census and Apportionment • Understanding Gerrymandering & Fairness Factors • The Redistricting Process in Nebraska • How You Can Make an Impact in Nebraska
Redistricting • Following every census, the distribution of Congressional seats across the U. S. is subject to change based on population movement. This is called reapportionment. • States are tasked with drawing lines for U. S. Congressional and state districts. This is redistricting. • Many local district lines such as city councils & school boards are redrawn using decennial census data.
The Census • Constitution requires that everyone in the country is counted every 10 years. • Each decade, the Census is used to reapportion the House of Representatives and redraw boundaries for congressional and state legislative districts that account for shifts in the population. • The distribution of more than $675 billion in federal funds, grants and support to states, counties and communities is based on census data. • Communities rely on census data to plan for resident needs – roads, schools & emergency services – and businesses use census data to determine where shopping and housing developments are needed.
Redistricting frequency • Redistricting occurs every 10 years, following the national census. • After the Census Bureau releases its new data (in years ending in "1"), redistricting begins. • New congressional districts & state legislative districts must be drawn according to the new data to ensure roughly equal population.
How Redistricting Connects to Census and Reapporionment • Census happens every 10 years with the goal of counting every person/resident in the U. S. , regardless of citizenship status. • Apportionment is the process of taking the total census count and dividing that number by 435, the total number of seats in the U. S. House of Representatives. • Redistricting takes the number of people per seat or district to draw lines that are substantially equal in population.
Federal Laws for Drawing Maps • U. S. Constitution requires seats for the U. S. House of Representatives be apportioned to states according to the population count in the federal Census, conducted every 10 years. (Article 1, Section 2) • Permanent Apportionment Act of 1929 established the procedure and timeline to allocate House seats to states after each decennial census (Title 2 U. S. Code Section 2 a Chapter 1) • In Reynolds v. Sims (1964), the U. S. Supreme Court determined general basis of apportionment should be "one person, one vote. " This means that, generally, electoral districts must be equal in population according to the most recent census so that each person's vote is equally weighted. • Section 2 of the Voting Rights Act blocks district lines that deny minority voters an equal opportunity “to participate in the political process and to elect representatives of their choice. ”
Census Timeline (COVID-19) • “Census Day” was April 1, 2020. • In the field Census activities delayed from May to August. • Completion of field activities delayed from 7/31/20 to 10/31/20; then pulled back to 9/30/20.
Census Timeline (COVID-19) • Apportionment counts now projected to be provided to states by end of April 2021. • Census data to states (for redistricting) projected to be provided by July 2021.
Redistricting Processes Every state determines it own process by one of four commission types: • State legislature • Bipartisan commission • Citizens Commission • Panel of civil servants Should be subject to open meeting laws.
Redistricting Processes Every redistricting process should include: • Specific timelines for the steps leading to a redistricting plan. • Full disclosure throughout the process & public hearings on the plan proposed for adoption: • Redistricting at all levels of government must be accomplished in an open, unbiased manner with citizen participation & access at all levels & steps of the process. • Should be subject to open meeting laws.
Redistricting across the United States
LWVUS Redistricting Position "Support redistricting processes and enforceable standards that promote fair and effective representation at all levels of government with maximum opportunity for public participation. " LWVUS Impact on Issues 2018 -2020
Redistricting in Nebraska 3 1 2 3 Districts
Elected Positions Subject to Redistricting Elected Position # Districts Nebraska State Legislature (Unicameral) 49 Nebraska Supreme Court Judicial Districts 6 Nebraska State Board of Education 8 University of Nebraska Board of Regents 8 Public Service Commission 5
The Original Gerry-mander • Named for Massachusetts Governor Eldridge Gerry who, in 1812, signed a bill that created a partisan district in the Boston area that was compared to the shape of a salamander. • The term is now used to describe manipulation of district boundaries to draw a map that provides a political advantage for a particular party or group. • Experience shows that when all state government branches are dominated by any party, gerrymandering is a risk.
Cracking vs. Packing • "Cracking" and "packing" are two methods used to gerrymander. • "Packing" concentrates a like-group of voters (e. g. , Democrats or Blacks) together in excess. When packed into a few districts, their influence on surrounding districts is reduced. Their votes are "wasted" because there are more votes than necessary for the group to elect their preferred candidate of choice. • "Cracking" spreads out voters from a certain group across many districts, so that their influence is diluted in any given district. • When these two strategies are used together, they create gerrymanders that maximize the plan for a particular party drawing the lines.
Packing and Cracking
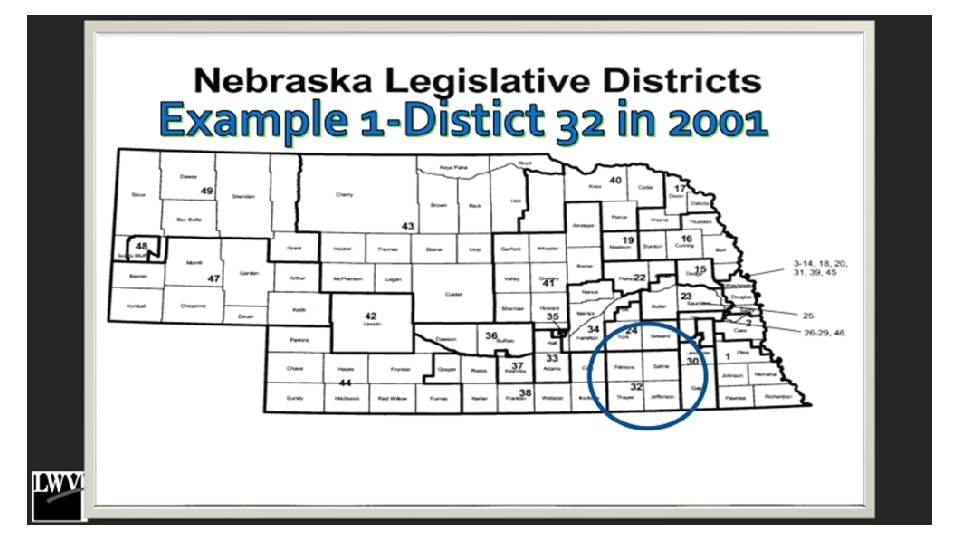
Can Gerrymandering happen here? 3 examples why the 2011 process was unfair.
PACKING
This map was drawn in a partisan manner. It ensures every Congressional seat will be Republican. Example 2 -Congressional District 2
Nebraska’s Congressional Districts prior to 2011
24
2011 Nebraska Redistricting • Redistricting Committee selected by Legislature’s Executive Board: • Due to term limits no committee member had prior redistricting experience. • Guidelines adopted, including: • No consideration given to political affiliation. • Plans based on the ideal district population. • Public hearings held with considerable outcry. Many complaints afterwards. No changes made.
Example 3 District 49 Lincoln Journal Star June 2, 2011
Nebraska Redistricting • 3 legislators from each of Nebraska’s 3 Congressional districts appointed to the Redistricting Committee. • Redistricting plans for Congressional & other districts formulated from data provided by the Bureau of the Census. • Work continues until bills & resolutions related to redistricting are complete – no established deadline.
Nebraska Voter Registration Data
2021 Nebraska Redistricting • The 2021 legislative session is scheduled to end before the proposed census data production date. • The 2022 legislative session will begin on January 5, 2022, making it impractical for passing plans ahead of the candidate filing deadline. • Primary Election: Candidate filing by February 15 or March 1, 2022; ballots mailed by March 26, 2022; election on May 10, 2022. • General Election: Ballots finalized by August 1, 2022; election on November 8, 2022.
The People Powered Fair Maps Campaign • Official Campaign Description: PPFM is a national redistricting program of the League of Women Voters that focuses on creating fair political maps in all 50 states and the District of Columbia. • In Nebraska, our focus is on supporting fair redistricting legislation and civic education.
What can you do? • Support fair redistricting legislation. • Lobby your legislator: • Write • Testify • Talk to your neighbors. • Write to your local newspaper. • Participate in public hearings.
If Interest in Additional Details
Assessing the Durability of a Gerrymander: Efficiency Gap • Efficiency gap: The difference between the parties’ respective “wasted votes” (ballots that do not contribute to a candidate’s election) divided by the total number of votes cast. • In Wisconsin, after the 2012 elections, the Republicans won 60 out of 99 State Assembly seats. But Democratic candidates for State Assembly won more votes combined than the Republican candidates. • The Wisconsin gerrymander " wastes" Democratic votes by packing as many Democratic voters into as few districts as possible, mostly by concentrating them into a cluster of districts surrounding Madison and Milwaukee.
Assessing the Durability of a Gerrymander: Partisan Bias • Partisan bias is another measure used to determine how skewed a plan is in favor of one party. • It looks at how each party would fare, given the same percentage (50%) of the vote if an election were hypothetically tied. • The partisan bias of a map is measured as the difference between a party’s seat share and 50% in a hypothetical tied election. • For example, if a party would win 55% of a plan’s districts if it received 50% of the statewide vote, then the plan has a bias of 5% in that party’s favor.
Assessing the Durability of a Gerrymander: Mean-Median • The mean-median difference subtracts a party’s median vote share, across a number of districts, from its mean vote share. The goal of a gerrymander is to maximize the number of districts won & this occurs when the median outcome is more unfavorable to the opposing party than the party's share of the vote. • Example: In the 2012 Pennsylvania congressional election, the average Democratic vote share (the mean) was 51%, yet Republican candidates won 13 of the 18 or 72% of districts. The democratic voting share percentages in the 18 districts are organized in ascending order below with the two median percentages underlined. 34. 4, 36, 37. 1, 38. 3, 40. 6, 41. 5, 42. 9, 43. 2, 43. 4, 45. 2, 48. 3, 60. 3, 69. 1, 76. 9, 84. 9, 90. 6 • The median voting share percentage (43. 4%) subtracted from the mean (51%) is 7. 7%. This percentage reflects the number of voters that were effectively disenfranchised. Because 5, 400, 000 Pennsylvanians voted in the 2012 Congressional election, 7. 7% or more than 400, 000 votes cast for Democratic candidates did not count.
Map Drawing Weighing in on Maps Map Drawing with Community Members