Working Scientifically Lesson 3 Describing Graphs Learning Objective

Working Scientifically Lesson 3: Describing Graphs

Learning Objective • To understand how to describe different shapes of graphs. Success Criteria • To use different terminology to describe the shapes of graphs. • To link the independent and dependent variables. • To describe graphs with more than one section.
")
Starter Sit back-to-back in pairs. (Get someone at home to do this with you) One person from each pair needs to have a graph in front of them. The other needs to have a blank piece of paper. Describe the graph to the other person in as much detail as possible. Then, swap over so that the person describing becomes the person drawing the graph but with a different graph. Makes sure that neither of you see the graph that you are going to draw beforehand. Once completed, compare the graphs drawn with the originals: were they the same? What was different and why?

Graph Terminology Match up the terminology with the graph shape. Some words may be used more than once and some graphs require more than one description. • small increase • gradual increase • straight line • gradual decrease • rapid increase • exponential – more and more rapid • peak • plateau • rapid decrease • directly proportional – goes through the origin • no correlation

Graph Terminology Match up the terminology with the graph shape. Some words may be used more than once and some graphs require more than one description. • • directly proportional – goes through the origin • gradual decrease • peak straight line • rapid increase • small increase • gradual increase • plateau • rapid decrease • rapid increase • rapid decrease • gradual decrease • no correlation • exponential – more and more rapid • small increase • rapid increase

Graph Terminology straight line/linear curve/non-linear directly proportional – goes through the origin rapid/sudden/dramatic/significant/sharp increase/decrease slight/small increase/decrease gradual increase/decrease peak dip steady/constant/plateau exponential – more and more rapid fluctuated positive/negative/no correlation

Describing Graphs Mark out a large set of axes – x and y. For each investigation, identify the independent and dependent variable from the investigation title. Then, use the sticky notes to explain what they are and place them in the correct places on the axes. One student from your pair should show what the shape of the graph is by drawing it or marking it out in another way. Once you are confident that you have done it right, check your solution using the answer sheet. Then, move onto the next graph.
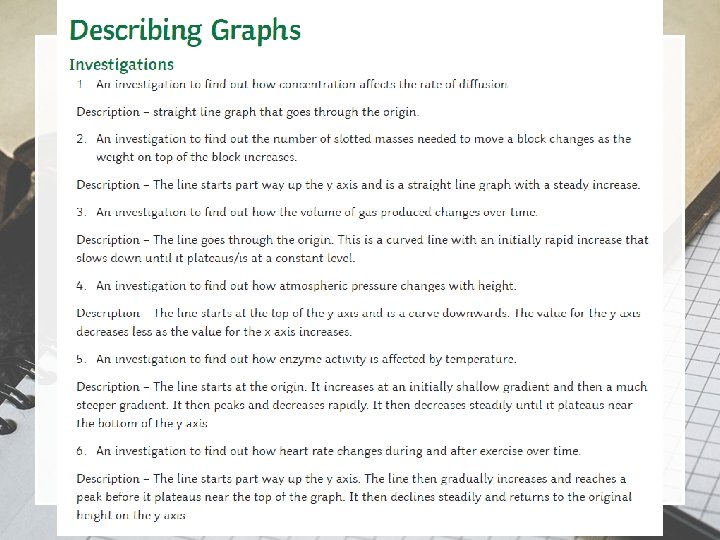
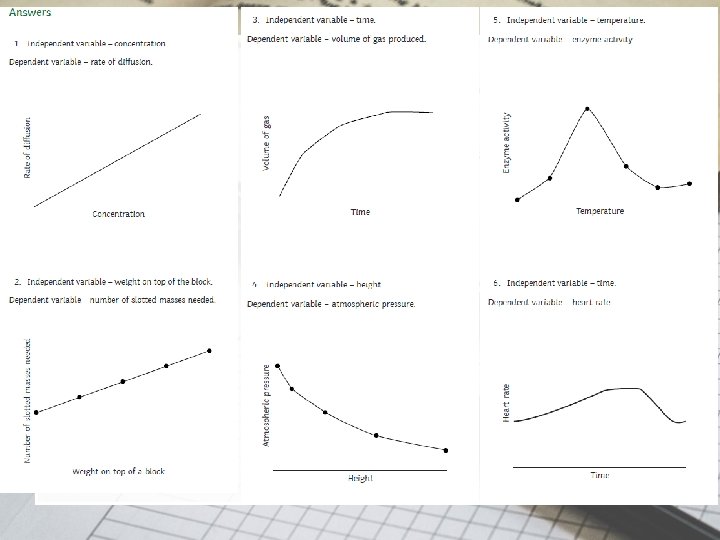

Linking the Variables For each of the graphs, finish the sentence. As the (independent variable)…. , the (dependent variable) …. .

Linking the Variables - Answers For each of the graphs, finish the sentence. As the (independent variable)…. , the (dependent variable) …. . As the height of the ramp increases, the time taken to reach the bottom of the ramp decreases. As the mass increases, the spring extension increases.
")
Plenary Sit back-to-back in pairs. (work with someone at home or facetime/skype a friend) One person from each pair needs to have a graph in front of them. The other needs to have a blank piece of paper. Describe the graph to the other person in as much detail as possible, using the terminology you have studied this lesson. Then, swap over so that the person describing becomes the person drawing the graph but with a different graph. Makes sure that neither of you see the graph that you are going to draw beforehand. How did your descriptions differ from when you did this at the start? .

Plenary
 - granted under creative commons licence - attribution")
Photo courtesy of (@flickr. com) - granted under creative commons licence - attribution
- Slides: 14