
Workforce Intelligence Network Labor Market Quarterly Reports MEDC
Workforce Intelligence Network Labor Market Quarterly Reports MEDC Region 9 Q 1 2014 Expanded Report
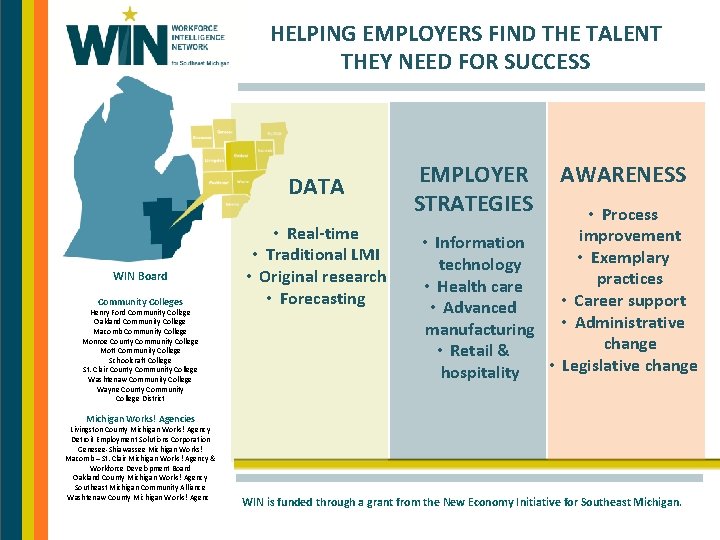
HELPING EMPLOYERS FIND THE TALENT THEY NEED FOR SUCCESS DATA WIN Board Community Colleges Henry Ford Community College Oakland Community College Macomb Community College Monroe County Community College Mott Community College Schoolcraft College St. Clair County Community College Washtenaw Community College Wayne County Community College District • Real-time • Traditional LMI • Original research • Forecasting EMPLOYER STRATEGIES AWARENESS • Process improvement • Information • Exemplary technology practices • Health care • Career support • Advanced manufacturing • Administrative change • Retail & • Legislative change hospitality Michigan Works! Agencies Livingston County Michigan Works! Agency Detroit Employment Solutions Corporation Genesee-Shiawassee Michigan Works! Macomb – St. Clair Michigan Works! Agency & Workforce Development Board Oakland County Michigan Works! Agency Southeast Michigan Community Alliance Washtenaw County Michigan Works! Agency WIN is funded through a grant from the New Economy Initiative for Southeast Michigan.

Goals Branding and Marketing: Attract and retain top talent and industry partners to the region through consistent branding and marketing techniques presenting Southeast Michigan as both a technology and innovation hub experiencing sustained growth and a great place to live and work, while also highlighting the diverse companies engaged in this effort. Identifying Needs: Thoroughly explore and understand the regional technology industry to identify talent needs to develop strategies and encourage solutions that support short- and long-term national Competitiveness Networking: Support area technology firms by providing a network of industry peers, potential partners, suppliers, and customers, as well as direct access to workforce development partners, community based organizations, higher education institutions, economic developers, and other regional stakeholders to collectively and effectively address 3 industry-identified projects and challenges

Working Together, Preparing For Growth Automotive manufacturing companies, educational institutions, and the workforce development system work together through the Michigan Academy for Green Mobility Alliance (MAGMA) to ensure the automotive industry has the engineering and technical talent needed to support hybrid, electric, lightweight, alternative fuel, and other advanced vehicle technologies.

https: //ssgresearch. com/WIN-SPARK 5
THIS IS WHAT IS HAPPENING NOW… 6
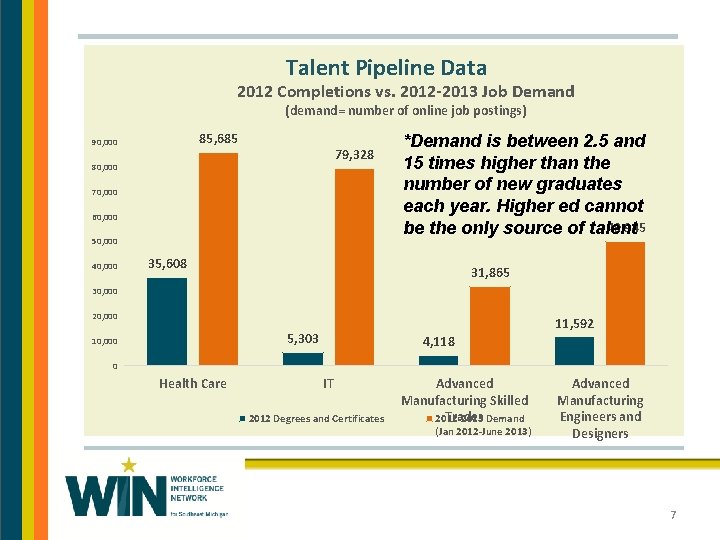
Talent Pipeline Data 2012 Completions vs. 2012 -2013 Job Demand (demand= number of online job postings) 85, 685 90, 000 79, 328 80, 000 70, 000 60, 000 50, 000 40, 000 *Demand is between 2. 5 and 15 times higher than the number of new graduates each year. Higher ed cannot 49, 945 be the only source of talent 35, 608 31, 865 30, 000 20, 000 11, 592 5, 303 10, 000 4, 118 0 Health Care IT 2012 Degrees and Certificates Advanced Manufacturing Skilled Trades Demand 2012 -2013 (Jan 2012 -June 2013) Advanced Manufacturing Engineers and Designers 7
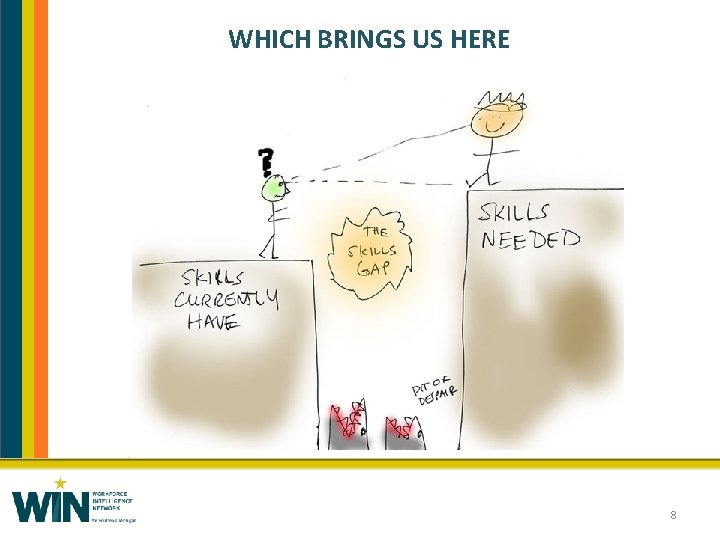
WHICH BRINGS US HERE 8

Section one LABOR MARKET AND DEMAND OVERVIEW
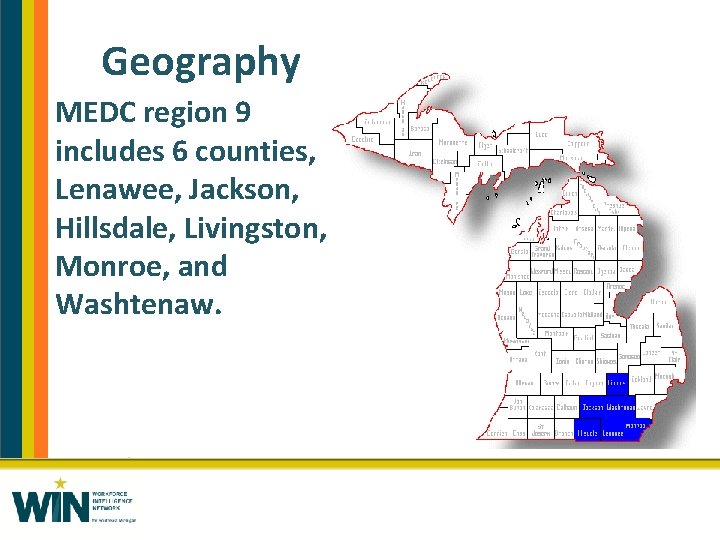
Geography MEDC region 9 includes 6 counties, Lenawee, Jackson, Hillsdale, Livingston, Monroe, and Washtenaw.
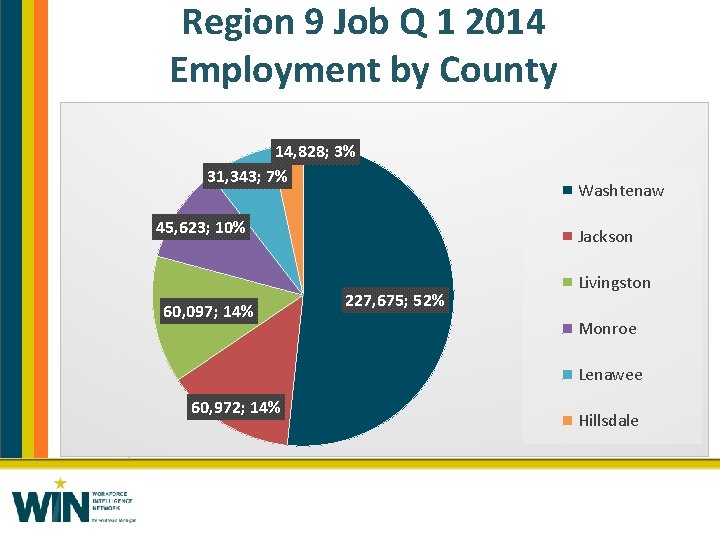
Region 9 Job Q 1 2014 Employment by County 14, 828; 3% 31, 343; 7% 45, 623; 10% 60, 097; 14% Washtenaw Jackson 227, 675; 52% Livingston Monroe Lenawee 60, 972; 14% Hillsdale
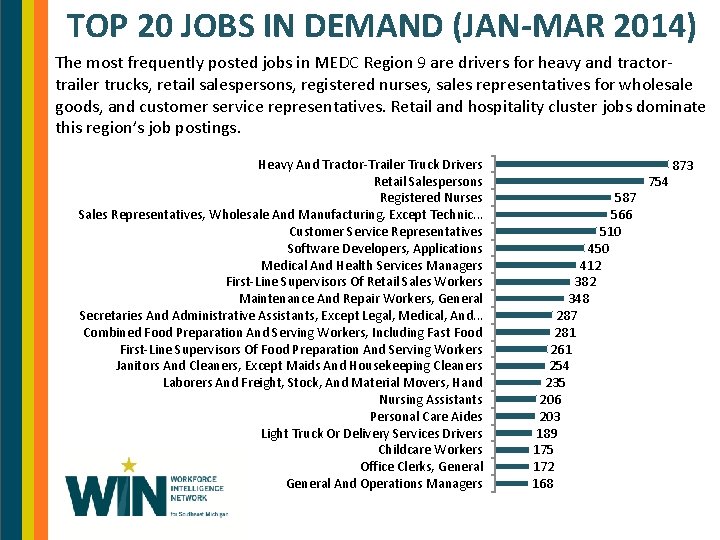
TOP 20 JOBS IN DEMAND (JAN-MAR 2014) The most frequently posted jobs in MEDC Region 9 are drivers for heavy and tractortrailer trucks, retail salespersons, registered nurses, sales representatives for wholesale goods, and customer service representatives. Retail and hospitality cluster jobs dominate this region’s job postings. Heavy And Tractor-Trailer Truck Drivers Retail Salespersons Registered Nurses Sales Representatives, Wholesale And Manufacturing, Except Technic. . . Customer Service Representatives Software Developers, Applications Medical And Health Services Managers First-Line Supervisors Of Retail Sales Workers Maintenance And Repair Workers, General Secretaries And Administrative Assistants, Except Legal, Medical, And. . . Combined Food Preparation And Serving Workers, Including Fast Food First-Line Supervisors Of Food Preparation And Serving Workers Janitors And Cleaners, Except Maids And Housekeeping Cleaners Laborers And Freight, Stock, And Material Movers, Hand Nursing Assistants Personal Care Aides Light Truck Or Delivery Services Drivers Childcare Workers Office Clerks, General And Operations Managers 587 566 510 450 412 382 348 287 281 261 254 235 206 203 189 175 172 168 754 873
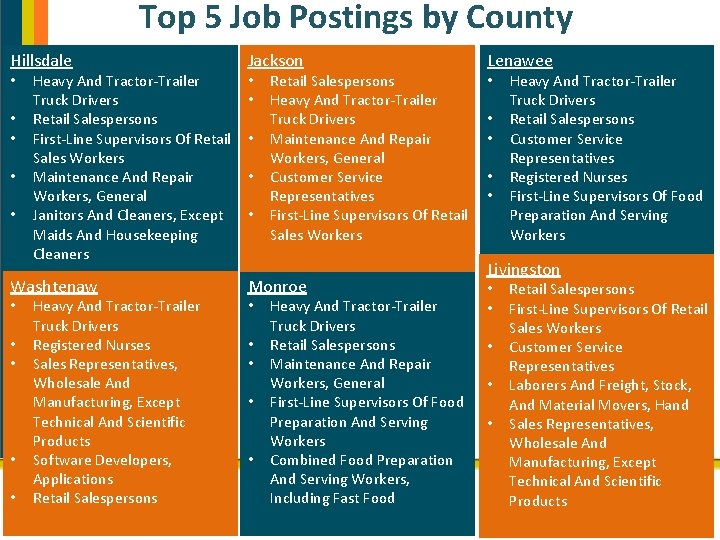
Top 5 Job Postings by County Hillsdale • • • Heavy And Tractor-Trailer Truck Drivers Retail Salespersons First-Line Supervisors Of Retail Sales Workers Maintenance And Repair Workers, General Janitors And Cleaners, Except Maids And Housekeeping Cleaners Jackson Lenawee • • Retail Salespersons Heavy And Tractor-Trailer Truck Drivers Maintenance And Repair Workers, General Customer Service Representatives First-Line Supervisors Of Retail Sales Workers Washtenaw Monroe • • Heavy And Tractor-Trailer Truck Drivers Registered Nurses Sales Representatives, Wholesale And Manufacturing, Except Technical And Scientific Products Software Developers, Applications Retail Salespersons • • • Heavy And Tractor-Trailer Truck Drivers Retail Salespersons Maintenance And Repair Workers, General First-Line Supervisors Of Food Preparation And Serving Workers Combined Food Preparation And Serving Workers, Including Fast Food • • • Heavy And Tractor-Trailer Truck Drivers Retail Salespersons Customer Service Representatives Registered Nurses First-Line Supervisors Of Food Preparation And Serving Workers Livingston • • • Retail Salespersons First-Line Supervisors Of Retail Sales Workers Customer Service Representatives Laborers And Freight, Stock, And Material Movers, Hand Sales Representatives, Wholesale And Manufacturing, Except Technical And Scientific Products
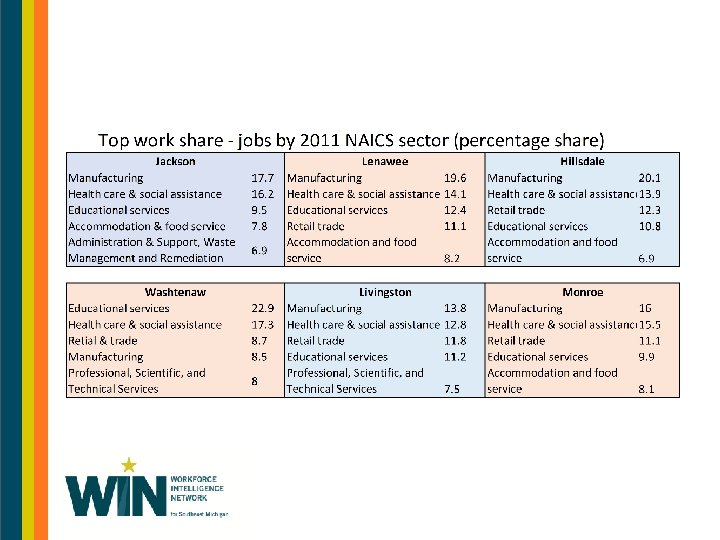
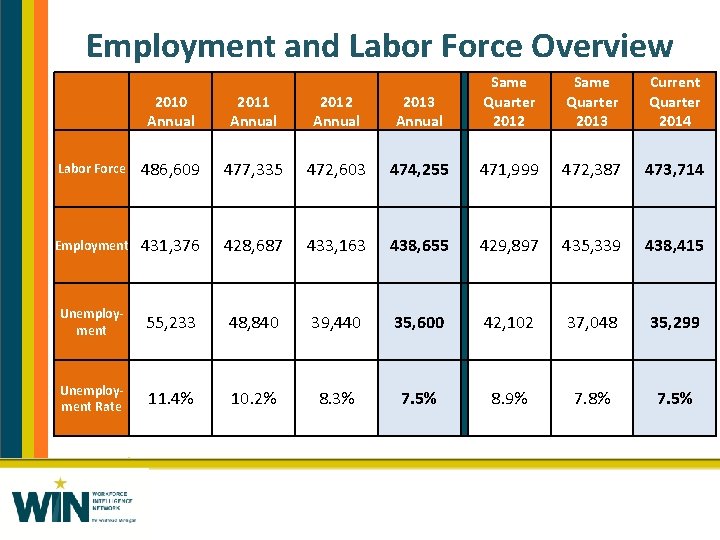
Employment and Labor Force Overview 2010 Annual 2011 Annual 2012 Annual 2013 Annual Same Quarter 2012 Same Quarter 2013 Current Quarter 2014 Labor Force 486, 609 477, 335 472, 603 474, 255 471, 999 472, 387 473, 714 Employment 431, 376 428, 687 433, 163 438, 655 429, 897 435, 339 438, 415 Unemployment 55, 233 48, 840 39, 440 35, 600 42, 102 37, 048 35, 299 Unemployment Rate 11. 4% 10. 2% 8. 3% 7. 5% 8. 9% 7. 8% 7. 5%
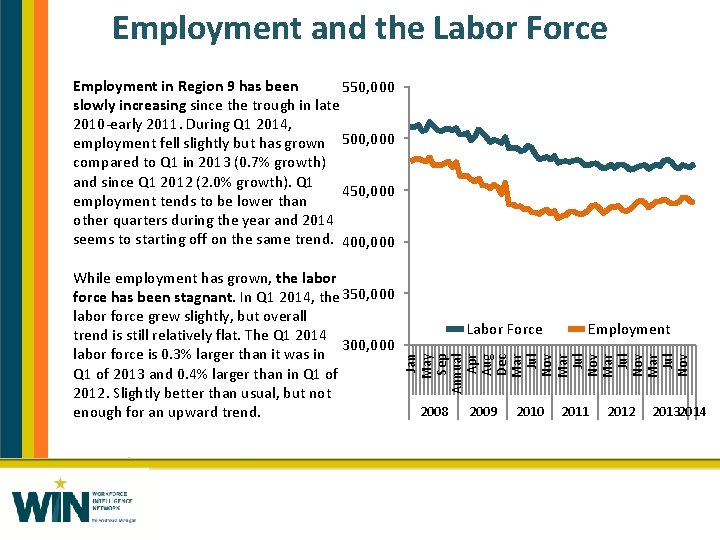
Employment and the Labor Force Employment in Region 9 has been 550, 000 slowly increasing since the trough in late 2010 -early 2011. During Q 1 2014, employment fell slightly but has grown 500, 000 compared to Q 1 in 2013 (0. 7% growth) and since Q 1 2012 (2. 0% growth). Q 1 450, 000 employment tends to be lower than other quarters during the year and 2014 seems to starting off on the same trend. 400, 000 Labor Force Employment Jan May Sep Annual Apr Aug Dec Mar Jul Nov While employment has grown, the labor force has been stagnant. In Q 1 2014, the 350, 000 labor force grew slightly, but overall trend is still relatively flat. The Q 1 2014 300, 000 labor force is 0. 3% larger than it was in Q 1 of 2013 and 0. 4% larger than in Q 1 of 2012. Slightly better than usual, but not enough for an upward trend. 2008 2009 2010 2011 2012 20132014
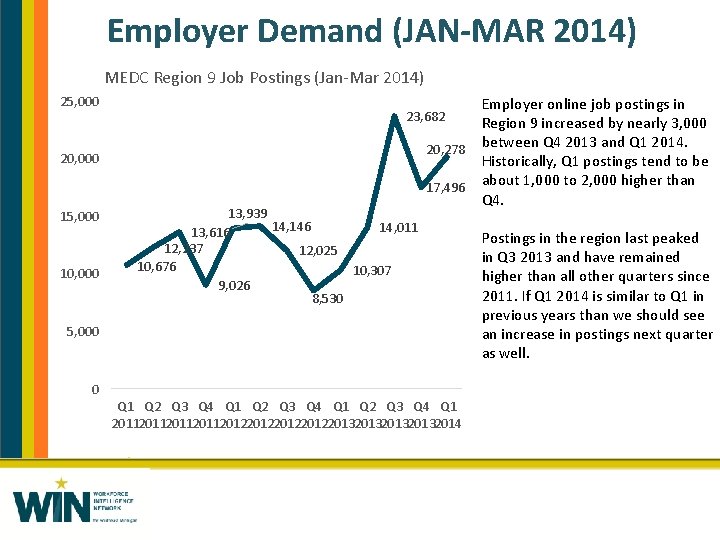
Employer Demand (JAN-MAR 2014) MEDC Region 9 Job Postings (Jan-Mar 2014) 25, 000 23, 682 20, 278 20, 000 17, 496 15, 000 10, 000 13, 939 14, 146 14, 011 13, 616 12, 237 12, 025 10, 676 10, 307 9, 026 8, 530 5, 000 0 Q 1 Q 2 Q 3 Q 4 Q 1 2011201120122012201320132014 Employer online job postings in Region 9 increased by nearly 3, 000 between Q 4 2013 and Q 1 2014. Historically, Q 1 postings tend to be about 1, 000 to 2, 000 higher than Q 4. Postings in the region last peaked in Q 3 2013 and have remained higher than all other quarters since 2011. If Q 1 2014 is similar to Q 1 in previous years than we should see an increase in postings next quarter as well.

Section two OCCUPATIONAL CLUSTERS
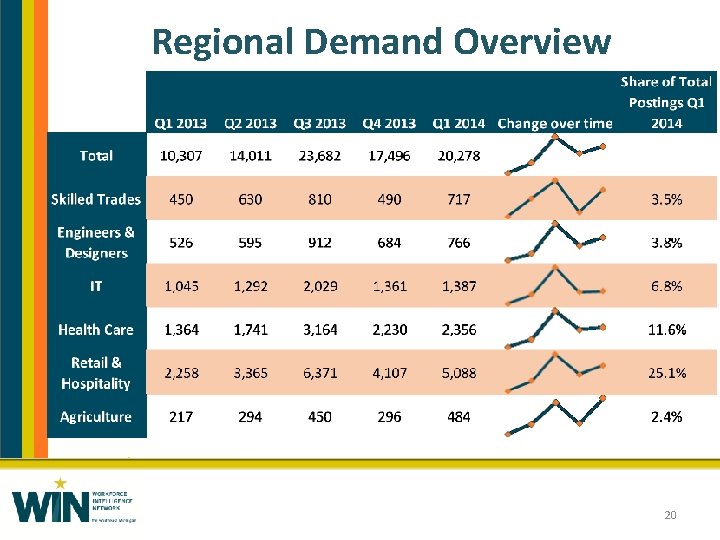
Regional Demand Overview 20
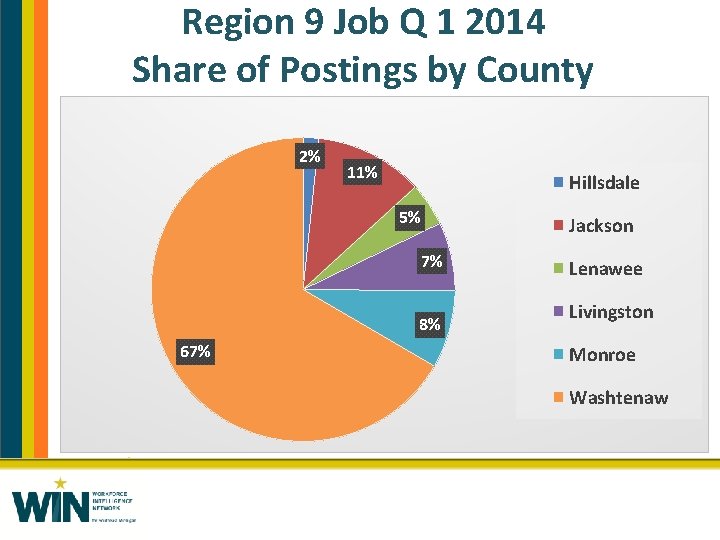
Region 9 Job Q 1 2014 Share of Postings by County 2% 11% Hillsdale 5% 7% 8% 67% Jackson Lenawee Livingston Monroe Washtenaw

Section two SKILLED TRADES
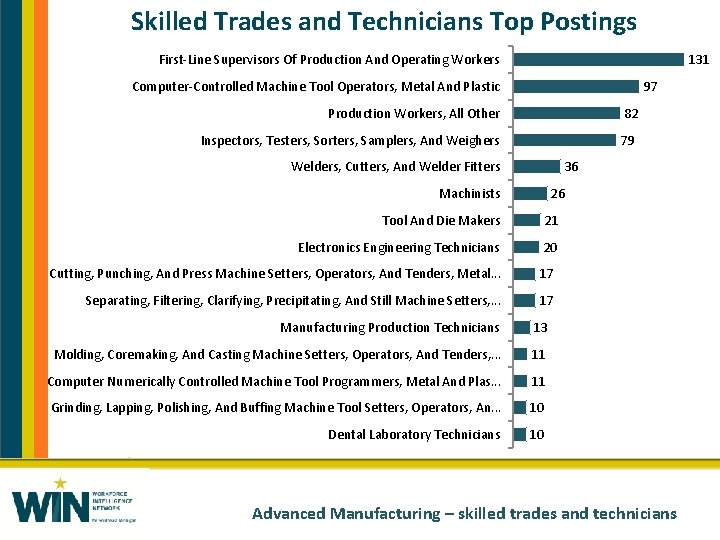
Skilled Trades and Technicians Top Postings First-Line Supervisors Of Production And Operating Workers 131 Computer-Controlled Machine Tool Operators, Metal And Plastic 97 Production Workers, All Other 82 Inspectors, Testers, Sorters, Samplers, And Weighers 79 Welders, Cutters, And Welder Fitters 36 26 Machinists Tool And Die Makers 21 Electronics Engineering Technicians 20 Cutting, Punching, And Press Machine Setters, Operators, And Tenders, Metal. . . 17 Separating, Filtering, Clarifying, Precipitating, And Still Machine Setters, . . . 17 Manufacturing Production Technicians 13 Molding, Coremaking, And Casting Machine Setters, Operators, And Tenders, . . . 11 Computer Numerically Controlled Machine Tool Programmers, Metal And Plas. . . 11 Grinding, Lapping, Polishing, And Buffing Machine Tool Setters, Operators, An. . . 10 Dental Laboratory Technicians 10 Advanced Manufacturing – skilled trades and technicians
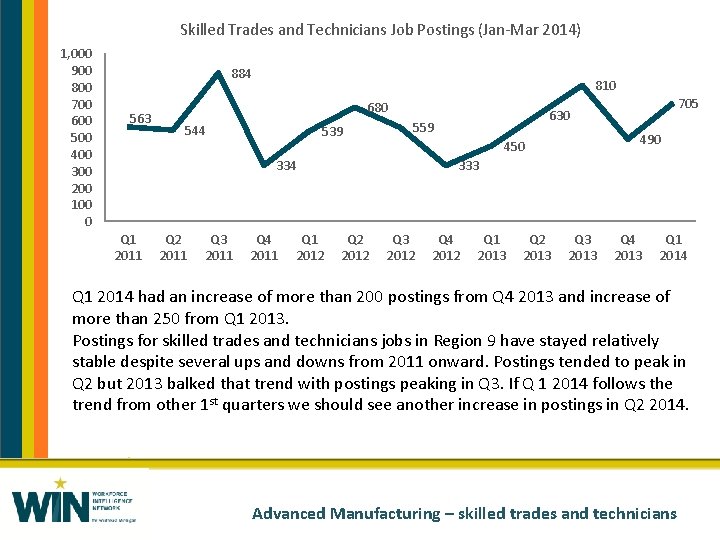
Skilled Trades and Technicians Job Postings (Jan-Mar 2014) 1, 000 900 800 700 600 500 400 300 200 100 0 884 563 810 680 544 539 Q 1 2011 Q 2 2011 Q 3 2011 Q 4 2011 Q 1 2012 630 559 490 450 334 705 333 Q 2 2012 Q 3 2012 Q 4 2012 Q 1 2013 Q 2 2013 Q 3 2013 Q 4 2013 Q 1 2014 had an increase of more than 200 postings from Q 4 2013 and increase of more than 250 from Q 1 2013. Postings for skilled trades and technicians jobs in Region 9 have stayed relatively stable despite several ups and downs from 2011 onward. Postings tended to peak in Q 2 but 2013 balked that trend with postings peaking in Q 3. If Q 1 2014 follows the trend from other 1 st quarters we should see another increase in postings in Q 2 2014. Advanced Manufacturing – skilled trades and technicians
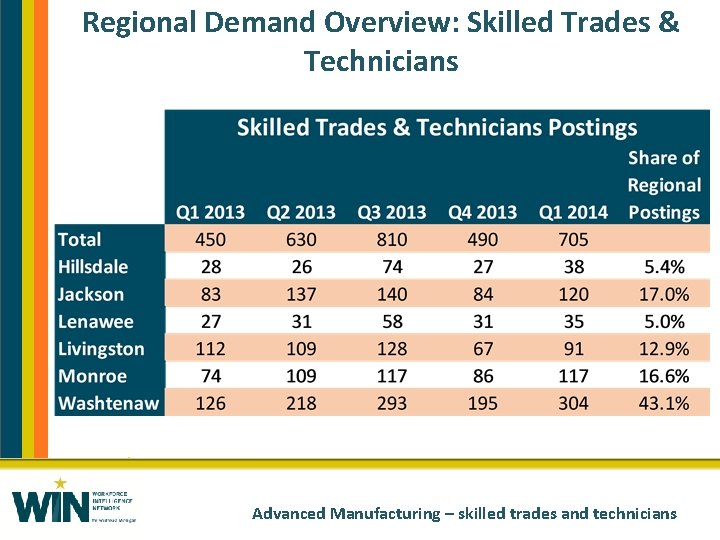
Regional Demand Overview: Skilled Trades & Technicians Advanced Manufacturing – skilled trades and technicians
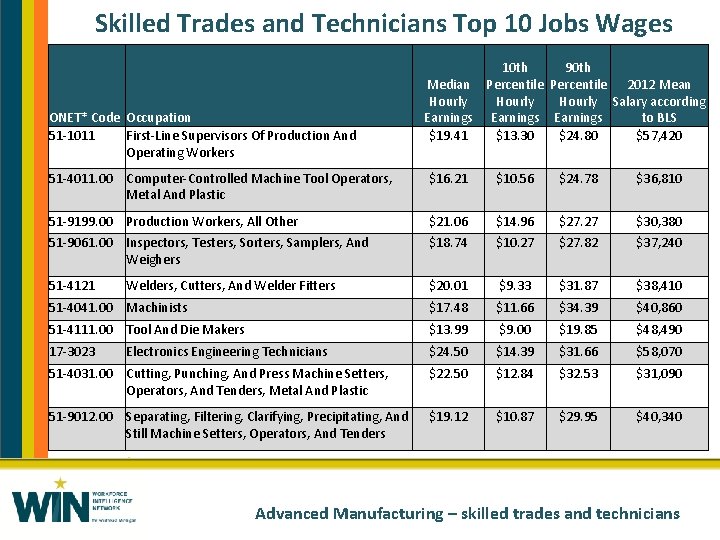
Skilled Trades and Technicians Top 10 Jobs Wages ONET* Code Occupation 51 -1011 First-Line Supervisors Of Production And Operating Workers 10 th 90 th Median Percentile 2012 Mean Hourly Salary according Hourly Earnings to BLS $19. 41 $13. 30 $24. 80 $57, 420 51 -4011. 00 Computer-Controlled Machine Tool Operators, Metal And Plastic $16. 21 $10. 56 $24. 78 $36, 810 51 -9199. 00 Production Workers, All Other $21. 06 $14. 96 $27. 27 $30, 380 51 -9061. 00 Inspectors, Testers, Sorters, Samplers, And Weighers $18. 74 $10. 27 $27. 82 $37, 240 51 -4121 $20. 01 $9. 33 $31. 87 $38, 410 51 -4041. 00 Machinists $17. 48 $11. 66 $34. 39 $40, 860 51 -4111. 00 Tool And Die Makers $13. 99 $9. 00 $19. 85 $48, 490 17 -3023 $24. 50 $14. 39 $31. 66 $58, 070 51 -4031. 00 Cutting, Punching, And Press Machine Setters, Operators, And Tenders, Metal And Plastic $22. 50 $12. 84 $32. 53 $31, 090 51 -9012. 00 Separating, Filtering, Clarifying, Precipitating, And Still Machine Setters, Operators, And Tenders $19. 12 $10. 87 $29. 95 $40, 340 Welders, Cutters, And Welder Fitters Electronics Engineering Technicians Advanced Manufacturing – skilled trades and technicians
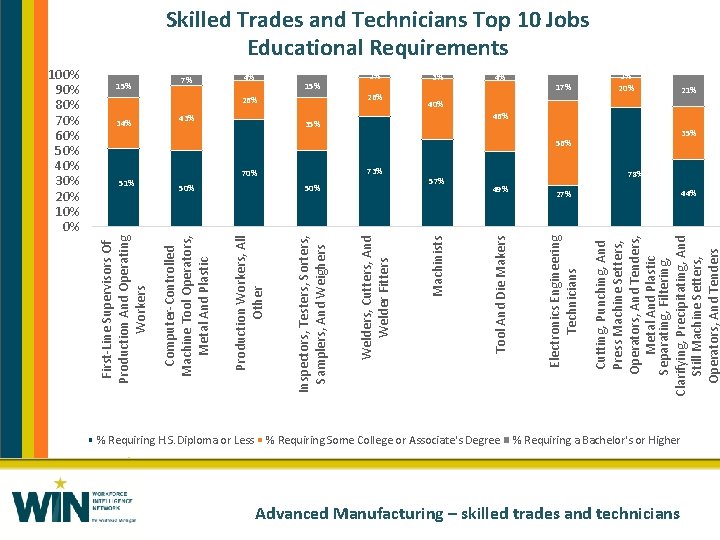
% Requiring H. S. Diploma or Less 70% 50% 73% 50% 57% 49% % Requiring Some College or Associate's Degree 17% Cutting, Punching, And Press Machine Setters, Operators, And Tenders, Metal And Plastic Separating, Filtering, Clarifying, Precipitating, And Still Machine Setters, Operators, And Tenders 35% 4% Electronics Engineering Technicians 43% 26% 3% Tool And Die Makers 26% 2% Machinists 15% Welders, Cutters, And Welder Fitters 51% 4% Inspectors, Testers, Sorters, Samplers, And Weighers 34% 7% Production Workers, All Other 15% Computer-Controlled Machine Tool Operators, Metal And Plastic 100% 90% 80% 70% 60% 50% 40% 30% 20% 10% 0% First-Line Supervisors Of Production And Operating Workers Skilled Trades and Technicians Top 10 Jobs Educational Requirements 2% 20% 40% 56% 27% % Requiring a Bachelor's or Higher Advanced Manufacturing – skilled trades and technicians 21% 46% 35% 78% 44%

Section two ENGINEERING & DESIGN
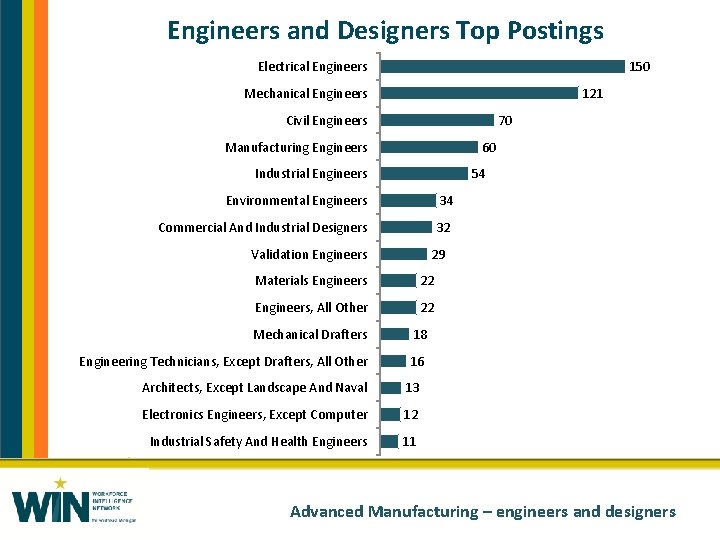
Engineers and Designers Top Postings Electrical Engineers 150 Mechanical Engineers 121 Civil Engineers 70 Manufacturing Engineers 60 Industrial Engineers 54 Environmental Engineers 34 Commercial And Industrial Designers 32 29 Validation Engineers Materials Engineers 22 Engineers, All Other 22 Mechanical Drafters 18 Engineering Technicians, Except Drafters, All Other 16 Architects, Except Landscape And Naval 13 Electronics Engineers, Except Computer 12 Industrial Safety And Health Engineers 11 Advanced Manufacturing – engineers and designers
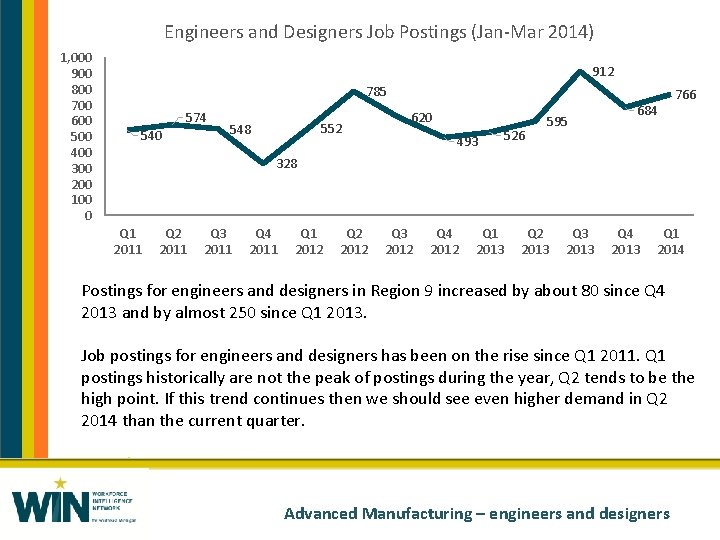
Engineers and Designers Job Postings (Jan-Mar 2014) 1, 000 900 800 700 600 500 400 300 200 100 0 912 785 574 540 552 548 620 493 526 595 684 766 328 Q 1 2011 Q 2 2011 Q 3 2011 Q 4 2011 Q 1 2012 Q 2 2012 Q 3 2012 Q 4 2012 Q 1 2013 Q 2 2013 Q 3 2013 Q 4 2013 Q 1 2014 Postings for engineers and designers in Region 9 increased by about 80 since Q 4 2013 and by almost 250 since Q 1 2013. Job postings for engineers and designers has been on the rise since Q 1 2011. Q 1 postings historically are not the peak of postings during the year, Q 2 tends to be the high point. If this trend continues then we should see even higher demand in Q 2 2014 than the current quarter. Advanced Manufacturing – engineers and designers
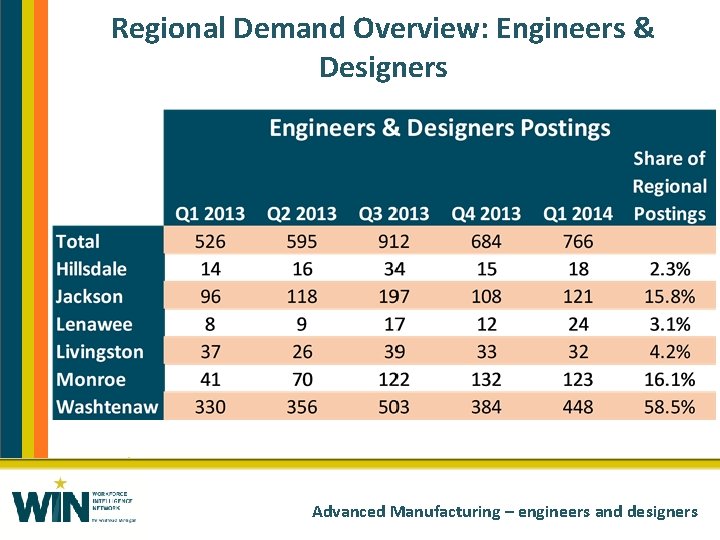
Regional Demand Overview: Engineers & Designers Advanced Manufacturing – engineers and designers
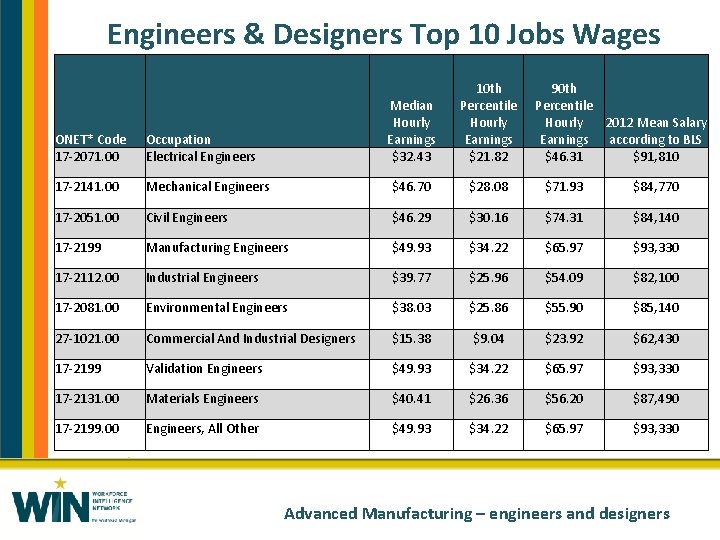
Engineers & Designers Top 10 Jobs Wages Median Hourly Earnings $32. 43 10 th Percentile Hourly Earnings $21. 82 90 th Percentile Hourly 2012 Mean Salary Earnings according to BLS $46. 31 $91, 810 ONET* Code 17 -2071. 00 Occupation Electrical Engineers 17 -2141. 00 Mechanical Engineers $46. 70 $28. 08 $71. 93 $84, 770 17 -2051. 00 Civil Engineers $46. 29 $30. 16 $74. 31 $84, 140 17 -2199 Manufacturing Engineers $49. 93 $34. 22 $65. 97 $93, 330 17 -2112. 00 Industrial Engineers $39. 77 $25. 96 $54. 09 $82, 100 17 -2081. 00 Environmental Engineers $38. 03 $25. 86 $55. 90 $85, 140 27 -1021. 00 Commercial And Industrial Designers $15. 38 $9. 04 $23. 92 $62, 430 17 -2199 Validation Engineers $49. 93 $34. 22 $65. 97 $93, 330 17 -2131. 00 Materials Engineers $40. 41 $26. 36 $56. 20 $87, 490 17 -2199. 00 Engineers, All Other $49. 93 $34. 22 $65. 97 $93, 330 Advanced Manufacturing – engineers and designers
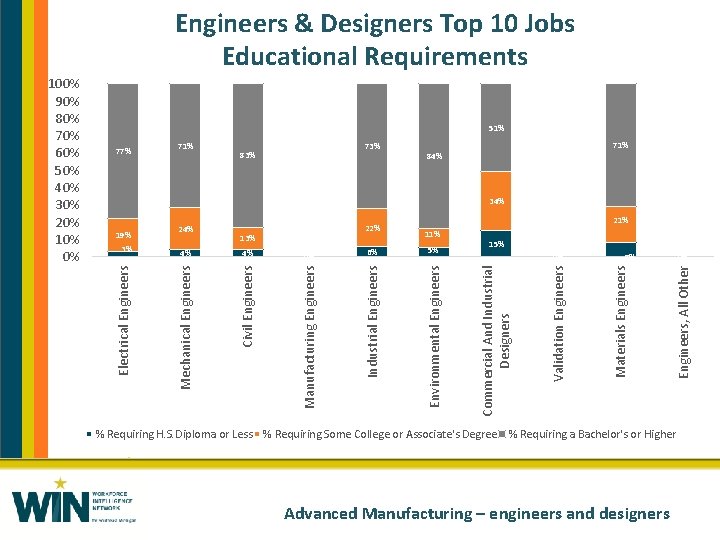
Engineers & Designers Top 10 Jobs Educational Requirements 51% 77% 71% 73% 83% 71% 84% 34% 0% 0% 0% 8% Engineers, All Other 15% Materials Engineers 5% Validation Engineers 6% Commercial And Industrial Designers 0% 11% Environmental Engineers 4% Manufacturing Engineers 4% 21% Industrial Engineers 22% 13% Civil Engineers 3% 24% Mechanical Engineers 19% Electrical Engineers 100% 90% 80% 70% 60% 50% 40% 30% 20% 10% 0% % Requiring H. S. Diploma or Less % Requiring Some College or Associate's Degree % Requiring a Bachelor's or Higher Advanced Manufacturing – engineers and designers

Section two INFORMATION TECHNOLOGY
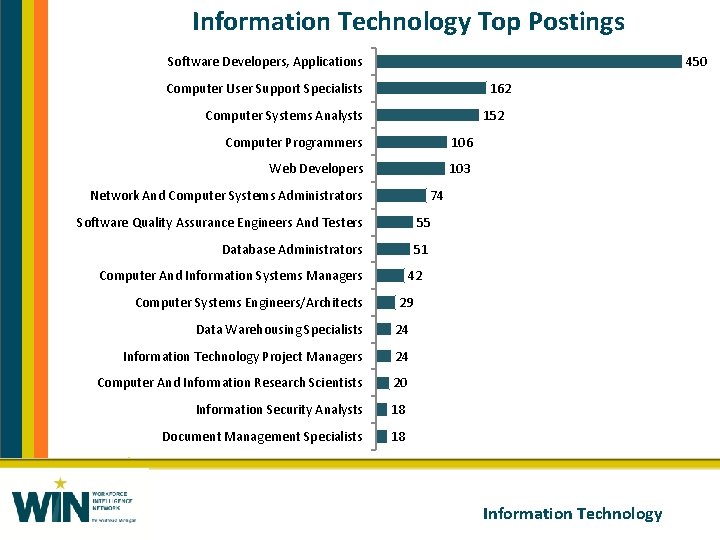
Information Technology Top Postings Software Developers, Applications 450 Computer User Support Specialists 162 Computer Systems Analysts 152 Computer Programmers 106 Web Developers 103 74 Network And Computer Systems Administrators Software Quality Assurance Engineers And Testers 55 Database Administrators 51 Computer And Information Systems Managers 42 Computer Systems Engineers/Architects 29 Data Warehousing Specialists 24 Information Technology Project Managers 24 Computer And Information Research Scientists 20 Information Security Analysts 18 Document Management Specialists 18 Information Technology
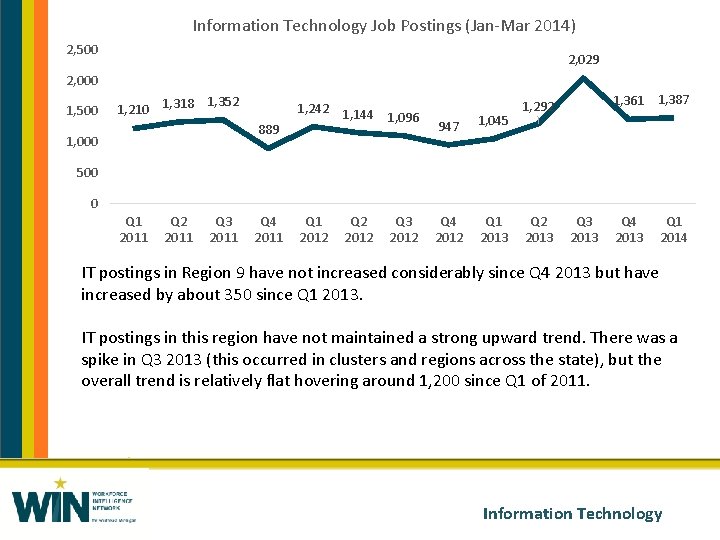
Information Technology Job Postings (Jan-Mar 2014) 2, 500 2, 029 2, 000 1, 500 1, 352 1, 210 1, 318 889 1, 000 1, 242 1, 144 1, 096 947 1, 045 Q 4 2012 Q 1 2013 1, 361 1, 387 1, 292 500 0 Q 1 2011 Q 2 2011 Q 3 2011 Q 4 2011 Q 1 2012 Q 2 2012 Q 3 2012 Q 2 2013 Q 3 2013 Q 4 2013 Q 1 2014 IT postings in Region 9 have not increased considerably since Q 4 2013 but have increased by about 350 since Q 1 2013. IT postings in this region have not maintained a strong upward trend. There was a spike in Q 3 2013 (this occurred in clusters and regions across the state), but the overall trend is relatively flat hovering around 1, 200 since Q 1 of 2011. Information Technology
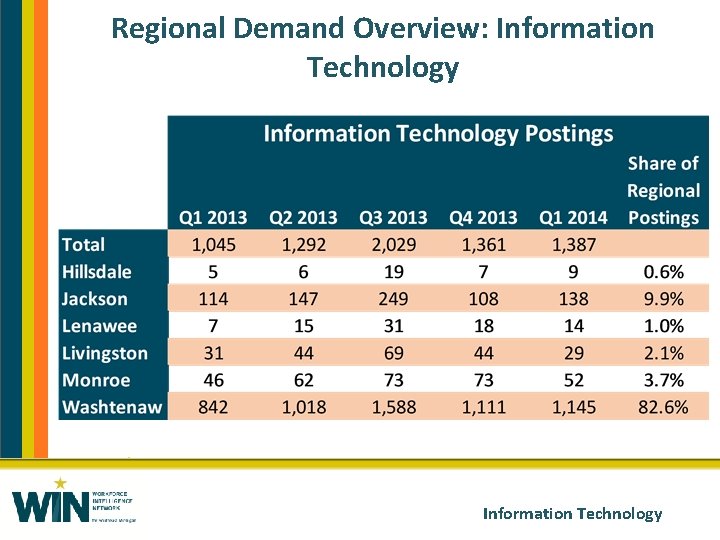
Regional Demand Overview: Information Technology
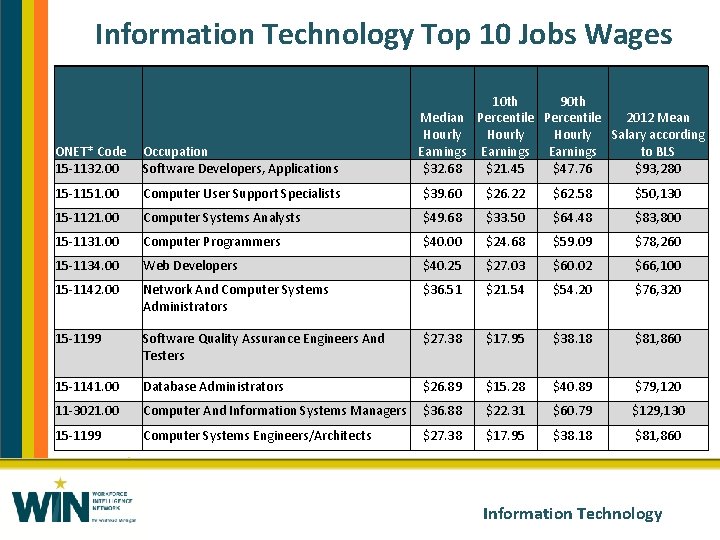
Information Technology Top 10 Jobs Wages 10 th 90 th Median Percentile 2012 Mean Hourly Salary according Earnings to BLS $32. 68 $21. 45 $47. 76 $93, 280 ONET* Code 15 -1132. 00 Occupation Software Developers, Applications 15 -1151. 00 Computer User Support Specialists $39. 60 $26. 22 $62. 58 $50, 130 15 -1121. 00 Computer Systems Analysts $49. 68 $33. 50 $64. 48 $83, 800 15 -1131. 00 Computer Programmers $40. 00 $24. 68 $59. 09 $78, 260 15 -1134. 00 Web Developers $40. 25 $27. 03 $60. 02 $66, 100 15 -1142. 00 Network And Computer Systems Administrators $36. 51 $21. 54 $54. 20 $76, 320 15 -1199 Software Quality Assurance Engineers And Testers $27. 38 $17. 95 $38. 18 $81, 860 15 -1141. 00 Database Administrators $26. 89 $15. 28 $40. 89 $79, 120 11 -3021. 00 Computer And Information Systems Managers $36. 88 $22. 31 $60. 79 $129, 130 15 -1199 Computer Systems Engineers/Architects $27. 38 $17. 95 $38. 18 $81, 860 Information Technology
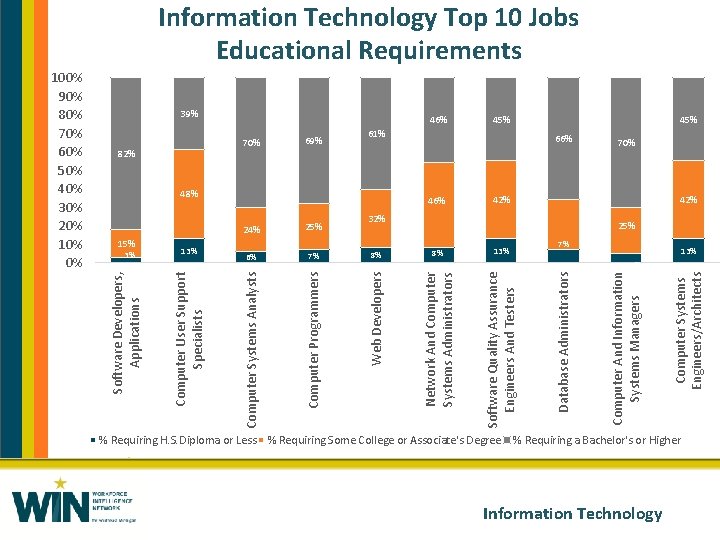
15% 3% 6% 7% 8% 8% Network And Computer Systems Administrators 69% 48% 46% 45% 61% 66% 42% 32% 13% Information Technology Computer Systems Engineers/Architects 70% Computer And Information Systems Managers 46% Database Administrators 39% Software Quality Assurance Engineers And Testers 25% Web Developers 13% 24% Computer Programmers 82% Computer Systems Analysts Computer User Support Specialists 100% 90% 80% 70% 60% 50% 40% 30% 20% 10% 0% Software Developers, Applications Information Technology Top 10 Jobs Educational Requirements 45% 70% 42% 25% 7% 13% 5% % Requiring H. S. Diploma or Less % Requiring Some College or Associate's Degree % Requiring a Bachelor's or Higher

Section two HEALTH CARE
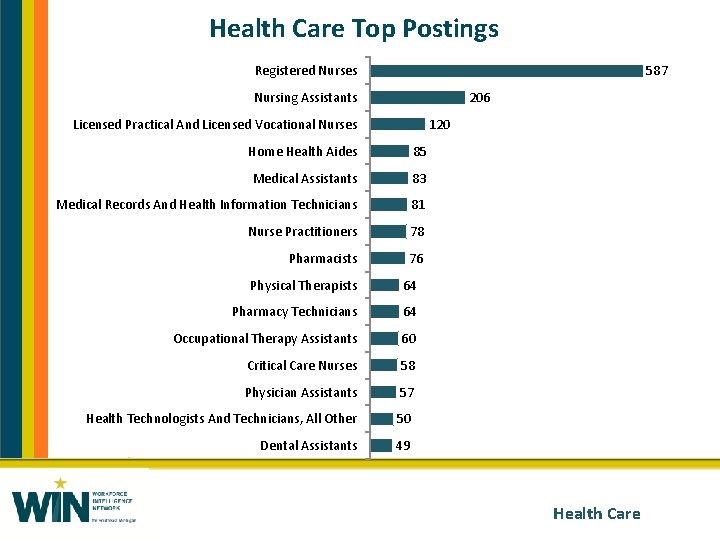
Health Care Top Postings Registered Nurses 587 Nursing Assistants 206 Licensed Practical And Licensed Vocational Nurses 120 Home Health Aides 85 Medical Assistants 83 Medical Records And Health Information Technicians 81 Nurse Practitioners 78 Pharmacists 76 Physical Therapists 64 Pharmacy Technicians 64 Occupational Therapy Assistants 60 Critical Care Nurses 58 Physician Assistants 57 Health Technologists And Technicians, All Other 50 Dental Assistants 49 Health Care
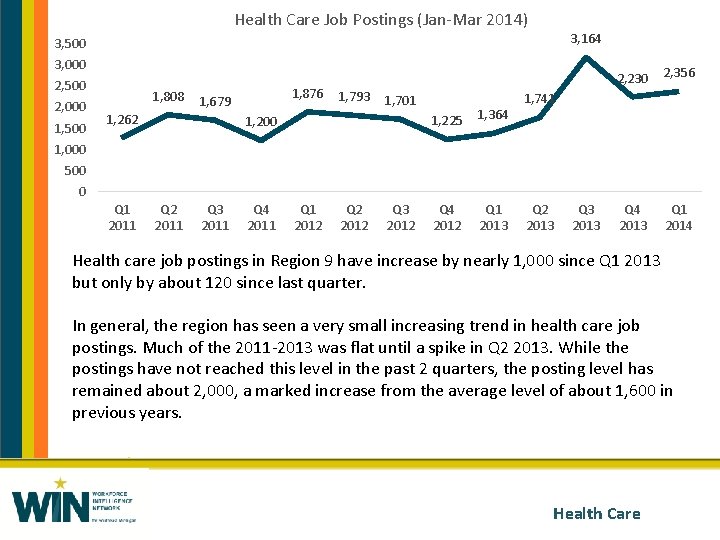
Health Care Job Postings (Jan-Mar 2014) 3, 164 3, 500 3, 000 2, 500 2, 000 1, 500 1, 808 1, 876 1, 679 1, 262 1, 793 1, 701 1, 200 1, 225 1, 364 Q 4 2012 Q 1 2013 2, 230 2, 356 Q 4 2013 Q 1 2014 1, 741 1, 000 500 0 Q 1 2011 Q 2 2011 Q 3 2011 Q 4 2011 Q 1 2012 Q 2 2012 Q 3 2012 Q 2 2013 Q 3 2013 Health care job postings in Region 9 have increase by nearly 1, 000 since Q 1 2013 but only by about 120 since last quarter. In general, the region has seen a very small increasing trend in health care job postings. Much of the 2011 -2013 was flat until a spike in Q 2 2013. While the postings have not reached this level in the past 2 quarters, the posting level has remained about 2, 000, a marked increase from the average level of about 1, 600 in previous years. Health Care
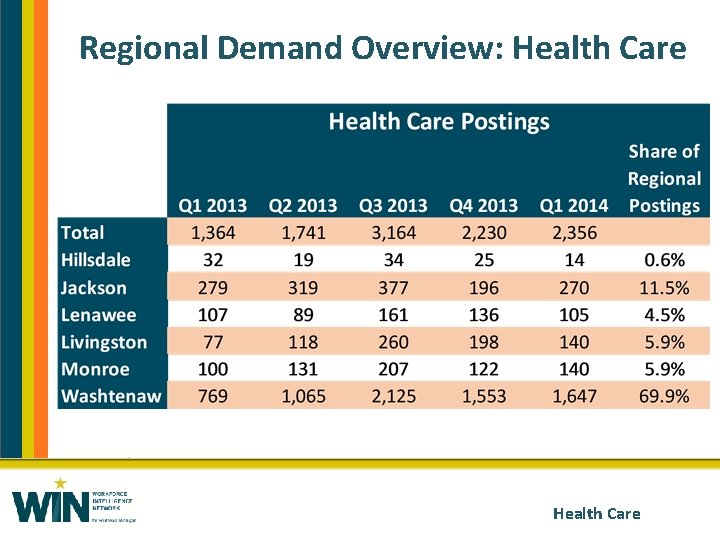
Regional Demand Overview: Health Care
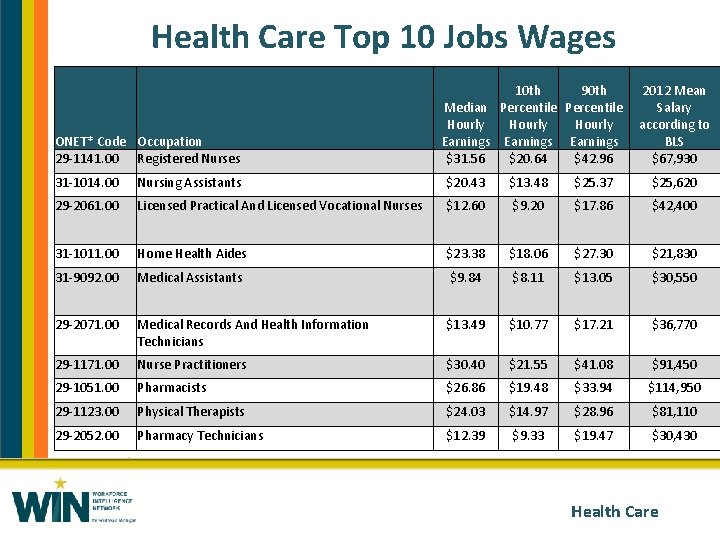
Health Care Top 10 Jobs Wages ONET* Code Occupation 29 -1141. 00 Registered Nurses 10 th 90 th Median Percentile Hourly Earnings $31. 56 $20. 64 $42. 96 2012 Mean Salary according to BLS $67, 930 31 -1014. 00 Nursing Assistants $20. 43 $13. 48 $25. 37 $25, 620 29 -2061. 00 Licensed Practical And Licensed Vocational Nurses $12. 60 $9. 20 $17. 86 $42, 400 31 -1011. 00 Home Health Aides $23. 38 $18. 06 $27. 30 $21, 830 31 -9092. 00 Medical Assistants $9. 84 $8. 11 $13. 05 $30, 550 29 -2071. 00 Medical Records And Health Information Technicians $13. 49 $10. 77 $17. 21 $36, 770 29 -1171. 00 Nurse Practitioners $30. 40 $21. 55 $41. 08 $91, 450 29 -1051. 00 Pharmacists $26. 86 $19. 48 $33. 94 $114, 950 29 -1123. 00 Physical Therapists $24. 03 $14. 97 $28. 96 $81, 110 29 -2052. 00 Pharmacy Technicians $12. 39 $9. 33 $19. 47 $30, 430 Health Care
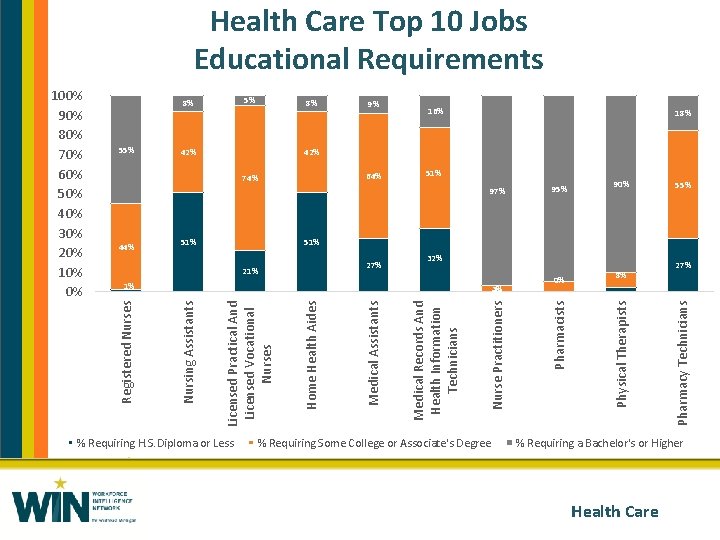
Health Care Top 10 Jobs Educational Requirements 5% 8% 8% 42% 9% 16% 18% 42% 64% 74% 51% 97% 51% 27% 21% 32% 1% % Requiring H. S. Diploma or Less Nurse Practitioners Medical Records And Health Information Technicians Medical Assistants Home Health Aides Licensed Practical And Licensed Vocational Nurses 3% 0% Nursing Assistants 55% % Requiring Some College or Associate's Degree 0% 8% 2% 27% Pharmacy Technicians 51% 90% Physical Therapists 44% 95% Pharmacists 55% Registered Nurses 100% 90% 80% 70% 60% 50% 40% 30% 20% 10% 0% % Requiring a Bachelor's or Higher Health Care

Section two RETAIL & HOSPITALITY
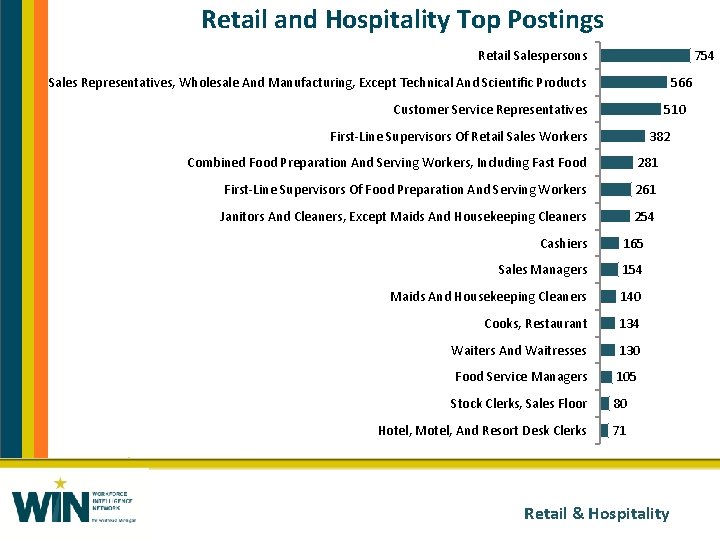
Retail and Hospitality Top Postings Retail Salespersons 754 Sales Representatives, Wholesale And Manufacturing, Except Technical And Scientific Products 566 Customer Service Representatives 510 First-Line Supervisors Of Retail Sales Workers 382 Combined Food Preparation And Serving Workers, Including Fast Food 281 First-Line Supervisors Of Food Preparation And Serving Workers 261 Janitors And Cleaners, Except Maids And Housekeeping Cleaners 254 Cashiers 165 Sales Managers 154 Maids And Housekeeping Cleaners 140 Cooks, Restaurant 134 Waiters And Waitresses 130 Food Service Managers 105 Stock Clerks, Sales Floor 80 Hotel, Motel, And Resort Desk Clerks 71 Retail & Hospitality
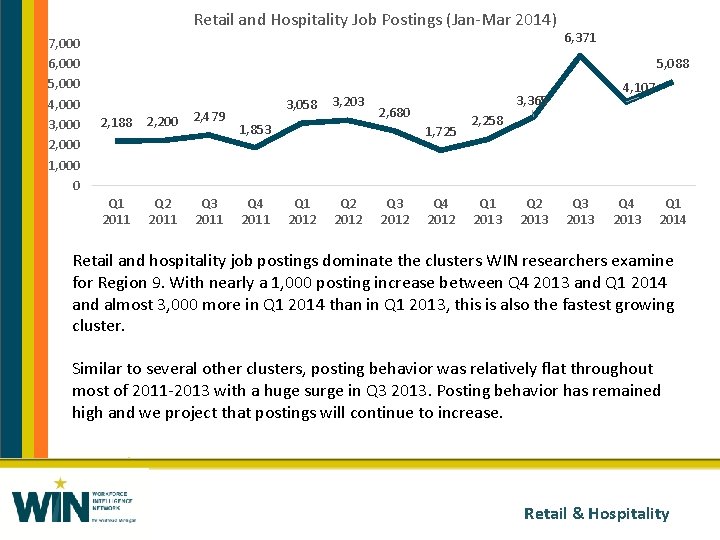
Retail and Hospitality Job Postings (Jan-Mar 2014) 7, 000 6, 000 5, 000 4, 000 3, 000 2, 000 1, 000 0 6, 371 5, 088 2, 188 2, 200 2, 479 Q 1 2011 Q 2 2011 Q 3 2011 3, 058 3, 203 1, 853 Q 4 2011 2, 680 1, 725 Q 1 2012 Q 2 2012 Q 3 2012 4, 107 3, 365 Q 4 2012 2, 258 Q 1 2013 Q 2 2013 Q 3 2013 Q 4 2013 Q 1 2014 Retail and hospitality job postings dominate the clusters WIN researchers examine for Region 9. With nearly a 1, 000 posting increase between Q 4 2013 and Q 1 2014 and almost 3, 000 more in Q 1 2014 than in Q 1 2013, this is also the fastest growing cluster. Similar to several other clusters, posting behavior was relatively flat throughout most of 2011 -2013 with a huge surge in Q 3 2013. Posting behavior has remained high and we project that postings will continue to increase. Retail & Hospitality
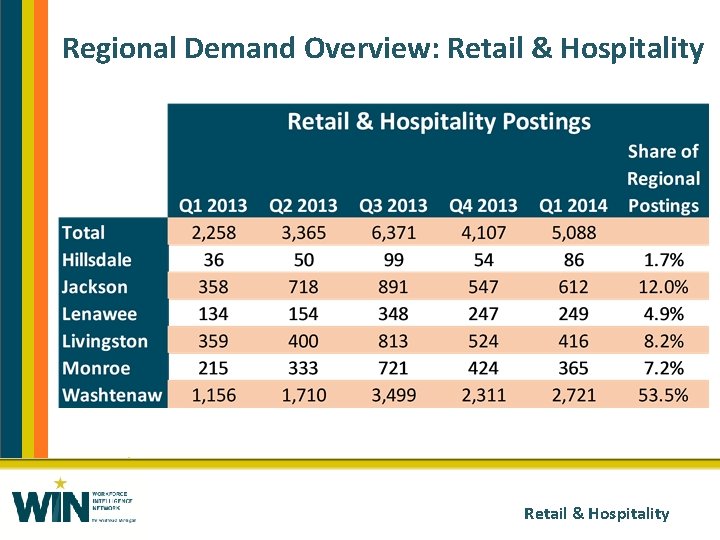
Regional Demand Overview: Retail & Hospitality
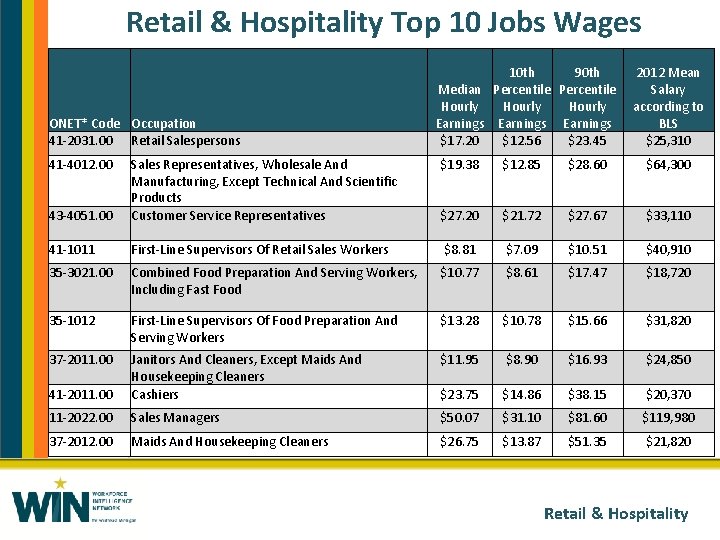
Retail & Hospitality Top 10 Jobs Wages ONET* Code Occupation 41 -2031. 00 Retail Salespersons 41 -4012. 00 10 th 90 th Median Percentile Hourly Earnings $17. 20 $12. 56 $23. 45 2012 Mean Salary according to BLS $25, 310 $19. 38 $12. 85 $28. 60 $64, 300 43 -4051. 00 Sales Representatives, Wholesale And Manufacturing, Except Technical And Scientific Products Customer Service Representatives $27. 20 $21. 72 $27. 67 $33, 110 41 -1011 First-Line Supervisors Of Retail Sales Workers $8. 81 $7. 09 $10. 51 $40, 910 35 -3021. 00 Combined Food Preparation And Serving Workers, Including Fast Food $10. 77 $8. 61 $17. 47 $18, 720 35 -1012 First-Line Supervisors Of Food Preparation And Serving Workers $13. 28 $10. 78 $15. 66 $31, 820 37 -2011. 00 $11. 95 $8. 90 $16. 93 $24, 850 41 -2011. 00 Janitors And Cleaners, Except Maids And Housekeeping Cleaners Cashiers $23. 75 $14. 86 $38. 15 $20, 370 11 -2022. 00 Sales Managers $50. 07 $31. 10 $81. 60 $119, 980 37 -2012. 00 Maids And Housekeeping Cleaners $26. 75 $13. 87 $51. 35 $21, 820 Retail & Hospitality
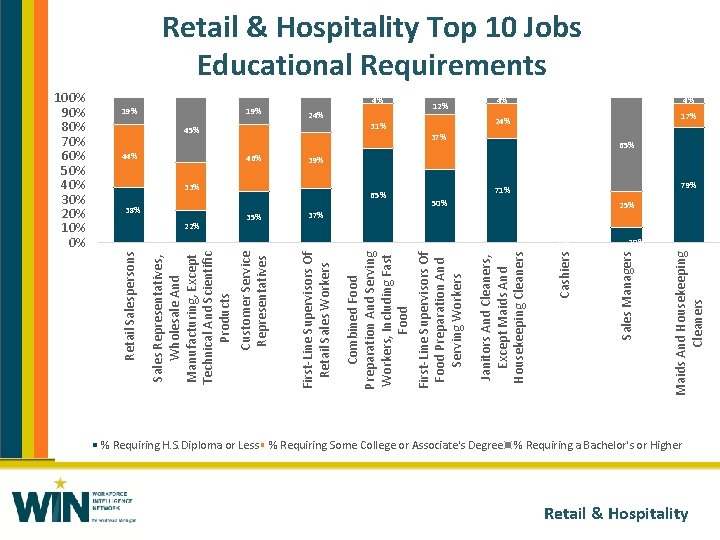
33% 38% 22% 65% 35% 24% 37% 71% 37% 50% 0% 0% Maids And Housekeeping Cleaners 45% 31% Sales Managers 46% 24% 12% Cashiers 44% 4% Janitors And Cleaners, Except Maids And Housekeeping Cleaners 19% Combined Food Preparation And Serving Workers, Including Fast Food First-Line Supervisors Of Food Preparation And Serving Workers 19% First-Line Supervisors Of Retail Sales Workers Sales Representatives, Wholesale And Manufacturing, Except Technical And Scientific Products Customer Service Representatives 100% 90% 80% 70% 60% 50% 40% 30% 20% 10% 0% Retail Salespersons Retail & Hospitality Top 10 Jobs Educational Requirements 4% 4% 17% 65% 39% 79% 25% 10% % Requiring H. S. Diploma or Less % Requiring Some College or Associate's Degree % Requiring a Bachelor's or Higher Retail & Hospitality

Section two AGRICULTURE
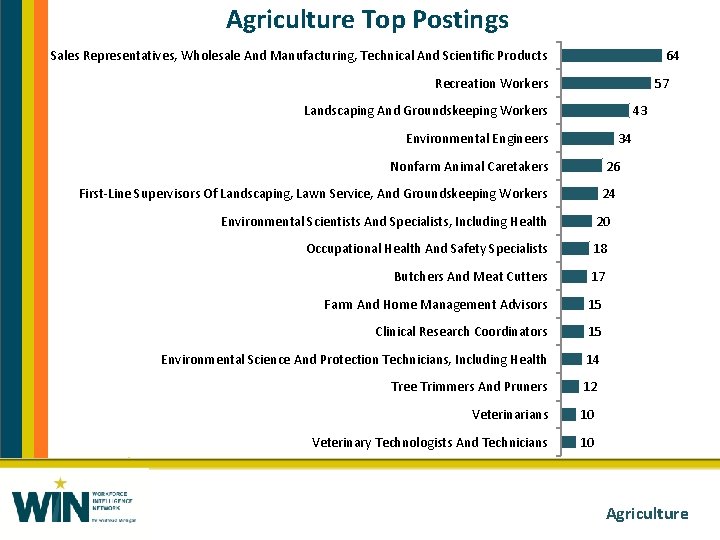
Agriculture Top Postings Sales Representatives, Wholesale And Manufacturing, Technical And Scientific Products 64 Recreation Workers 57 Landscaping And Groundskeeping Workers 43 Environmental Engineers 34 Nonfarm Animal Caretakers 26 First-Line Supervisors Of Landscaping, Lawn Service, And Groundskeeping Workers 24 Environmental Scientists And Specialists, Including Health 20 Occupational Health And Safety Specialists 18 Butchers And Meat Cutters 17 Farm And Home Management Advisors 15 Clinical Research Coordinators 15 Environmental Science And Protection Technicians, Including Health 14 Tree Trimmers And Pruners 12 Veterinarians 10 Veterinary Technologists And Technicians 10 Agriculture
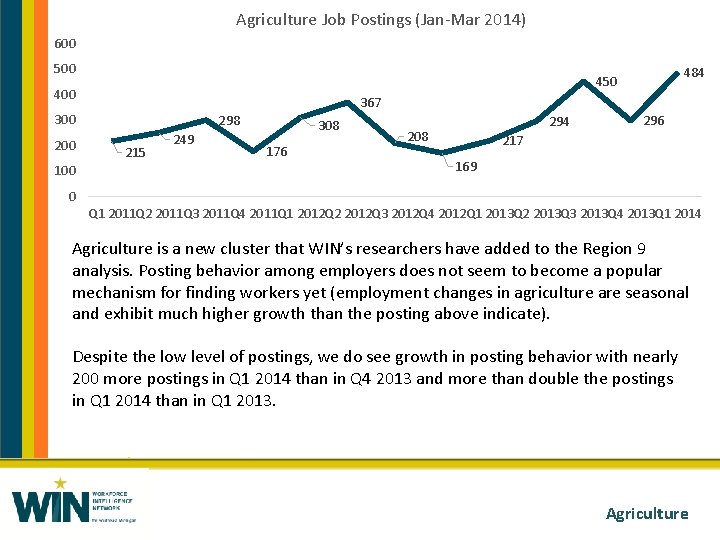
Agriculture Job Postings (Jan-Mar 2014) 600 500 400 367 300 200 100 484 450 298 215 249 308 176 294 208 296 217 169 0 Q 1 2011 Q 2 2011 Q 3 2011 Q 4 2011 Q 1 2012 Q 2 2012 Q 3 2012 Q 4 2012 Q 1 2013 Q 2 2013 Q 3 2013 Q 4 2013 Q 1 2014 Agriculture is a new cluster that WIN’s researchers have added to the Region 9 analysis. Posting behavior among employers does not seem to become a popular mechanism for finding workers yet (employment changes in agriculture are seasonal and exhibit much higher growth than the posting above indicate). Despite the low level of postings, we do see growth in posting behavior with nearly 200 more postings in Q 1 2014 than in Q 4 2013 and more than double the postings in Q 1 2014 than in Q 1 2013. Agriculture
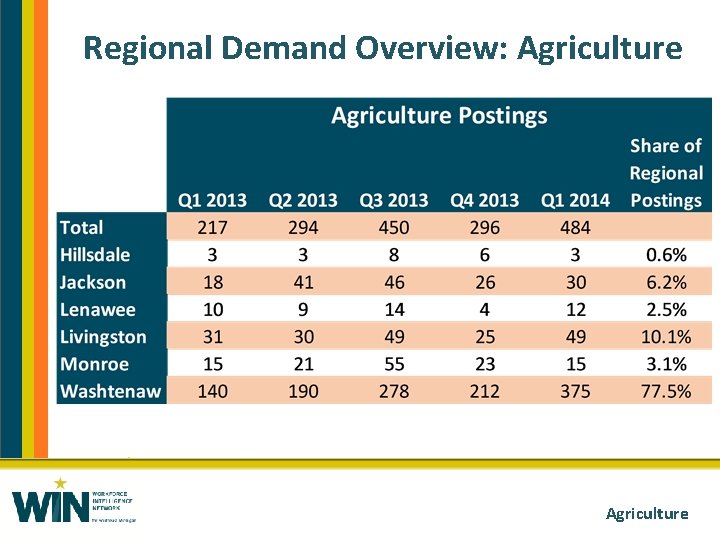
Regional Demand Overview: Agriculture
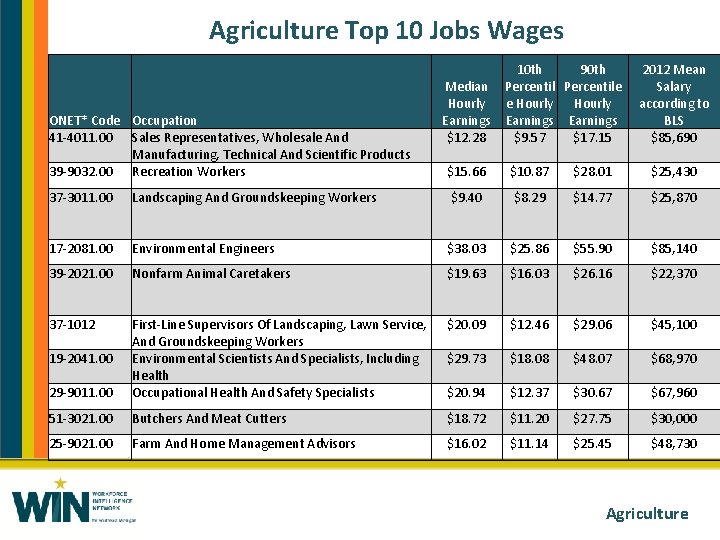
Agriculture Top 10 Jobs Wages ONET* Code Occupation 41 -4011. 00 Sales Representatives, Wholesale And Manufacturing, Technical And Scientific Products 39 -9032. 00 Recreation Workers 10 th 90 th Median Percentile Hourly Earnings $12. 28 $9. 57 $17. 15 2012 Mean Salary according to BLS $85, 690 $15. 66 $10. 87 $28. 01 $25, 430 37 -3011. 00 Landscaping And Groundskeeping Workers $9. 40 $8. 29 $14. 77 $25, 870 17 -2081. 00 Environmental Engineers $38. 03 $25. 86 $55. 90 $85, 140 39 -2021. 00 Nonfarm Animal Caretakers $19. 63 $16. 03 $26. 16 $22, 370 37 -1012 $20. 09 $12. 46 $29. 06 $45, 100 $29. 73 $18. 08 $48. 07 $68, 970 29 -9011. 00 First-Line Supervisors Of Landscaping, Lawn Service, And Groundskeeping Workers Environmental Scientists And Specialists, Including Health Occupational Health And Safety Specialists $20. 94 $12. 37 $30. 67 $67, 960 51 -3021. 00 Butchers And Meat Cutters $18. 72 $11. 20 $27. 75 $30, 000 25 -9021. 00 Farm And Home Management Advisors $16. 02 $11. 14 $25. 45 $48, 730 19 -2041. 00 Agriculture
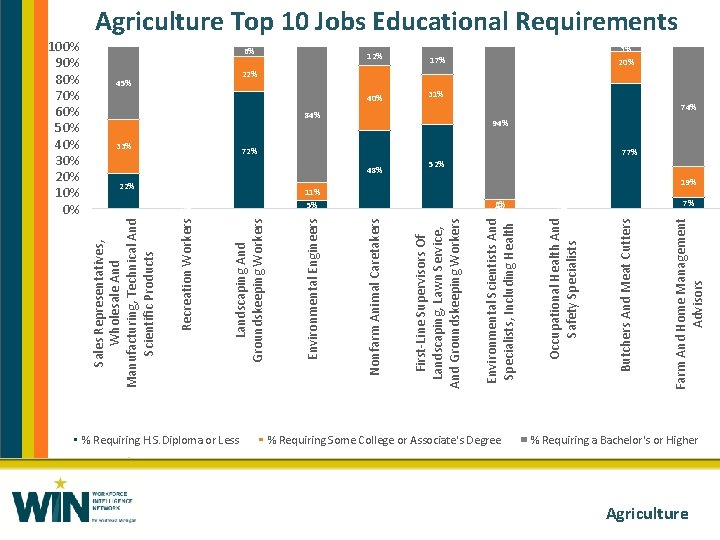
% Requiring H. S. Diploma or Less 31% 84% 72% 48% 11% 5% 6% 0% % Requiring Some College or Associate's Degree 0% 0% Farm And Home Management Advisors 0% 40% Butchers And Meat Cutters 22% 17% Occupational Health And Safety Specialists 22% 12% Environmental Scientists And Specialists, Including Health 33% First-Line Supervisors Of Landscaping, Lawn Service, And Groundskeeping Workers 6% Nonfarm Animal Caretakers 45% Environmental Engineers Landscaping And Groundskeeping Workers Recreation Workers 100% 90% 80% 70% 60% 50% 40% 30% 20% 10% 0% Sales Representatives, Wholesale And Manufacturing, Technical And Scientific Products Agriculture Top 10 Jobs Educational Requirements 3% 20% 74% 94% 52% 77% 19% 7% % Requiring a Bachelor's or Higher Agriculture
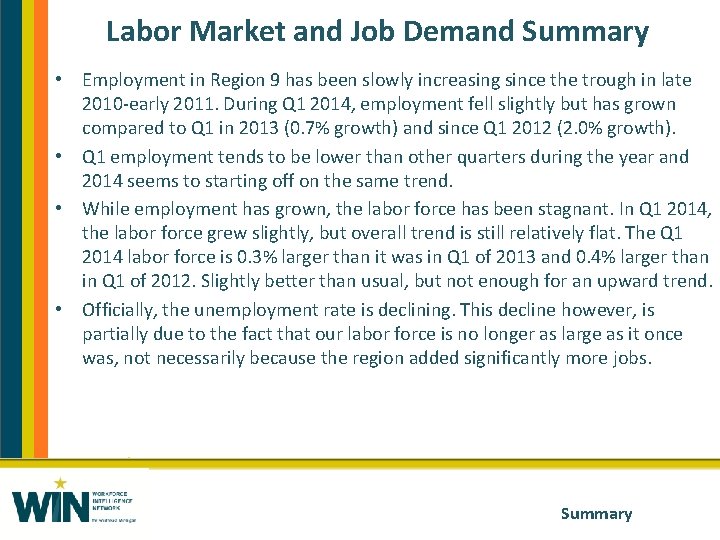
Labor Market and Job Demand Summary • Employment in Region 9 has been slowly increasing since the trough in late 2010 -early 2011. During Q 1 2014, employment fell slightly but has grown compared to Q 1 in 2013 (0. 7% growth) and since Q 1 2012 (2. 0% growth). • Q 1 employment tends to be lower than other quarters during the year and 2014 seems to starting off on the same trend. • While employment has grown, the labor force has been stagnant. In Q 1 2014, the labor force grew slightly, but overall trend is still relatively flat. The Q 1 2014 labor force is 0. 3% larger than it was in Q 1 of 2013 and 0. 4% larger than in Q 1 of 2012. Slightly better than usual, but not enough for an upward trend. • Officially, the unemployment rate is declining. This decline however, is partially due to the fact that our labor force is no longer as large as it once was, not necessarily because the region added significantly more jobs. Summary
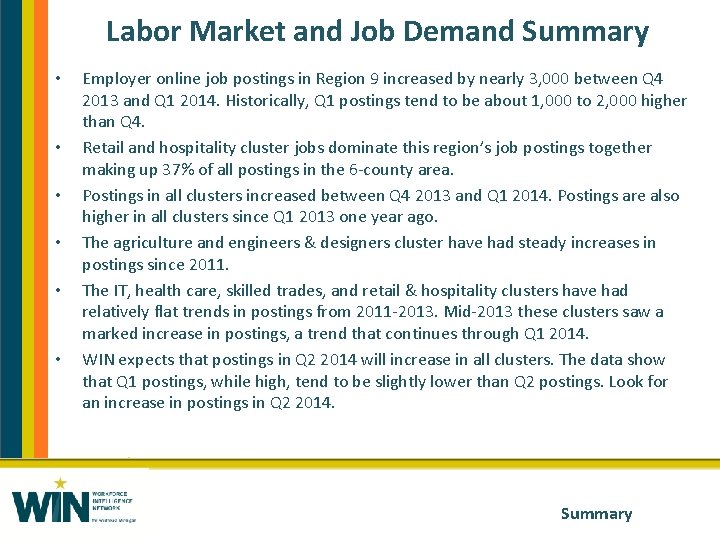
Labor Market and Job Demand Summary • • • Employer online job postings in Region 9 increased by nearly 3, 000 between Q 4 2013 and Q 1 2014. Historically, Q 1 postings tend to be about 1, 000 to 2, 000 higher than Q 4. Retail and hospitality cluster jobs dominate this region’s job postings together making up 37% of all postings in the 6 -county area. Postings in all clusters increased between Q 4 2013 and Q 1 2014. Postings are also higher in all clusters since Q 1 2013 one year ago. The agriculture and engineers & designers cluster have had steady increases in postings since 2011. The IT, health care, skilled trades, and retail & hospitality clusters have had relatively flat trends in postings from 2011 -2013. Mid-2013 these clusters saw a marked increase in postings, a trend that continues through Q 1 2014. WIN expects that postings in Q 2 2014 will increase in all clusters. The data show that Q 1 postings, while high, tend to be slightly lower than Q 2 postings. Look for an increase in postings in Q 2 2014. Summary

https: //ssgresearch. com/WIN-SPARK 60

Section three DATA NOTES AND SOURCES
Special data notes • Quarterly reports: Due to a data update in Burning Glass Technologies’ Labor Insight tool, comparisons should not be made between data from each quarterly report. • Adjustments to the labor force information were also made to reflect and incorporate updated inputs, re-estimation, and controlling to new statewide totals. More information can be found here: http: //www. bls. gov/launews 1. htm • All numbers included in this report are the correct and updated data. • Wage and educational attainment data available varies depending on the occupation. Some occupations with a detailed 8 -digit code do not have specific wage and educational attainment data available. In this case, we show the data for the 6 -digit code that aligns with the 8 -digit to get a closest match.
Understanding clusters • Rather than focusing on talent demand within industries (types of firms), WIN generally emphasizes exploring talent demand based on occupations, including the skills, educational credentials, and experience needed to work in them. • WIN research examines industry data, as the health of companies can be useful for economic development purposes. However, shifting focus from industry to occupation is important as different types of occupations with extremely different skillsets may work within and across industries. For example, accountants, computer specialists, and engineers all may work in the manufacturing industry. • By clustering occupations, the talent system can identify employer demand for particular skillsets across multiple industry types and develop a response through training and pipeline development to meet that demand. Data notes and sources
Understanding demand vs. employment • Employment refers to actual employment numbers—the number of people in jobs—in targeted industries or occupations. • Demand refers to statistics derived from employer job postings, which indicate the potential for employment but may or may not materialize into actual jobs. Data notes and sources
Data sources Labor market demand data for this report was compiled using Burning Glass Technologies’ Labor Insight Tool, and analyzed by the Workforce Intelligence Network. Other data sources include, the Bureau of Labor Statistics, and Economic Modeling Specialists Inc. (EMSI). Check out our website http: //www. win-semich. org for more data and detailed information about our sources. Due to changes in Burning Glass’s aggregation and deduplication method implemented on July 1, 2013, posting counts for Q 3 of 2013 and forward are not directly comparable to those prior to that date. Data notes and sources

For more information about research and data, visit our website: http: //win-semich. org/data-research/
- Slides: 66