Workers in the Decennial Census and in the


 1950")


 State")

 o o o Need to get at individual")


- Slides: 31
Workers in the Decennial Census and in the ACS Census Data for Transportation Planning: Preparing for the Future May 11 -13, 2005 TRB Alan E. Pisarski
Some things never change! “Then there are the incompatibilities in the definitions of a worker in the census and in the standard transportation survey. ” AEP; SR 121, July 1970
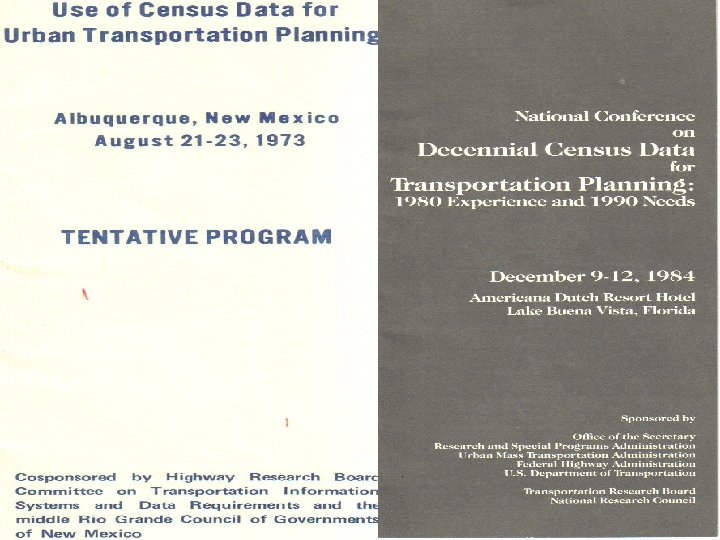
BACKGROUND - A little history o o o Last confs: 1994 and again 1996 First discussion: 1970 HRB SR 121 First of these meetings Aug. 21 -23, 1973 Second Dec. 9 -12 1984 “What happened in last census/what should happen in next? ” THIS HAS THE FLAVOR OF 1994 WHEN WE THOUGHT THE WORLD WOULD CHANGE BUT WERE UNSURE HOW TO ADDRESS IT
Why 2 conferences in 90’s – When ACS was called “continuous monitoring” o o o o 94 Plans for CM/ACS were very unclear– we needed time to clarify and to plan CTPP heavily embedded in process Risk of losing major source of JTW We in transportation community took the subject very seriously “Bet your job” approach too dangerous Census went parallel paths We are better prepared now! (? )
The Worker Question o o o To us the decennial and the ACS are surveys of workers Yes of course demog is very valuable; but the specific transportation interest is all about the worker Worker count and attributes Activity variables associated with the worker: Plus work location
The Worker Question o o Census tabulations do not reflect that No reported workers per se Find workers at mode use tabs; (but that is workers who worked last week) Get workers from labor force
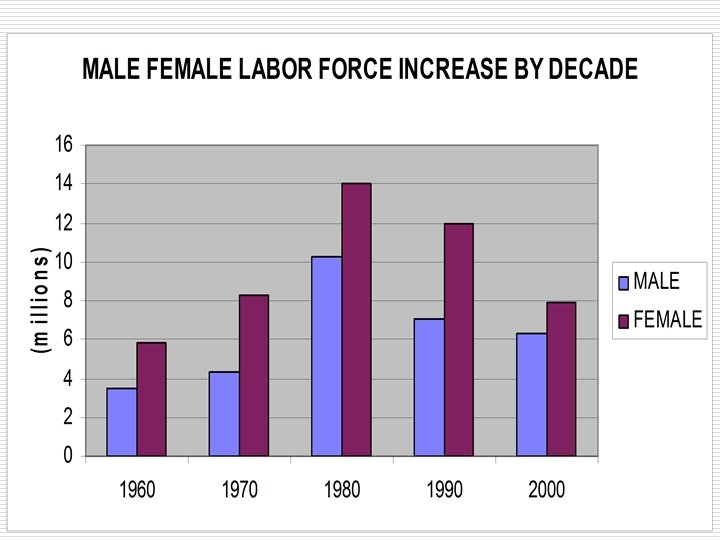
Long term trend in Commuting YEAR 1950 1960 1970 1980 1990 2000 OVERALL CHANGE TOTAL WORKERS (millions) 58. 9 65. 8 78. 6 96. 7 115. 1 128. 3 WORKER INCREASE (millions) WORKER INCREASE % POPULATION INCREASE % 6. 9 12. 8 18. 1 18. 4 13. 2 11. 7 19. 5 23. 0 19. 2 11. 5 18. 5 13. 3 11. 4 9. 7 13. 2 69. 4 117. 8 86. 0
An important pattern to watch – pop vs pop 16 -65 vs Civ LF
Pop/Pop 16 -65/LF trends
Fewer Workers = Fewer Commuters
WE ARE A NATION OF IMMIGRANTS - AGAIN
Decennial / C 2 SS comparisons o o C 2 SS & Census almost identical structures No look at weeks worked or hours Small differences re workers (Nat’l) C 2 SS had higher LF partic and Unemp n n o Census 65. 2% C 2 SS 66. 2% Emp. Status item allocation big difference: n n Census 11. 1% C 2 SS 6. 0% ACS study
Decennial-CPS comparisons Civilian Labor Force CIV LF DECEN CPS DIFF % DIFF (Millions) 1950 58. 2 61. 5 3. 3 5. 67% 1960 67. 5 69. 1 1. 6 2. 37% 1970 80. 1 82. 0 1. 9 2. 37% 1980 104. 4 105. 6 1. 2 1. 15% 1990 123. 5 124. 8 1. 3 1. 05% 2000 137. 7 142. 2 4. 5 3. 27%
2000 APRIL DECEN 2000 DIFFERENCE CPS UNEMPLOYED 7. 9 EMPLOYED 129. 7 CIV LF 137. 7 WORKERS AT WORK 128. 3 5. 2 2. 7 million (50% higher) 136. 9 7. 2 million (5% lower) 142. 2 4. 5 million (3. 2% lower) 135. 4 7. 1 million est. (5. 2% lower)
Compared to CPS o o o Tendency to show Emp as Unemp Census 90% successful in placing CPS employed in employed Census 86% successful in placing CPS not in LF in that category Only 40% successful in placing CPS unemployed in unemployed INDEX OF INCONSISTENCY!
There were group quarters distortions o o o College campuses went wrong somewhere If omit GQ: decennial unemployment rate drops from 5. 8% to 5. 2% - much closer to CPS Athens, Ga. 16 -19 yr olds (10% of pop) with 35% unemployment rates
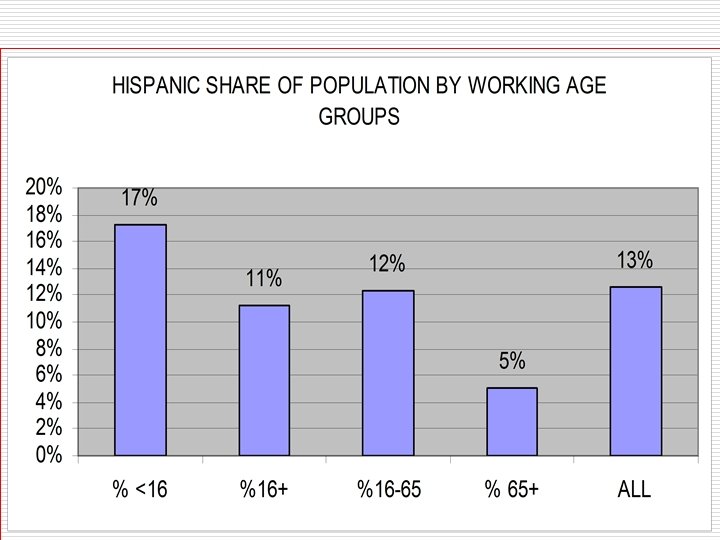
Group Distortions – Emp. /Pop. Variable Cen 2000 April CPS Diff. All 61. 2 64. 6 3. 4 Pop 25+ 62. 2 65. 7 3. 5 Pop 65+ 13. 1 12. 5 -. 6 Male 68. 1 71. 8 3. 7 Female 54. 9 57. 9 3. 0 White 62. 4 65. 1 2. 7 Black 55. 5 61. 4 5. 9 Hispanic 56. 4 66. 1 9. 7
Geographic Distortions o o o In no state is Census higher than CPS in Emp/Pop ratio 32 state’s differences not statistically signif. Some states saw major swings in Emp. n n n CA – 1. 3 million FL –. 5 million TX –. 7 million
Estimates of impacts o o o 7 million worker gap (5? 3? ) State specific? Hispanics not reporting work? Older workers looks too good? Differences strong among young and less educated and some work classes = questions too hard? Is work a more fluid situation?
THE WORK/WORKER VARIABILITY ISSUE o o o MULTI-JOBS PER WORKER PART TIME/OCCASIONAL JOB LOCATION START TIMES MODE/ROUTE NATURE OF WORK
Cannot be resolved now! (? ) o o o Need to get at individual records Not available until microfiching done in 2006! Consider: n n n State impacts? Metro impacts? Other area/functional impacts?
For the Future o o o ACS and CPS benchmarked to census And future benchmarks to same pop estimates Variations will be in emp/pop ratios Will census make linkages more transparent? Is ATUS part of this set? Will we have 3 integrated surveys?
QUESTIONS o o Will we have an official undercount statement from census? Will additional research pin down the issues and problems further? What about state and metro undercounts/overcounts? How big an issue for the future?
Thank you ! Alan E. Pisarski
Recommendations
Some things never change! “Then there are the incompatibilities in the definitions of a worker in the census and in the standard transportation survey. ” AEP; SR 121, July 1970
Some things never change! o o “Then there are the incompatibilities in the definitions of a worker in the census and in the standard transportation survey. ” “Finally there is the problem of relating the work trip to other, more comprehensive transportation measures such as peak hour travel and total trips. ” Alan E. Pisarski, Use of Census Data for Transportation Planning, SR 121, July 1970