Work Charting Methods Topics 1 Pareto Chart part
 Diagram")


- Slides: 19
Work Charting Methods Topics: 1. Pareto Chart – part 1 2. Fishbone (Cause-Effect) Diagram – part 1 3. Operation Process Charts – part 1 4. Flow Process Charts – part 1 5. Flow Diagrams – part 2 6. Worker and Machine Process Charts – part 2 7. Gang Process Charts – part 2 8. Two-Handed Process Charts – part 2
Objectives of Work Charting Methods § Objectively document the work task or process for analysis § Examine some of many available methods (new ones invented regularly) § Break down job into sub-components (tasks) § Describe the tasks in a meaningful way
Work Charting Methods 5. Flow Diagrams
5 - Flow Diagrams § Diagram in a system representing § process flow or § set of dynamic relationships § Supplement flow process charts § Provides overhead pictorial plan of the facility § Examples: § structure and order a complex system § show structure of the elements and their interaction
5 - Flow Diagrams
5 - Flow Diagrams
5 - Flow Diagrams
Work Charting Methods 6. Worker and Machine Process Charts
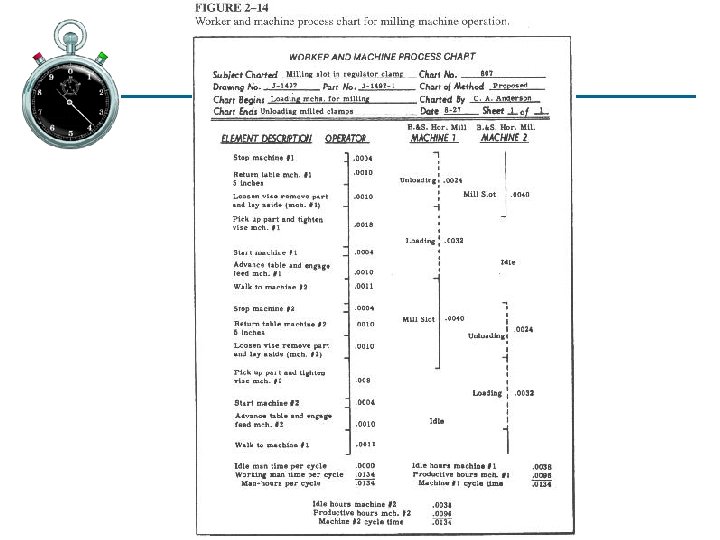
6 - Worker and Machine Process Charts § Show at a single workstation time relationship between: § working cycle of a person and § operating cycle of a machine(s) § Machine times and operator times must be known for each element § Chart drawn vertically to scale § Useful in describing any repetitive workermachine system
6 - Worker and Machine Process Charts § Solid lines represent: productive time § Breaks indicate: idle time § Dotted lines represent: non-productive time
Work Charting Methods 7. Gang Process Charts
7 - Gang Process Charts § These are Worker and Machine Process charts showing § many workers § workers are interacting with a piece of equipment or a machine § Purpose: determine if interaction between workers is efficient and coordinated § Examples: § workers at a coal furnace § workers in a steel mill
7 - Gang Process Charts
7 - Gang Process Charts
Work Charting Methods 8. Two-Handed Process Charts
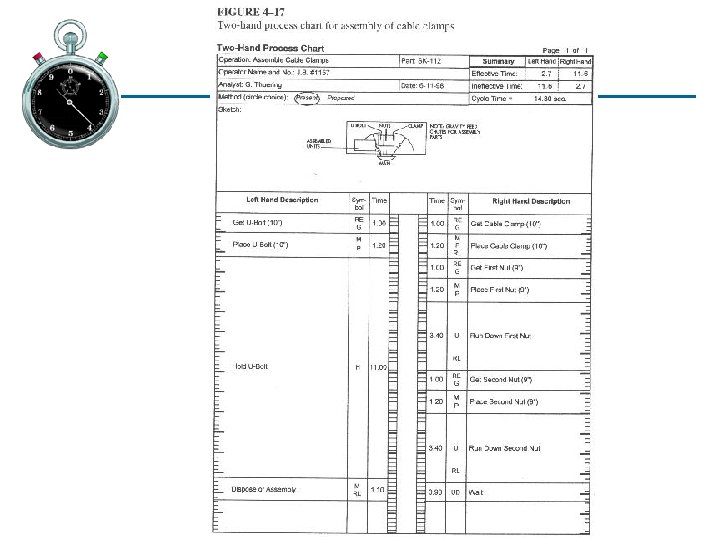
8 - Two-Handed Process Charts § Left-hand / right-hand chart § Operator process chart § Flow process chart directed at an operator § Each hand is documented separately § Activities of worker’s hands (or limbs): recorded in their relationship to one another § Useful when doing work methods analysis
8 - Two-Handed Process Charts