Woodbury Area Hockey Club MEMBER TOWN HALL February

Woodbury Area Hockey Club MEMBER TOWN HALL February 24, 2020

Agenda Welcome & Introductions State of the WAHC – WAHC By The Numbers • Financial Summary • Player Counts / Teams Counts / By High School Boundary • Ice Hours Topics / Initiatives In Focus • Open Positions: Board Terms Expiring / Ice Director / Registrar / Goalie Equipment • Intra-Association Realignment Pilot - 2020 -21 Squirts • Long Term Strategic Planning – Ice Q&A Closing Comments

2019 -20 WAHC BOARD & LEADERSHIP PRESIDENTRyan Warner Ice Scheduler. Aaron Etshokin Administrator. Lonie Nelson Lawful Gambling -Amy Vasterling Treasurer Tom Och VP Administration. Ron Tarlton Registrar – Michelle Chapman Secretary-Dan Weinmeyer VP-Fundraiising Brandy Kane VP-Hosted Tournaments Nick Nyhus VP –Coaching Development Tim O’Connor Webmaster-Troy Noll Co-Hockey Directors-Bolin / Vogelgesang Social Media Coordinator-Jen Sutch Level Director. Bantam M. Tschida Level Director. Peewee B. Rogina Level Director. Squirt K. Zuber VP-Hockey Development Bill Kulesa Goalie Development Director – Reid Nelson Goalie Equipment Coordinator – Brent Thompson VP-Hockey Operations Dan Kraft VP-Girls Hockey Scott Szybatka Level Director. Girls 8 U/6 U VP-Mites, Mini. Mites, Intro Matt Shillings Level Directors Mite/MM- Intro To Hockey Coordinator – Paul Quinn

WAHC Board_By TERM Secretary VP-Coaching VP-Hockey Operations VP-Mites, Minis, Termites, Intro VP-Fundraising Treasurer Mid-Term EXPIRING President VP-Administrative Operations VP-Hockey Development VP-Girls Hockey VP-Hosted Tournaments

WAHC Financial Snapshot BUDGET ACTUAL 2019 -20 2018 -19 2017 -18 2016 -17 1, 002, 090 978, 741 790, 694 7, 993 13, 037 18, 894 3, 480 26, 500 18, 539 17, 542 20, 514 1, 136, 918 1, 033, 666 1, 015, 176 814, 688 1, 135, 748 955, 955 1, 009, 172 829, 737 1, 170 77, 711 6, 004 (15, 049) 120, 000 137, 326 62, 240 86, 810 (20, 000) (15, 015) (100, 000) (117, 327) (47, 240) (71, 795) 509, 053 413, 912 389, 825 Revenue Player Fee Revenue Hosted Tournaments - Net Fundraising - Net Expenses Net Hockey Operations 1, 102, 425 Lawful Gambling - Donations Projects/Programs Funded by Lawful Gambling Player Socks Ice Year End Cash & CDs Balance General Operations
 and 2019 -20 Budget 2013")
WAHC Ice Purchase Summary 2013 -14 thru 2018 -19(actual) and 2019 -20 Budget 2013 -14 2014 -15 2015 -16 2016 -17 2017 -18 2018 -19 2019 -20 BUDGET Health. East Sports Center (Woodbury) Harding Arena (St. Paul) Doug Woog Arena (South St. Paul) Other Facilities TOTAL Average ACTUAL S 1293 1296 1244 1316 1463 1440 1450 1342 800 808 811 763 785 814 800 797 449 361 323 383 482 390 400 398 19 57 23 29 14 24 200 28 2561 2522 2401 2491 2744 2669 2, 850 2565

WAHC YOUTH Player Counts – By Level of Play 2009 -10 thru 2019 -20 ALL PROGRAMS 2009 -10 2010 -11 LEVEL of PLAY Jr Gold/16 U 2011 -12 2012 -13 2013 -14 2014 -15 2015 -16 2016 -17 2017 -18 2018 -19 2019 -20 35 36 45 36 35 34 20 0 37 32 38 Bantam 117 111 104 101 86 93 104 100 95 92 104 Peewee 131 119 106 115 128 118 96 105 128 119 115 Squirt 15 U (14 Upre 2016 -17) 108 17 132 20 141 22 128 24 110 17 102 0 113 0 110 15 116 17 122 18 12 U 41 42 38 45 41 25 31 38 48 41 49 10 U 41 45 46 29 30 41 45 35 47 51 60 8&Under 249 250 241 261 258 256 252 266 308 311 320 Termites 0 0 0 0 0 40 739 755 743 739 705 669 661 654 788 779 866 16 -12 -4 -36 -8 -7 134 -9 87 2. 2% -1. 6% -0. 5% -4. 6% -5. 1% -1. 2% -1. 1% 20. 5% -1. 1% 11. 2% TOTAL Increase/(Decrease) % change
 2015 -16 Association Osseo/Maple Grove Woodbury Eagan")
Player Count Comparative City Population (2018 -19) 2015 -16 Association Osseo/Maple Grove Woodbury Eagan Eden Prairie Lakeville Burnsville Minnetonka Apple Valley St. Louis Park Stillwater Population 65000 68000 67000 62000 60000 51000 50000 45000 2018 -19 Association Membership Population (a) Membership (b) 1099 650 515 526 818 336 965 249 336 920 73800 69800 66600 64400 63700 61400 53100 52400 49000 19400 1155 778 467 462 771 124 1029 301 380 868 (a) source: '2017' population per http: //worldpopulationreview. com/us-cities (b) source: Todd Elmer-USA Hockey MN District Registrar 1. 6% 1. 1% 0. 7% 1. 2% 0. 2% 1. 9% 0. 6% 0. 8% 4. 5%

WAHC Player Counts & Team Counts YOUTH & GIRLS 2016 -17 thru 2019 -20 YOUTH & GIRLS PROGRAMS – PLAYER COUNTS 2016 -17 2017 -18 2018 -19 2019 -20 GIRLS YOUTH LEVEL of PLAY YOUTH &YOUTH GIRLS PROGRAMS 2016 -17 2017 -1837 2018 -19 Jr Gold/16 U 0 32 2019 -20 38 LEVEL of PLAY GIRLS YOUTH Bantam 100 95 92 104 Jr Gold/16 U 0 37 32 38 Peewee 105 128 95 119 115 Bantam 100 92 104 Squirt 110128 116 122 Peewee 105 119 115 Squirt 110 15 110 116 15 U 17 18 122 15 U 15 17 18 12 U 38 48 48 41 49 12 U 38 41 49 10 U 35 47 47 51 10 U 35 51 60 60 8&Under 48 218 74 234 78 233 65 65 295 8&Under 48 218 74 234 78 233 295 TOTAL 121 533 184 604 187 592 192 674 Total Registered Players 654 788 779 866 YOUTH & GIRLS PROGRAMS - TEAM COUNT 2016 -17 GIRLS YOUTH JRGOLD/16 U BN PW SQ MITES MINIMITES 15 U 12 U 10 U 8 U 6 U TOTAL Total Rostered Teams 2017 -18 GIRLS YOUTH 1 6 7 8 9 9 2 6 8 8 9 9 1 3 4 4 2 3 3 2 3 11 2018 -19 GIRLS YOUTH 40 51 14 2019 -20 GIRLS 1 3 4 4 2 42 56 YOUTH 2 6 8 8 9 8 14 2 7 8 8 9 9 1 4 5 3 2 41 55 15 43 58

WAHC By High School Boundary 2019 -20 Players PROJECTED to 2020 -21 (with 6/01 age range change) • BANTAM PEEWEE SQUIRT MITE MINIMITE TOTAL East Ridge YOUTH Woodbury YOUTH Other YOUTH East Ridge SKATER TOTAL Woodbury SKATER Other SKATER East Ridge GOALIE Woodbury GOALIE Other GOALIE 59 53 3 115 53 52 2 6 1 1 51% 46% 3% 100% 50% 49% 2% 75% 13% 63 45 9 117 56 40 8 7 5 1 54% 38% 8% 100% 54% 38% 8% 77 52 3 132 75 46 3 2 6 0 58% 39% 2% 100% 60% 37% 2% 25% 75% 0% 73 46 5 124 72 44 5 1 2 0 59% 37% 4% 100% 60% 36% 4% 33% 67% 0% 38 30 3 71 38 30 3 0 0 0 54% 42% 4% 100% 54% 42% 4% #DIV/0! 310 226 23 559 294 212 21 16 14 2 55% 40% 4% 100% 56% 40% 4% 50% 44% 6% Aged to H. S. &JR GOLD 37 3 TOTAL 2019 -20 Players 596 35
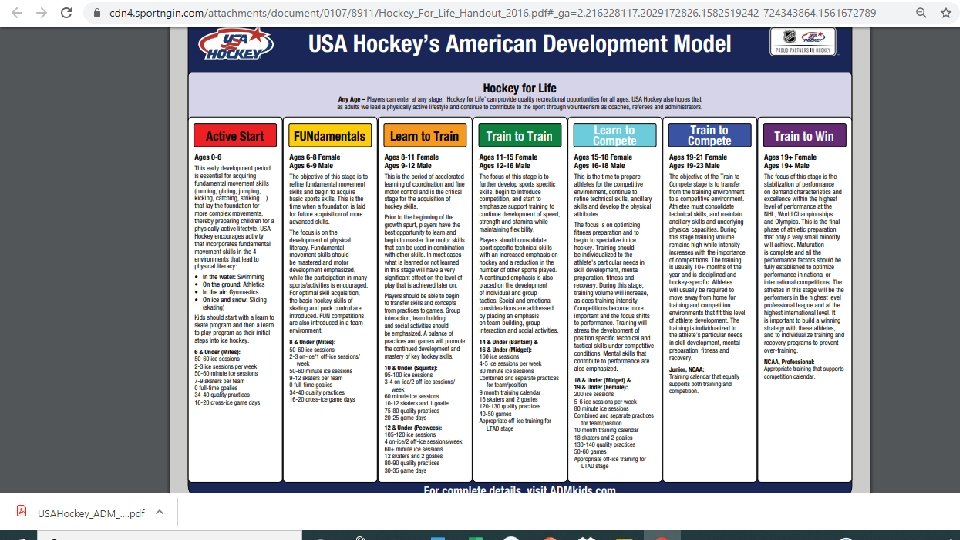

USA HOCKEY ADM_TEAM SIZES LEVEL OF PLAY # SKATERS # GOALIES 6 U 7 -9 No full-time goalies 8 U 9 -12 No full-time goalies SQUIRT/10 U 10 -12 1 PEEWEE/12 U 12 2 BANTAM/15 U 16 2 JRGOLD 18 2

Indoor Ice Benchmarking
- Slides: 13