WLCG Service Report Jamie Shierscern ch WLCG Management
- Slides: 17

WLCG Service Report Jamie. Shiers@cern. ch ~~~ WLCG Management Board, 11 th November 2008

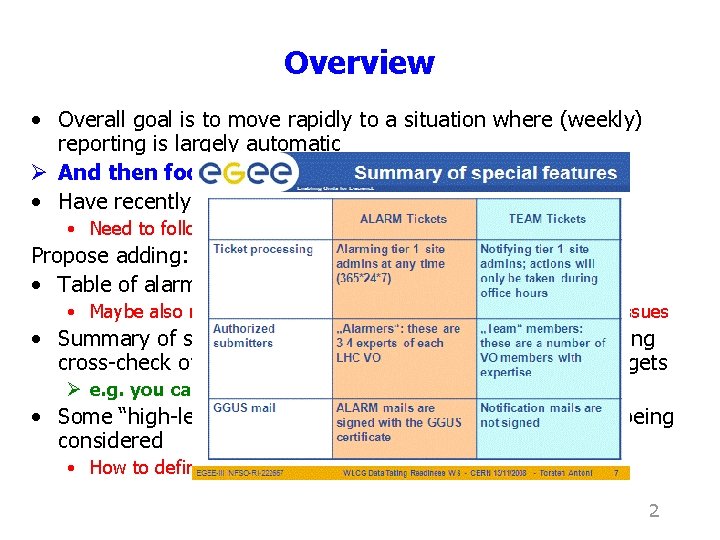
Overview • Overall goal is to move rapidly to a situation where (weekly) reporting is largely automatic Ø And then focus on (i. e. talk about) the exceptions… • Have recently added a table of Service Incident Reports • Need to follow-up on each case – cannot be automatic! Propose adding: • Table of alarm / team tickets & timeline • Maybe also non-team tickets – also some indicator of activity / issues • Summary of scheduled / unscheduled interventions, including cross-check of advance warning with the WLCG / EGEE targets Ø e. g. you can’t “schedule” a 5 h downtime 5’ beforehand… • Some “high-level” view of experiment / site activities also being considered • How to define views that are representative & comprehensible? 2

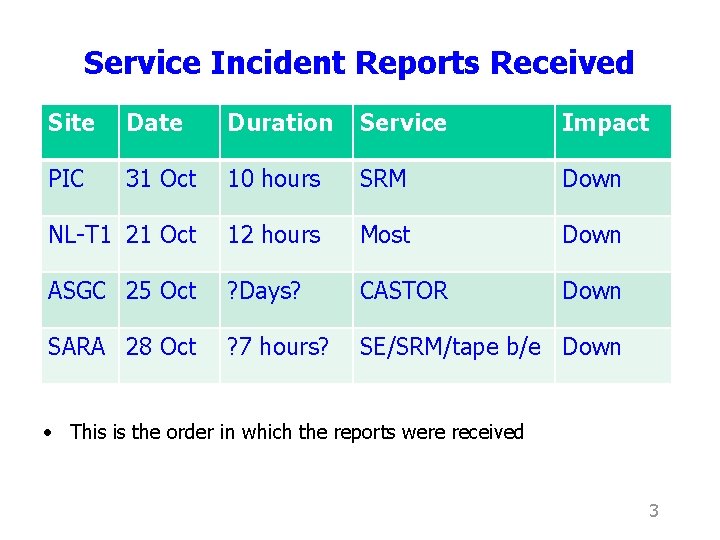
Service Incident Reports Received Site Date Duration Service Impact PIC 31 Oct 10 hours SRM Down NL-T 1 21 Oct 12 hours Most Down ASGC 25 Oct ? Days? CASTOR Down SARA 28 Oct ? 7 hours? SE/SRM/tape b/e Down • This is the order in which the reports were received 3

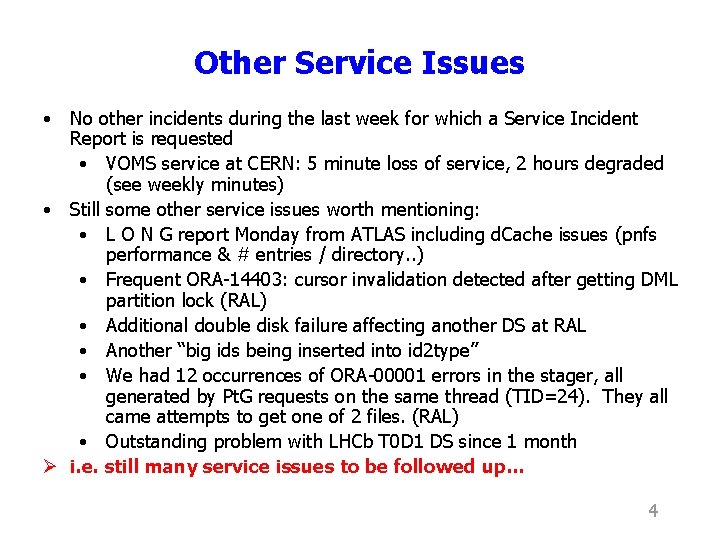
Other Service Issues • No other incidents during the last week for which a Service Incident Report is requested • VOMS service at CERN: 5 minute loss of service, 2 hours degraded (see weekly minutes) • Still some other service issues worth mentioning: • L O N G report Monday from ATLAS including d. Cache issues (pnfs performance & # entries / directory. . ) • Frequent ORA-14403: cursor invalidation detected after getting DML partition lock (RAL) • Additional double disk failure affecting another DS at RAL • Another “big ids being inserted into id 2 type” • We had 12 occurrences of ORA-00001 errors in the stager, all generated by Pt. G requests on the same thread (TID=24). They all came attempts to get one of 2 files. (RAL) • Outstanding problem with LHCb T 0 D 1 DS since 1 month Ø i. e. still many service issues to be followed up… 4

PIC SRM • Friday-Saturday 31/10 - 01/11 we had an episode of "srm overload" at PIC which resulted in about 10 hrs of service interruption. • At around 16: 30 UTC a problem was noticed on the SRM service. It lead to significant service degradation on all VOs using the SRM service. Most SRM operation timed out. At 23: 00 UTC corrective actions were taken, but until 2. 00 UTC the service did not recovered normal operations. There was a second glitch of the service starting at 6: 30 UTC 1 st November which lasted for one hour. 5

PIC SRM - Details • The d. Cache srm head node (dcsrm 02. pic. es) and the pnfs server (dcns 03. pic. es) were under high load. dcsrm 02 timed out, and network map scans on the service port (8443) frequently returned "filtered", meaning that the service was not answering to new tcp connections. The queues on the pnfs. Manager (d. Cache component on the pnfs) were relatively high (over 100 queries queued) for some of the threads. • The following actions were taken: • • restart of the srm server restart of the dcache head nodes (poolmanager, admin domain, location manager) reboot the srm server completely the system became responsive after much meddling but the reason was external (load decrease from the application) and not because of our actions. • Follow-up • Understand how to improve pnfs performance to avoid pnfs. Manager thread queues, that generate heavy load and timeouts. • Try different performance approachs for both pnfs and srm server: • Upgrading srm server to a 64 -bit machine with a 64 -bit java virtual machine • Upgrading pnfs server to faster version • Upgrading pnfs postgresql database to 8. 3 - a performance boost is expected • Understand the effect of FTS behavior doing checks when transferring data 6

NL-T 1 Power (1/2) • On 27 October, Nikhef suffered a power failure that took most of the services offline for a period of about 12 hours. When the power went out, it took the primary network interface of the ALICE VO box with it. This had to be replaced. • Background : both the Nikhef grid service, as well as the Nikhef instance of the Amsterdam Internet Exchange (AMS‐IX), have an emergency power system (shared between the two). There is a large diesel generator which provides primary power in case the normal power is down; the generator takes a short time to get up to speed, this time is bridged by a set of UPS batteries. Hence if the main external power goes down, the UPS takes over and the generator is turned on, taking over from the UPS once the motor is up to speed. • At about 20. 00 UTC on the 27 th, the UPS system suffered a catastrophic failure. There was no actual problem with the main power. However the failure of the UPS took down the entire power of the Nikhef grid service and the Nikhef part of the AMS‐IX. The power problem was rectified around 01. 30 on the 28 th, by physically bypassing the UPS. • The problem was announced in the GOC DB at 2200 UTC. 7

• • • Due to the failure of the Amsterdam Internet Exchange, it was not possible for us to diagnose the problem immediately as there was absolutely no connectivity on site. The problem was diagnosed by looking at Ams‐IX traffic statistics, which showed an enormous dip. Recovery of the grid services started the next morning when people arrived on site. This did not happen very early, as the morning of the 28 th was one of the worst in recent years for traffic around the Amsterdam area; there were problems with both of the main tunnels from north of amsterdam (where many of the staff live), leading to delays by car of up to 2. 5 hours; also train traffic from that region was cut off due to a lightning strike at one of the train stations. Full service was restored around 15. 00 UTC. Actions as a result of the Analysis of the Event : • • • We discovered that the site emergency procedure (for AMS‐ix) did not include, as a line item, that the Nikhef grid team should be notified. This is being rectified. Recovery showed several problems in the virtual machine configuration; the VMs ran fine, but did not come back automatically in the event of a power cut. This has been corrected. Furthermore, we discovered several dependency loops in the service hierarchy, these are also being corrected. Finally, we are taking steps to prevent the lack of communication in the event of such a power cut in the future. There was no way for the Nikhef team to communicate with the outside world. Also it was not possible for us to receive GGUS tickets, alarm tickets, and the like. We are planning to implement an alternative communication path located in a physically different place, so that we can keep the outside world informed of the status via a status web page, in the event of catastrophic downs. We are also outfitting the server room with independent (UMTS) ethernet so that the team can communicate from within the server room for cases in which the network is 8 down.

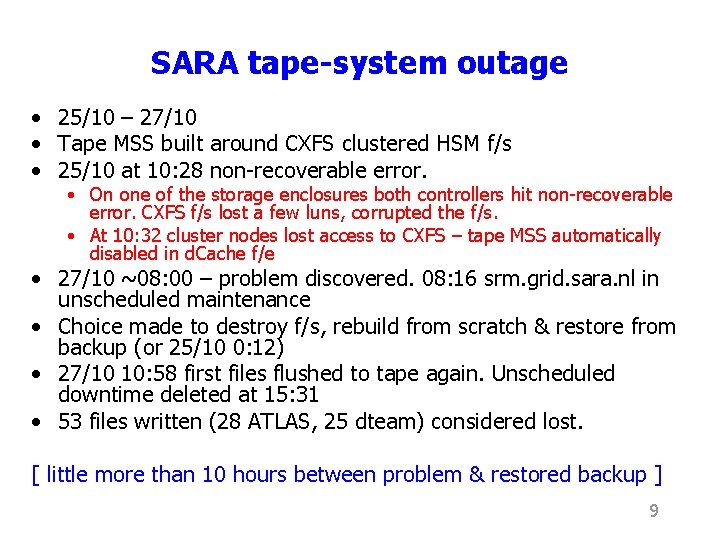
SARA tape-system outage • 25/10 – 27/10 • Tape MSS built around CXFS clustered HSM f/s • 25/10 at 10: 28 non-recoverable error. • On one of the storage enclosures both controllers hit non-recoverable error. CXFS f/s lost a few luns, corrupted the f/s. • At 10: 32 cluster nodes lost access to CXFS – tape MSS automatically disabled in d. Cache f/e • 27/10 ~08: 00 – problem discovered. 08: 16 srm. grid. sara. nl in unscheduled maintenance • Choice made to destroy f/s, rebuild from scratch & restore from backup (or 25/10 0: 12) • 27/10 10: 58 first files flushed to tape again. Unscheduled downtime deleted at 15: 31 • 53 files written (28 ATLAS, 25 dteam) considered lost. [ little more than 10 hours between problem & restored backup ] 9

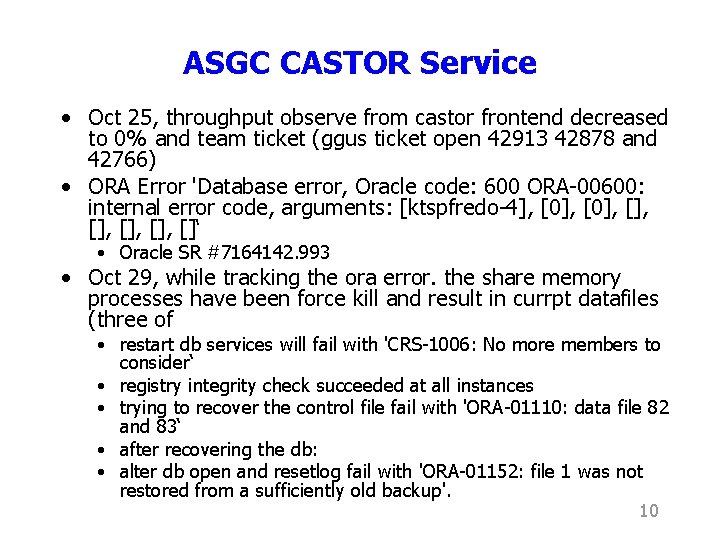
ASGC CASTOR Service • Oct 25, throughput observe from castor frontend decreased to 0% and team ticket (ggus ticket open 42913 42878 and 42766) • ORA Error 'Database error, Oracle code: 600 ORA-00600: internal error code, arguments: [ktspfredo-4], [0], [], [], []‘ • Oracle SR #7164142. 993 • Oct 29, while tracking the ora error. the share memory processes have been force kill and result in currpt datafiles (three of • restart db services will fail with 'CRS-1006: No more members to consider‘ • registry integrity check succeeded at all instances • trying to recover the control file fail with 'ORA-01110: data file 82 and 83‘ • after recovering the db: • alter db open and resetlog fail with 'ORA-01152: file 1 was not restored from a sufficiently old backup'. 10

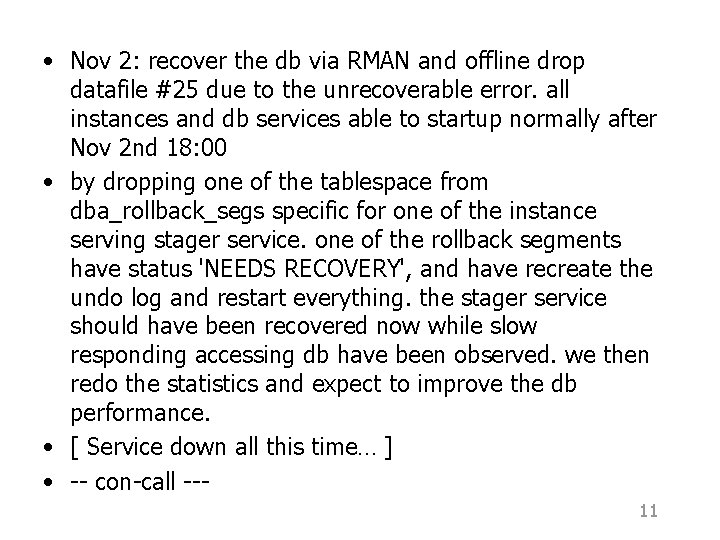
• Nov 2: recover the db via RMAN and offline drop datafile #25 due to the unrecoverable error. all instances and db services able to startup normally after Nov 2 nd 18: 00 • by dropping one of the tablespace from dba_rollback_segs specific for one of the instance serving stager service. one of the rollback segments have status 'NEEDS RECOVERY', and have recreate the undo log and restart everything. the stager service should have been recovered now while slow responding accessing db have been observed. we then redo the statistics and expect to improve the db performance. • [ Service down all this time… ] • -- con-call --11

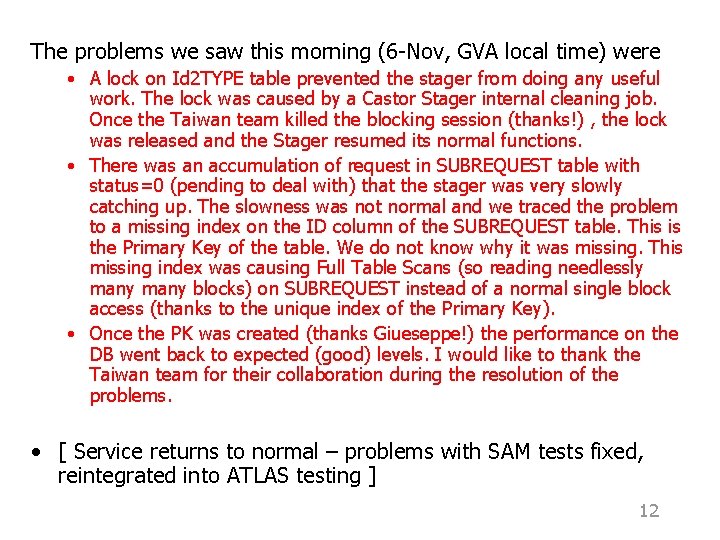
The problems we saw this morning (6 -Nov, GVA local time) were • A lock on Id 2 TYPE table prevented the stager from doing any useful work. The lock was caused by a Castor Stager internal cleaning job. Once the Taiwan team killed the blocking session (thanks!) , the lock was released and the Stager resumed its normal functions. • There was an accumulation of request in SUBREQUEST table with status=0 (pending to deal with) that the stager was very slowly catching up. The slowness was not normal and we traced the problem to a missing index on the ID column of the SUBREQUEST table. This is the Primary Key of the table. We do not know why it was missing. This missing index was causing Full Table Scans (so reading needlessly many blocks) on SUBREQUEST instead of a normal single block access (thanks to the unique index of the Primary Key). • Once the PK was created (thanks Giueseppe!) the performance on the DB went back to expected (good) levels. I would like to thank the Taiwan team for their collaboration during the resolution of the problems. • [ Service returns to normal – problems with SAM tests fixed, reintegrated into ATLAS testing ] 12

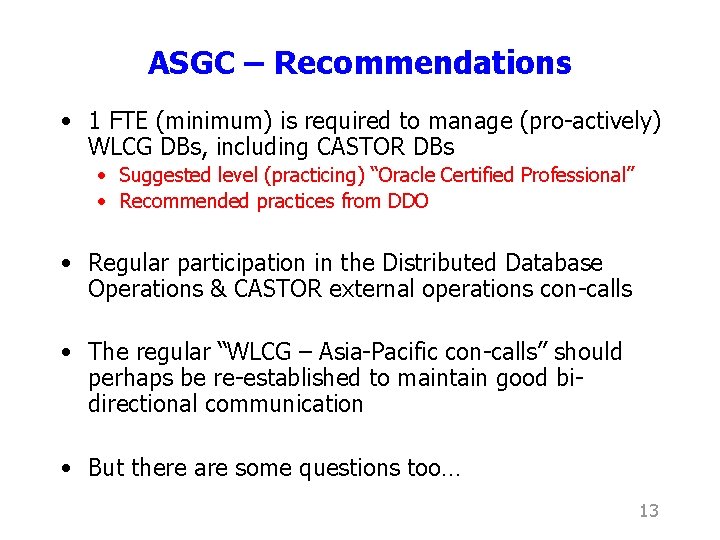
ASGC – Recommendations • 1 FTE (minimum) is required to manage (pro-actively) WLCG DBs, including CASTOR DBs • Suggested level (practicing) “Oracle Certified Professional” • Recommended practices from DDO • Regular participation in the Distributed Database Operations & CASTOR external operations con-calls • The regular “WLCG – Asia-Pacific con-calls” should perhaps be re-established to maintain good bidirectional communication • But there are some questions too… 13

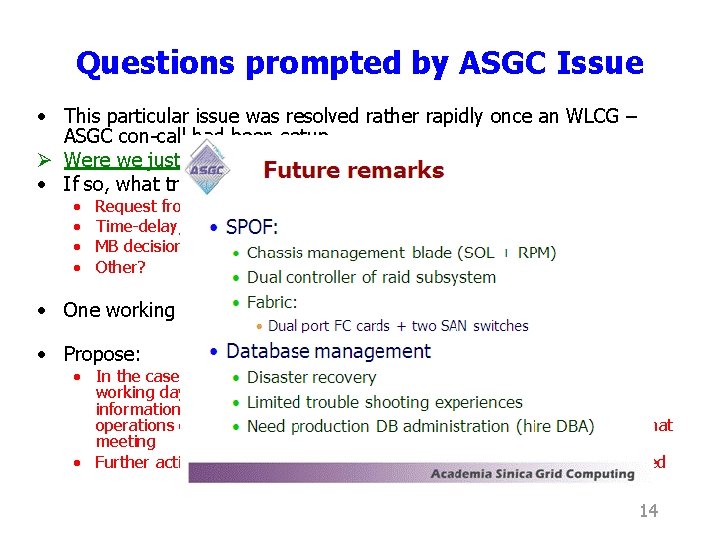
Questions prompted by ASGC Issue • This particular issue was resolved rather rapidly once an WLCG – ASGC con-call had been setup Ø Were we just lucky, or should such follow-up occur systematically? • If so, what triggers the follow-up? • • Request from an experiment; Time-delay; MB decision; Other? • One working day might be too short – ten days clearly too long • Propose: • In the case of a major service degradation or outage for more than one working day, the (Tier 0, Tier 1) site must provide at least some (useful) information on the problem and state of follow-up by the daily WLCG operations call one working day later – and make every effort to attend that meeting • Further actions will be discussed at the meeting and taken offline if required 14

Further Service Discussions • We have time at the workshop later this week to discuss various “WLCG operations” issues in more detail • It is clear that there is still much room for improvement and our continued goal must be to get the services as reliable as possible as soon as possible – in particular, maximizing the remaining period of EGEE III funding… • Target: using metrics discussed and agreed at the MB (or where appropriate), weekly operations report should “normally” (i. e. at least 3 times per month) have no specific problems or anomalies to be discussed… 15

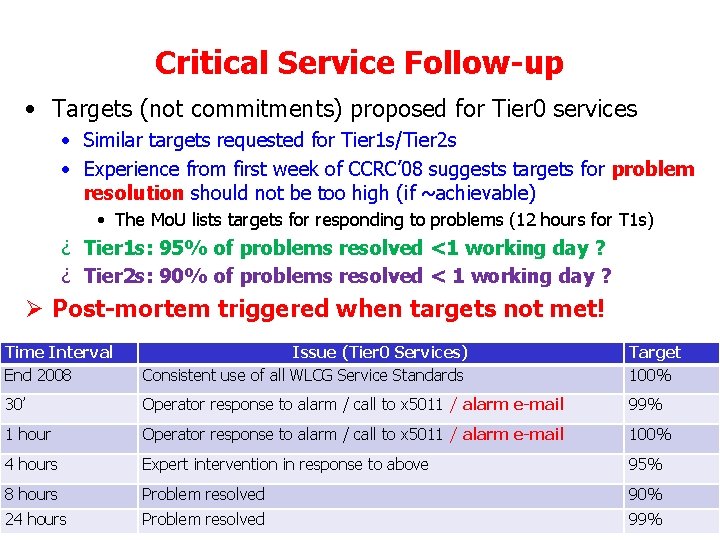
Critical Service Follow-up • Targets (not commitments) proposed for Tier 0 services • Similar targets requested for Tier 1 s/Tier 2 s • Experience from first week of CCRC’ 08 suggests targets for problem resolution should not be too high (if ~achievable) • The Mo. U lists targets for responding to problems (12 hours for T 1 s) ¿ Tier 1 s: 95% of problems resolved <1 working day ? ¿ Tier 2 s: 90% of problems resolved < 1 working day ? Ø Post-mortem triggered when targets not met! Time Interval End 2008 Issue (Tier 0 Services) Consistent use of all WLCG Service Standards Target 100% 30’ Operator response to alarm / call to x 5011 / alarm e-mail 99% 1 hour Operator response to alarm / call to x 5011 / alarm e-mail 100% 4 hours Expert intervention in response to above 95% 8 hours Problem resolved 90% 24 hours Problem resolved 16 99%

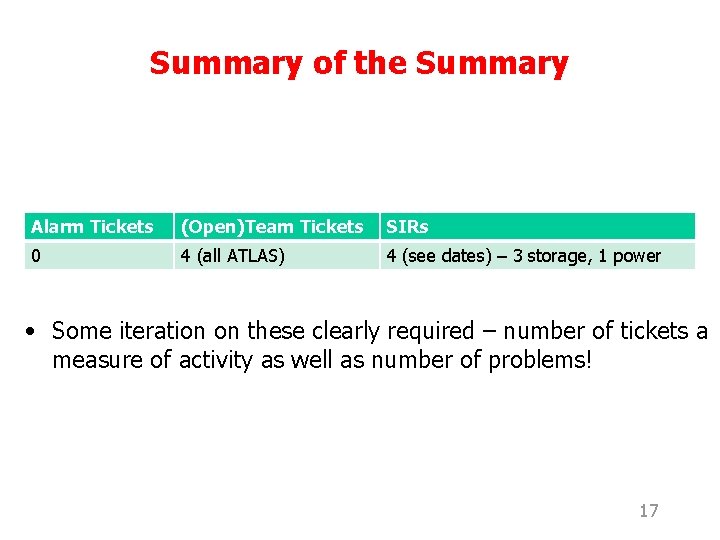
Summary of the Summary Alarm Tickets (Open)Team Tickets SIRs 0 4 (all ATLAS) 4 (see dates) – 3 storage, 1 power • Some iteration on these clearly required – number of tickets a measure of activity as well as number of problems! 17