Withlacoochee Regional Water Supply Authority Regional Water Supply


 Four-County Overview 4 County 2015")


 12")


 23 Brine")
- Slides: 24
Withlacoochee Regional Water Supply Authority Regional Water Supply Plan Update - Status Report 3 January 16, 2019
Water Supply Plan Overview Ø Key elements of the Water Supply Plan § § § 1 Water Demand Projections Water Source Evaluation Water Supply Project Options Facility Integration Plan Governance
Water Supply Plan Overview Ø Key elements of the Water Supply Plan § § § 2 Water Demand Projections Water Source Evaluation Water Supply Project Options Facility Integration Plan Governance
Water Supply Plan Overview Ø Water Demand Projections § Estimating increase in demand from 2020 through 2040 • Public Supply • Industrial/Commercial/Institutional • Mining • Recreation • Agriculture 3
Population & Demand Projections (Public Supply, Dom. Self Supply) Four-County Overview 4 County 2015 Population 2040 Population Increase 2020 Water Demand (mgd) 2040 Water Demand (mgd) Demand Increase (mgd) Citrus 154, 717 182, 185 27, 468 20. 6 23. 2 2. 6 Hernando 182, 854 244, 274 61, 420 23. 1 28. 3 5. 2 Marion (SWFWMD) 112, 040 159, 115 47, 075 16. 6 21. 2 4. 6 Marion (SJRWMD) 216, 408 256, 286 39, 878 29. 7 33. 3 3. 6 Sumter 125, 529 258, 670 133, 141 33. 0 47. 1 14. 1 Total 791, 548 1, 100, 530 308, 982 123. 0 153. 1 30. 1
Water Supply Plan Overview Ø Water Source Evaluation § § § 5 Water Conservation Reclaimed Water Groundwater Surface Water (Rivers) Seawater Desalination
Water Supply Plan Overview Ø Water Source Evaluation § § § 6 Water Conservation Reclaimed Water Groundwater Surface Water (Rivers) Seawater Desalination
Water Supply Plan Overview Ø Water Source Evaluation § 7 Water Conservation
Alliance for Water Efficiency Water Conservation Tracking Tool Ø To assess the potential for water conservation to reduce public supply demand, we are using the Alliance for Water Efficiency’s Water Conservation Tracking Tool. § The tool is a model that evaluates water savings, costs, and benefits of conservation programs for a water utility. § It provides: • Standardized methodology for water savings • Benefit cost accounting • A library of conservation activities from which utilities can build conservation programs 8
Alliance for Water Efficiency Water Conservation Tracking Tool Ø Twelve utilities that make up 90 percent of the water use in the four-county region were invited to participate in the modeling. Citrus County Utilities Inverness Hernando County Utilities Brooksville Marion County (SWFWMD) Marion County Utilities Bay Laurel Dunnellon Spruce Creek 9 Marion County (SJRWMD) Ocala Sumter County Bushnell Wildwood The Villages
Alliance for Water Efficiency Water Conservation Tracking Tool Ø Of the 12 invited utilities, eight have committed to participating so far. These utilities represent 74 percent of permitted public supply water use within the WRWSA. Citrus County Utilities Inverness Hernando County Utilities Brooksville Marion County (SWFWMD) Marion County Utilities Bay Laurel Dunnellon Spruce Creek 10 Marion County (SJRWMD) Ocala Sumter County Bushnell Wildwood The Villages
Alliance for Water Efficiency Water Conservation Tracking Tool Ø Model inputs will be completed for the eight utilities by the end of January. Ø Utility Cooperation § Have received a great deal of cooperation from the participating utilities. § Debra Burden (Citrus County Utilities) and Alys Brockway, (Hernando County Utilities) have worked closely with us from when evaluations of the AWE tool began in the summer of 2018. 11
Water Supply Plan Overview > Water Source Evaluation Ø Surface Water (Rivers) 12
13
Water Supply Plan Overview Ø Water Source Evaluation § Withlacoochee River – Average annual quantity of water available for supply is based on SWFWMD’s proposed minimum flows: • • § 27 mgd 39 mgd 44 mgd Much Greater During severe droughts, there could be lengthy periods of time when no water would be available at Croom, Wysong, and Holder. • 14 Croom Wysong Holder Lake Rousseau To overcome this limitation, storage reservoirs could be built or the facilities could be operated conjunctively with wellfields.
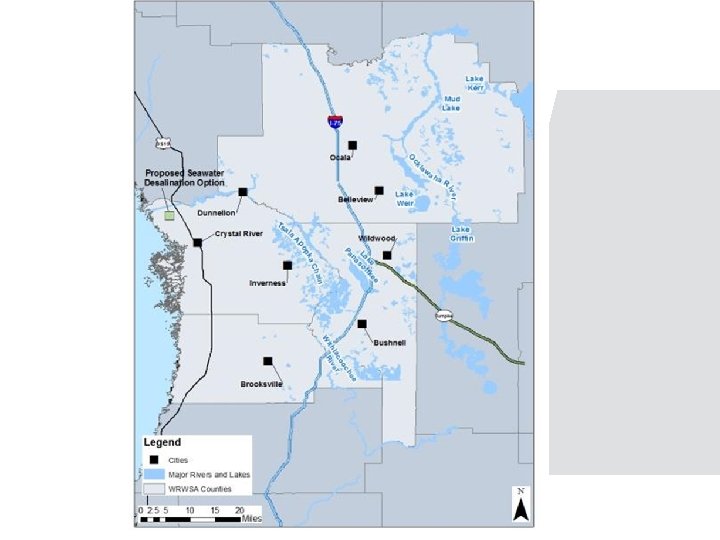
Water Supply Plan Overview Ø Water Source Evaluation § 15 Seawater Desalination
18
Water Supply Plan Overview Ø Water Source Evaluation § § The seawater desalination process produces large volumes of concentrated brine that must be disposed of. Three Disposal methods: • • • 20 Dilution with power plant cooling water Deep well injection Zero liquid discharge
21
Water Supply Plan Overview Ø Water Source Evaluation § Seawater Desalination • • • 22 The two coal fired units and nuclear unit used 1. 89 billion gallons per day of water from the Gulf of Mexico for cooling. The new natural gas facility and two remaining coal fired units use a total of 87. 8 million gallons per day; a ten-fold reduction in cooling water flow. Dilution with power plant cooling water is no longer an option.
Water Supply Plan Overview > Seawater Desalination Facility Costs (15 mgd Capacity) 23 Brine Concentrate Disposal Method Total Cost Unit Cost Deep Well Injection $259 million $6. 22/1000 gal Ocean Outfall $355 million $7. 08/1000 gal ZLD $393 million $12. 60/1000 gal