Wine Complexity An Empirical Investigation Qian Janice Wang


. Representation of complexity in wine: Influence")
 FQ&P")
")


 • Age distribution")


=3. 11, p =. 08")
 Intermediate (N=30) Advanced (N=16)")


 x Expertise level (beginner, intermediate,")


- Slides: 37
Wine Complexity: An Empirical Investigation Qian Janice Wang Crossmodal Research Laboratory Department of Experimental Psychology University of Oxford June 12 2018
Crossmodal Research Laboratory
Crossmodal Research Laboratory
Oxford University Blind Tasting Society
Summary • Just what do we mean by wine complexity? • Are blended wines more complex than single varietals? • Are people willing to pay for it? Evaluating Methods of Aesthetic Enquiry across Disciplines
WINE COMPLEXITY: WHAT IS IT?
“The single greatest standard used in assessing the quality of a wine is complexity. The more times you can return to a glass of wine and find something different in it—in the bouquet, in the taste—the more complex the wine. The very greatest wines are not so much overpowering as they are seemingly limitless. ” - Matt Kramer, Wine Spectator, 2012.
What do we mean by complexity? • Physical/chemical complexity is in the wine • Perceived/inferred complexity is in the taster
What do we mean by complexity? • Physical/chemical complexity is in the wine – structural – number of different molecules
What do we mean by complexity? • Physical/chemical complexity is in the wine – Structural Spence & Wang (in press) – Number of different molecules On the meaning(s) of complexity in the chemical senses. Chemical Senses • Perceived/inferred complexity is in the taster – Number of components – Temporal evolution (in the mouth, in the glass) – Integrated percept
Influence of expertise Parr et al. , (2011). Representation of complexity in wine: Influence of expertise. FQ&P
How the WSET approaches complexity Parr et al. , (2011) FQ&P
Questions • Can blending increase perceived complexity? – Singleton & Ough (1962)
Questions • Is complexity worth paying for?
STUDY – WINE BLENDING AND COMPLEXITY
Wines • 3 single varietal wines – Cabernet Sauvignon $24. 99 – Merlot $21. 99 – Cabernet Franc $21. 99 • 3 50 -50 blends
Participants • 87 people recruited from Oxford (38 male, 49 female) • Age distribution (18 -70, Mean 29. 06, SD 11. 71) • Expertise distribution: 41 beginners, 30 intermediates, 16 experts
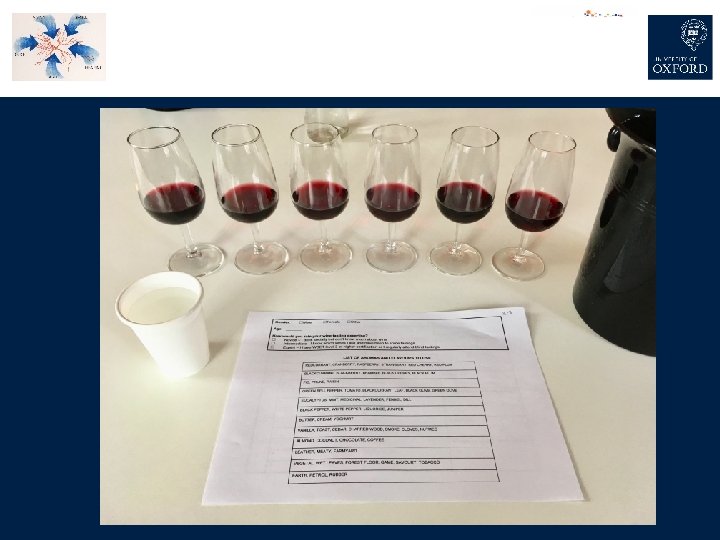
REDCURRANT, CRANBERRY, RASPBERRY, STRAWBERRY, RED CHERRY, RED PLUM BLACKCURRANT, BLACKBERRY, BRAMBLE, BLACK CHERRY, BLACK PLUM FIG, PRUNE, RAISIN GREEN BELL PEPPER, TOMATO, BLACKCURRANT LEAF, BLACK OLIVE, GREEN OLIVE EUCALYPTUS, MINT, MEDICINAL, LAVENDER, FENNEL, DILL BLACK PEPPER, WHITE PEPPER, LIQUORICE, JUNIPER Final question: Which of the wines are blends? BUTTER, CREAM, YOGHURT VANILLA, TOAST, CEDAR, CHARRED WOOD, SMOKE, CLOVES, NUTMEG ALMOND, COCONUT, CHOCOLATE, COFFEE LEATHER, MEATY, FARMYARD VEGETAL, WET LEAVES, FOREST FLOOR, GAME, SAVOURY, TOBACCO EARTH, PETROL, RUBBER Wine No. Flavours (Please pick 5 from the list) Evaluation (1= not at all; 9 = very much) Quality 1☐ 1 Liking: Quality (1 -20): 2 Familiarity: 3 Complexity: 4 Flavour Intensity: 5 Willingness to pay for a 750 m. L bottle (£):
CAN PEOPLE TELL BLENDS FROM SINGLE-VARIETAL WINES?
Blend vs. Single-Varietal • All expertise levels together: No χ2(1)=3. 11, p =. 08 Single Varietal Wines Total Yes blend 40% Not blend 60% 50 -50 Blended Wines Total Not blend 52% Yes blend 48%
• Yes for beginners and intermediates! Single-Varietal Beginner (N=41) Intermediate (N=30) Advanced (N=16) Not blend 60% Not blend 59% Not blend 60% 50 -50 Blends Yes blend 40% Not blend 42% Yes blend 41% Not blend 41% Yes blend 40% Not blend 60% Yes blend 58% χ2(1)=7. 88, p =. 005 Yes blend 59% χ2(1)=5. 69, p =. 02 Yes blend 40% χ2(1)=0, p = 1
So how do people decide if a wine is a blend? • If it seems unfamiliar!
DO 50 -50 BLENDS INCREASE PERCEIVED QUALITY AND COMPLEXITY?
Blends Difference in ratings? • MANOVA: Blend (blend, non-blend) x Expertise level (beginner, intermediate, expert) – Complexity – Intensity – Liking – Familiarity – Quality – Willingness to pay
Numerical analysis: Differences in ratings? • No effect of blend vs. single-varietal • But, significant effect of expertise level Expertise Complexity Liking (1 -9) Intensity (1 - Familiarity (1 Quality (1 - Willingness level Novice (1 -9) 4. 95 (. 12) 5. 01 (. 13) 9) 5. 43 (. 11) -9) 4. 55 (. 13) 20) 10. 26 (. 26) to pay (£) 8. 27 (. 27) a a a 5. 04 (. 15) 5. 67 (. 13) 4. 90 (. 15) 10. 19 (. 30) 9. 24 (. 31) a a ab a a a 5. 45 (. 18) 5. 50 (. 21) 6. 20 (. 18) 6. 30 (. 20) 12. 38 (. 41) 12. 19 (. 43) a a b b Intermediate 5. 24 (. 14) Expert
HOW DO PEOPLE PERCEIVE COMPLEXITY?
A Model for Complexity β t-Stat. Quality . 35 7. 62 ** Intensity . 31 9. 93 ** Liking . 19 4. 38 ** Age . 12 3. 91 ** Wine Order . 11 3. 86 ** Gender (1=male, 2=female) . 07 2. 28 * Willingness to pay . 05 1. 19 Expertise -. 04 -1. 22 Familiarity . 02 . 52 Adjusted R 2 . 58 Num. Obs. 518
Linguistic analysis • Are certain flavour descriptors associated with greater complexity? – Naïve Bayes classifier (Python nltk library) – Divided all tasting notes into 2 complexity groups, low or high (median = 6/9) – Find which descriptor might be most informative (i. e. used for tasting notes belonging to one group or another)
So…where does complexity come from? • Complexity comes from winemaking – oak! Flavour descriptor Likelihood Ratio Coconut Complex: Simple 4. 3 : 1 Farmyard Simple: Complex 2. 9 : 1 Game Simple: Complex 2. 7 : 1 Toast Complex: Simple 2. 5 : 1 Vanilla Complex: Simple 2. 1 : 1 Butter Complex: Simple 1. 9 : 1 Vegetal Simple: Complex 1. 8 : 1 … … …
ARE PEOPLE WILLING TO PAY FOR COMPLEXITY?
Is complexity worth paying for? • Yes it is? Complexity Liking Intensity Familiarity Quality Willingness to pay Pearson correlation . 57 . 52 . 29 . 66 . 50 Sig. <. 0005
But not after controlling for other factors…
A Model of Willingness to Pay β t-Stat. Quality . 43 8. 83 ** Wine expertise . 19 5. 23 ** Liking . 20 4. 21 ** Age . 06 1. 77 Complexity . 06 1. 19 Familiarity . 04 . 97 Intensity . 02 . 55 Wine order -. 003 -. 10 Gender (0=male, 1=female) . 003 . 09 Adjusted R 2 . 50 Num. Obs. 518
Informative words – willingness to pay • Expensive wines taste like vanilla? Flavour descriptor Likelihood Ratio Yoghurt Cheap: Expensive 4. 3 : 1 Vanilla Expensive: Cheap 2. 9 : 1 Petrol Cheap: Expensive 2. 7 : 1 Wet leaves Cheap: Expensive 2. 5 : 1 Butter Expensive: Cheap 2. 1 : 1 Chocolate Expensive: Cheap 2. 9 : 1 … … …
Summary • 50 -50 versus single varietal: not much difference – Experts rate wines to be better quality and willing to pay more • Complexity predicted by – Quality, intensity, liking – Age, gender – Order of wines tasted • Complexity and willingness to pay associated with oak flavours • No correlation between complexity and willingness to pay – instead driven by quality, expertise, and liking
Thank you for your attention! https: //www. 1843 magazine. com/features/supertasters-among-the-dreaming-spires