Windows Crash Dump Analysis Daniel Pearson David Solomon















- Slides: 39


Windows Crash Dump Analysis Daniel Pearson David Solomon Expert Seminars SVR 302

Daniel Pearson Started working with Windows NT 3. 51 Three years at Digital Equipment Corporation Supporting Intel and Alpha systems running Windows NT Seven years at Microsoft Senior Escalation Lead in Windows base team Worked in the Mobile Internet sustained engineering team Instructor for David Solomon, co-author of the Windows Internals book series

Agenda Causes of Windows crashes What happens during a crash Configuring Windows crash options Writing a crash dump Automated and manual crash analysis Using Driver Verifier to detect errors Attaching a kernel debugger * Portions of this session are based on material developed by Mark Russinovich and David Solomon

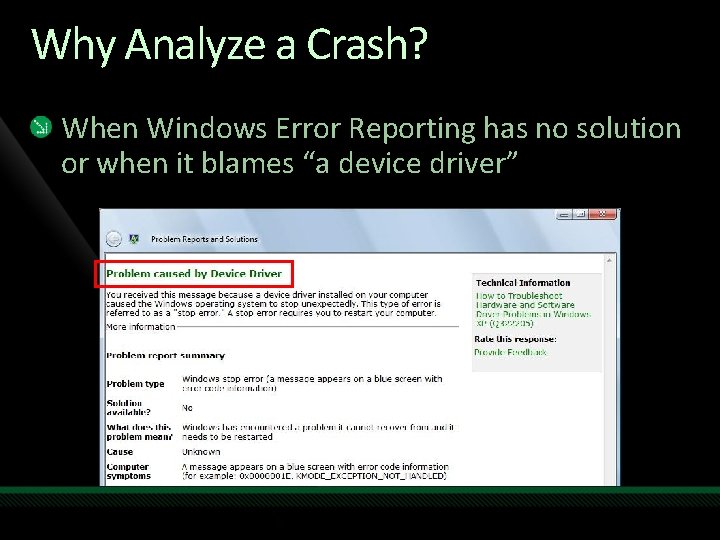
Why Analyze a Crash? When Windows Error Reporting has no solution or when it blames “a device driver”

Why Does Windows Crash A device driver or part of the operating system incurs an unhandled exception A device driver or part of the operating system explicitly crashes the system due to an unrecoverable condition A page fault occurs at an interrupt request level of dispatch or higher A hardware condition such as a nonmaskable interrupt or faulty memory, disk, etc.

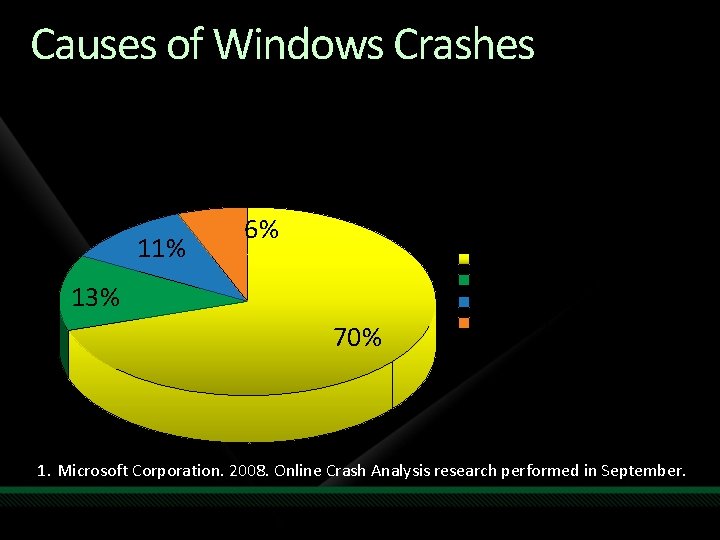
Causes of Windows Crashes Percentage of Top 500 Crashes for Windows Vista with Service Pack 11 11% 6% 13% 70% Third-party device drivers Microsoft code Crash too corrupt for analysis Hardware errors 1. Microsoft Corporation. 2008. Online Crash Analysis research performed in September.

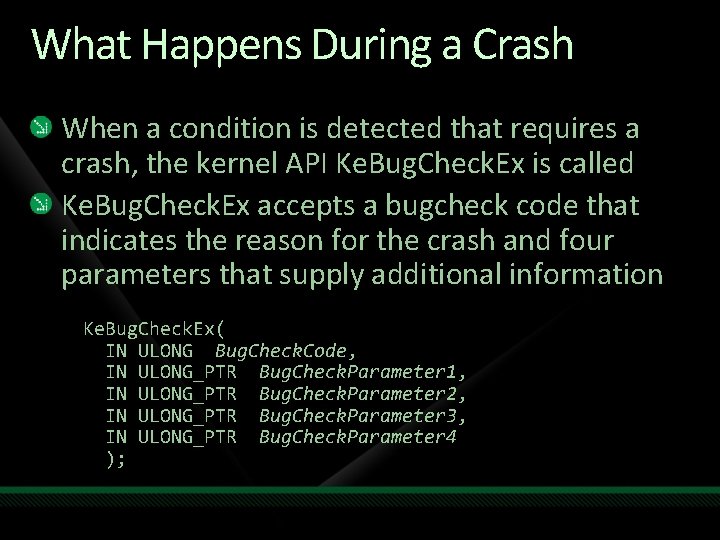
What Happens During a Crash When a condition is detected that requires a crash, the kernel API Ke. Bug. Check. Ex is called Ke. Bug. Check. Ex accepts a bugcheck code that indicates the reason for the crash and four parameters that supply additional information Ke. Bug. Check. Ex( IN ULONG Bug. Check. Code, IN ULONG_PTR Bug. Check. Parameter 1, IN ULONG_PTR Bug. Check. Parameter 2, IN ULONG_PTR Bug. Check. Parameter 3, IN ULONG_PTR Bug. Check. Parameter 4 );

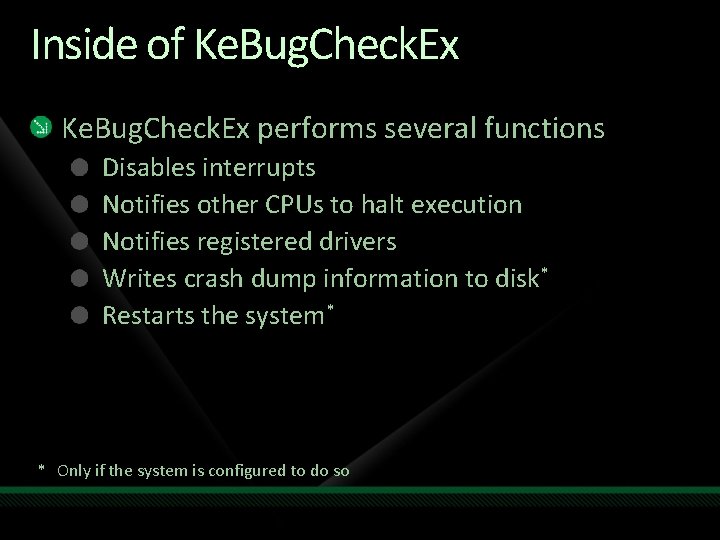
Inside of Ke. Bug. Check. Ex performs several functions Disables interrupts Notifies other CPUs to halt execution Notifies registered drivers Writes crash dump information to disk* Restarts the system* * Only if the system is configured to do so

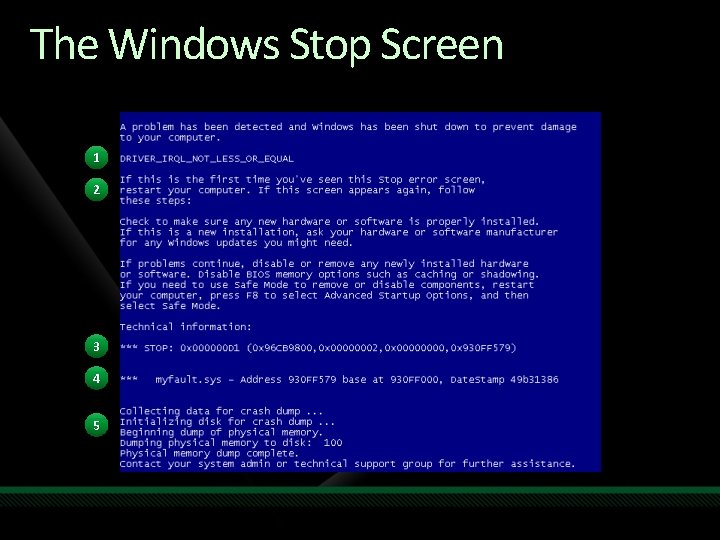
The Windows Stop Screen 1 2 3 4 5

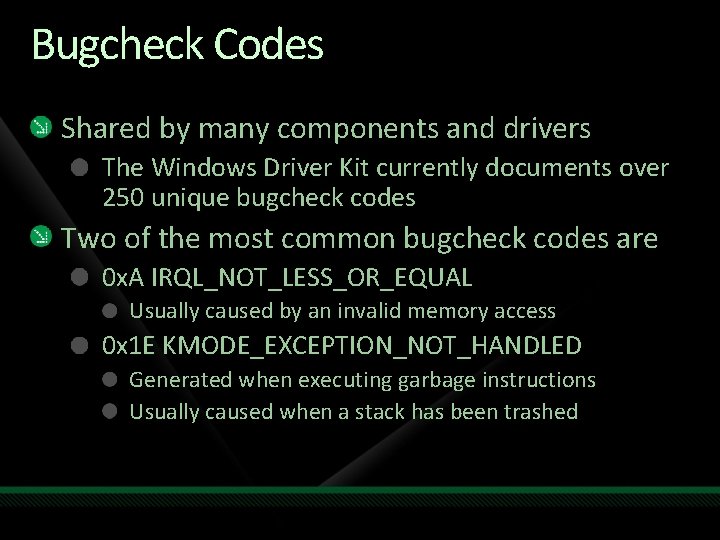
Bugcheck Codes Shared by many components and drivers The Windows Driver Kit currently documents over 250 unique bugcheck codes Two of the most common bugcheck codes are 0 x. A IRQL_NOT_LESS_OR_EQUAL Usually caused by an invalid memory access 0 x 1 E KMODE_EXCEPTION_NOT_HANDLED Generated when executing garbage instructions Usually caused when a stack has been trashed

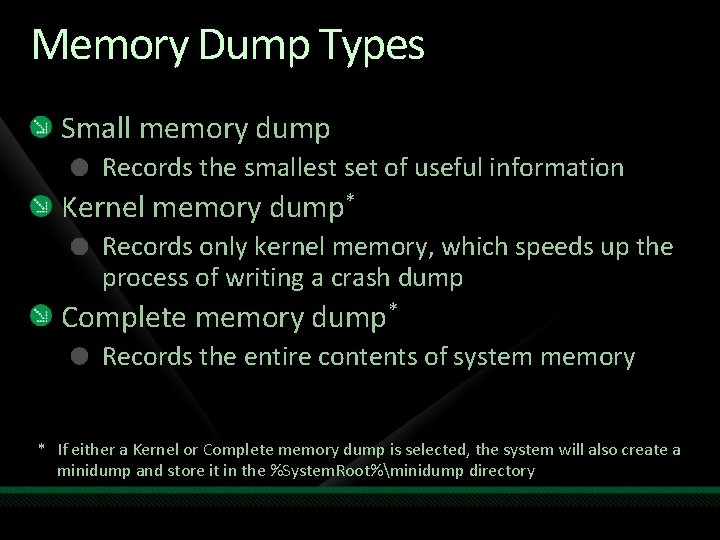
Memory Dump Types Small memory dump Records the smallest set of useful information Kernel memory dump* Records only kernel memory, which speeds up the process of writing a crash dump Complete memory dump* Records the entire contents of system memory * If either a Kernel or Complete memory dump is selected, the system will also create a minidump and store it in the %System. Root%minidump directory

demo Configuring Debugging Information Options

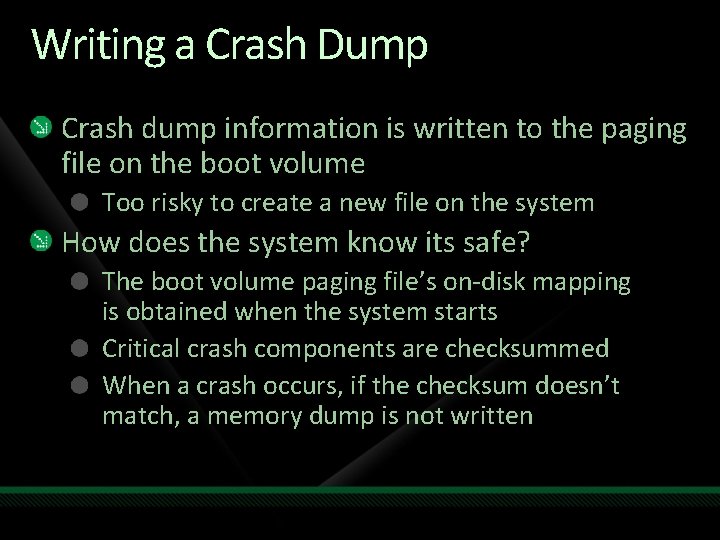
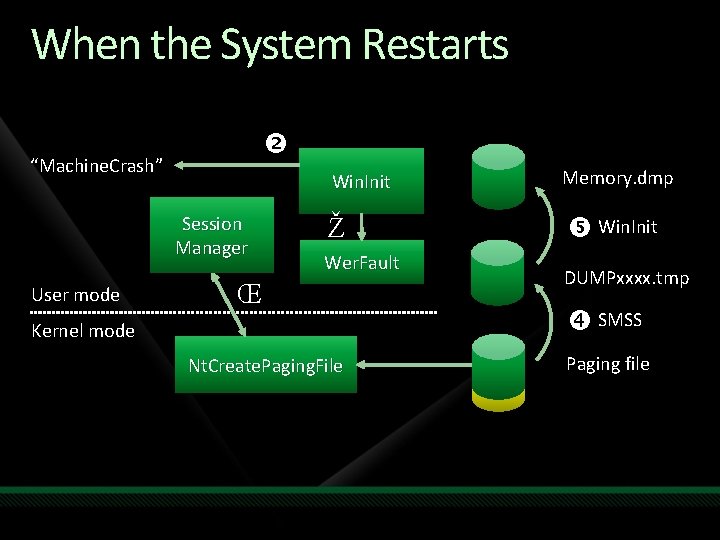
Writing a Crash Dump Crash dump information is written to the paging file on the boot volume Too risky to create a new file on the system How does the system know its safe? The boot volume paging file’s on-disk mapping is obtained when the system starts Critical crash components are checksummed When a crash occurs, if the checksum doesn’t match, a memory dump is not written

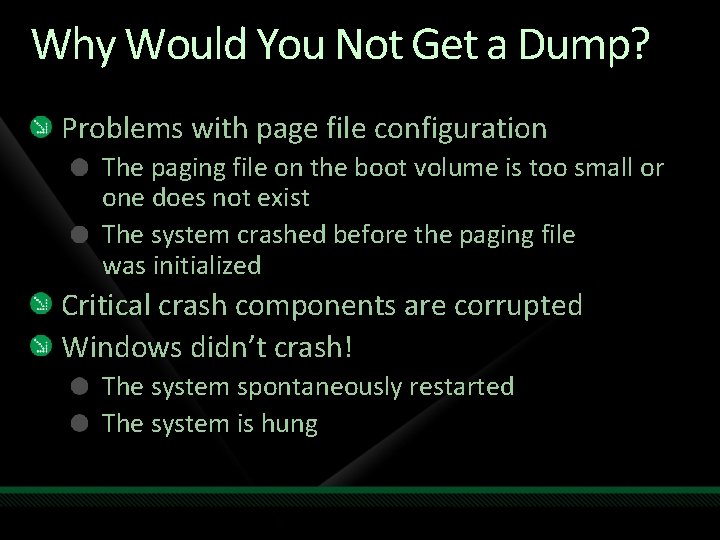
Why Would You Not Get a Dump? Problems with page file configuration The paging file on the boot volume is too small or one does not exist The system crashed before the paging file was initialized Critical crash components are corrupted Windows didn’t crash! The system spontaneously restarted The system is hung

When the System Restarts “Machine. Crash” Session Manager User mode Win. Init Memory. dmp Ž Win. Init Wer. Fault Œ Kernel mode Nt. Create. Paging. File DUMPxxxx. tmp SMSS Paging file

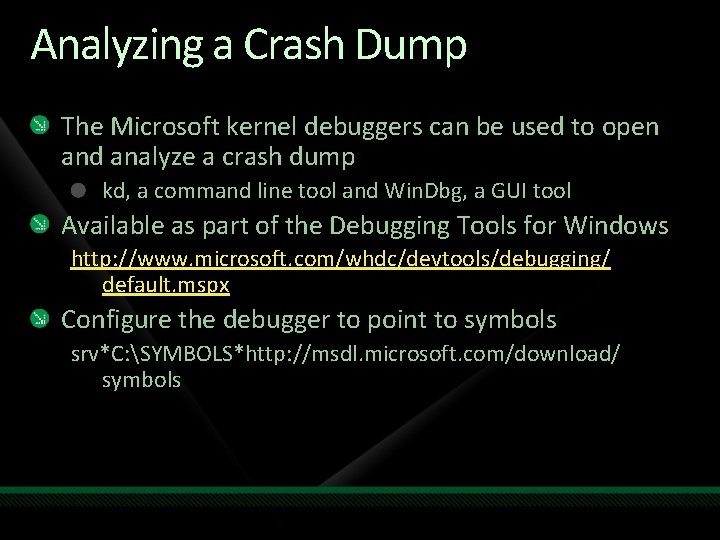
Analyzing a Crash Dump The Microsoft kernel debuggers can be used to open and analyze a crash dump kd, a command line tool and Win. Dbg, a GUI tool Available as part of the Debugging Tools for Windows http: //www. microsoft. com/whdc/devtools/debugging/ default. mspx Configure the debugger to point to symbols srv*C: SYMBOLS*http: //msdl. microsoft. com/download/ symbols

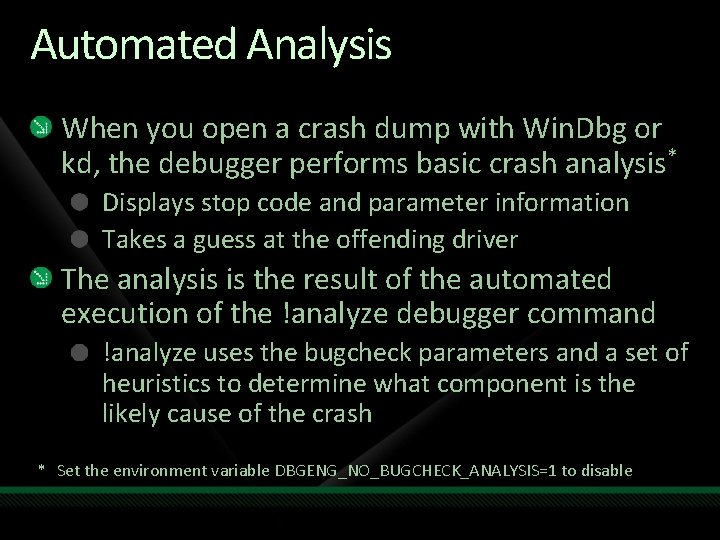
Automated Analysis When you open a crash dump with Win. Dbg or kd, the debugger performs basic crash analysis* Displays stop code and parameter information Takes a guess at the offending driver The analysis is the result of the automated execution of the !analyze debugger command !analyze uses the bugcheck parameters and a set of heuristics to determine what component is the likely cause of the crash * Set the environment variable DBGENG_NO_BUGCHECK_ANALYSIS=1 to disable

demo Automated Analysis Using !analyze

Buffer Overruns Occurs when a driver goes past the end, called an overrun, or the beginning, an underrun, of it’s memory allocation Usually detected when overwritten data is referenced by the kernel or another driver It’s possible there’s a long delay between corruption and detection

demo Viewing the Effects of a Buffer Overrun

Crash Transformation For crashes that are difficult to analyze The “victim” crashed the system, not the culprit The debugger points to ntoskrnl. exe, win 32 k. sys or other Windows components You get many different crash dumps all pointing at different causes Your goal isn’t to analyze difficult crashes … It’s to try to make an “unanalyzable” crash into one that can be easily analyzed

Driver Verifier Useful for identifying code defects in drivers Performs more thorough checks on the system and device drivers as well as simulating failures Support is built into the operating system The requirements for the Windows logo program state that a driver must not fail while running under Driver Verifier

demo Using Driver Verifier to Catch a Buffer Overrun

Manual Analysis Sometimes !analyze isn’t enough It might not tell you anything useful You want to know in more detail what was happening at the time of the crash Several useful commands and techniques Verify the time of the crash, . time A short uptime value can mean frequent problems Check the stack on each CPU, stacks are read from the bottom to the top !cpuinfo will display a list of all the CPUs Use ~s to switch to a different CPU for investigation k to display the stack

Manual Analysis Several useful commands and techniques Look at memory usage, !vm Make sure memory pools are not depleted or contain errors Use !poolused to identify large users Check the currently running thread, !thread May or may not be related to the crash Check pending I/O requests using !irp List all processes on the system, !process 0 0 Make sure you understand what was running at the time List loaded drivers, lm t n Make sure all the drivers are recognizable and up to date * Refer to the Debugging Tools for Windows documentation for additional commands

demo Manual Analysis of a Crash Dump

Attaching a Kernel Debugger Required for debugging initialization failures and crashes where no dump file is created Requires that the system be started with the debugger enabled to work Support for using a null-modem, IEEE 1394 and USB 2. 0 cable as well as virtual machines and over the network in Windows 7 Limited support for local kernel debugging

demo Attaching a Kernel Debugger to a Live System

Hung Systems Sometimes systems becomes unresponsive Keyboard and mouse frozen Two types of hangs Instant lockup Kernel synchronization deadlock Infinite loop at a high IRQL or a very high priority thread Slowly grinding to a halt Resource depletion

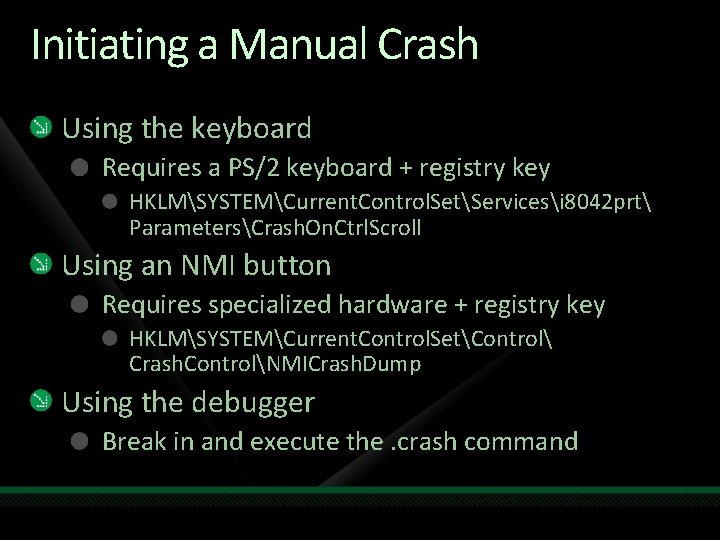
Initiating a Manual Crash Using the keyboard Requires a PS/2 keyboard + registry key HKLMSYSTEMCurrent. Control. SetServicesi 8042 prt ParametersCrash. On. Ctrl. Scroll Using an NMI button Requires specialized hardware + registry key HKLMSYSTEMCurrent. Control. SetControl Crash. ControlNMICrash. Dump Using the debugger Break in and execute the. crash command

demo Debugging a Hung System

Additional Information Windows Internals 5 th edition Debugging Tools for Windows documentation Mark Russinovich’s Blog http: //blogs. technet. com/markrussinovich Advanced Windows Debugging Blog http: //blogs. msdn. com/ntdebugging Crash Dump Analysis and Debugging Portal http: //www. dumpanalysis. org

Additional Information David Solomon Expert Seminars offers training on Windows Internals both as public and private workshops and public webinars via the Internet Currently scheduled up and coming classes Public workshop in London scheduled March, 2010 Public webinar scheduled for January, 2010 Visit http: //www. solsem. com for further course descriptions and up to date information

question & answer

Resources www. microsoft. com/teched www. microsoft. com/learning Sessions On-Demand & Community Microsoft Certification & Training Resources http: //microsoft. com/technet http: //microsoft. com/msdn Resources for IT Professionals Resources for Developers

Complete an evaluation on Comm. Net and enter to win an Xbox 360 Elite!


© 2009 Microsoft Corporation. All rights reserved. Microsoft, Windows Vista and other product names are or may be registered trademarks and/or trademarks in the U. S. and/or other countries. The information herein is for informational purposes only and represents the current view of Microsoft Corporation as of the date of this presentation. Because Microsoft must respond to changing market conditions, it should not be interpreted to be a commitment on the part of Microsoft, and Microsoft cannot guarantee the accuracy of any information provided after the date of this presentation. MICROSOFT MAKES NO WARRANTIES, EXPRESS, IMPLIED OR STATUTORY, AS TO THE INFORMATION IN THIS PRESENTATION.