Wind Veering and Backing and Geostrophic Temperature Advection

ﺑﺴﻢ ﺍﻟﻠﻪ ﺍﻟﺮﺣﻤﻦ ﺍﻟﺮﺣﻴﻢ Wind Veering and Backing, and Geostrophic Temperature Advection
 of the isohypses")
Tilt of the pressure surface For a given distance (���� ) of the isohypses the magnitude of the geostrophic wind can be determined with the aid of equation (6. 2).
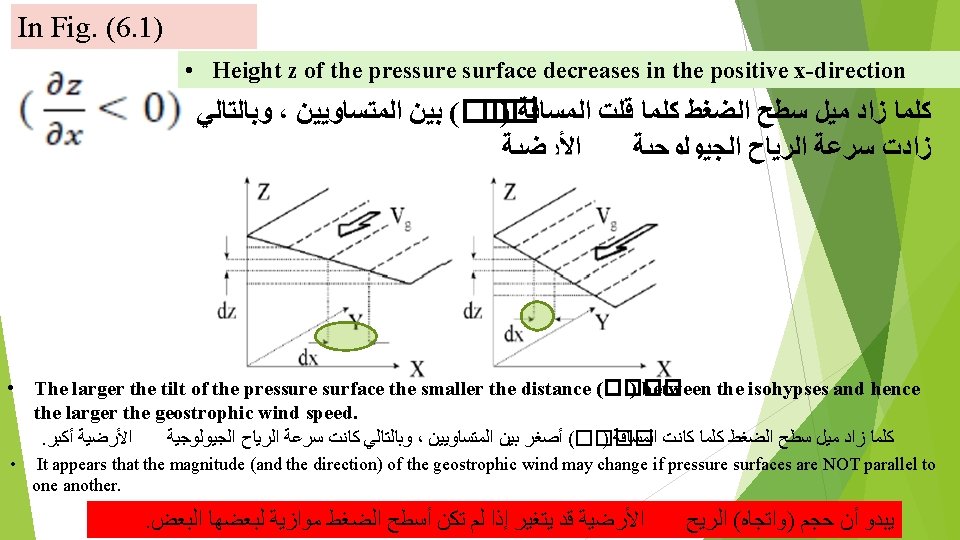

6. 2 The Relation with Temperature In an area with high temperatures, the density at a given pressure is lower than in an area with low temperatures (where the density is higher). Because of the high density, the decrease of pressure with height in the cold area is larger than the decrease of pressure in the warm area. In the cold area, less vertical distance is needed to have the same decrease in pressure (dp). If temperature changes in the horizontal, then the pressure surface aloft is no longer horizontal but will have a tilt (Fig. 6. 2 right). A horizontal temperature gradient influences the tilt of all pressure surfaces.
, it appears that the tilt of the pressure surfaces increases")
From Fig. (6. 3), it appears that the tilt of the pressure surfaces increases higher up in the atmosphere. This will have consequences on the magnitude of the geostrophic wind: in the case sketched in Fig. (6. 3) it will increase with height. From Figures (6. 1 and 6. 3), the following conclusion can be drawn: A horizontal temperature gradient causes a change of the geostrophic wind with height (or with pressure).

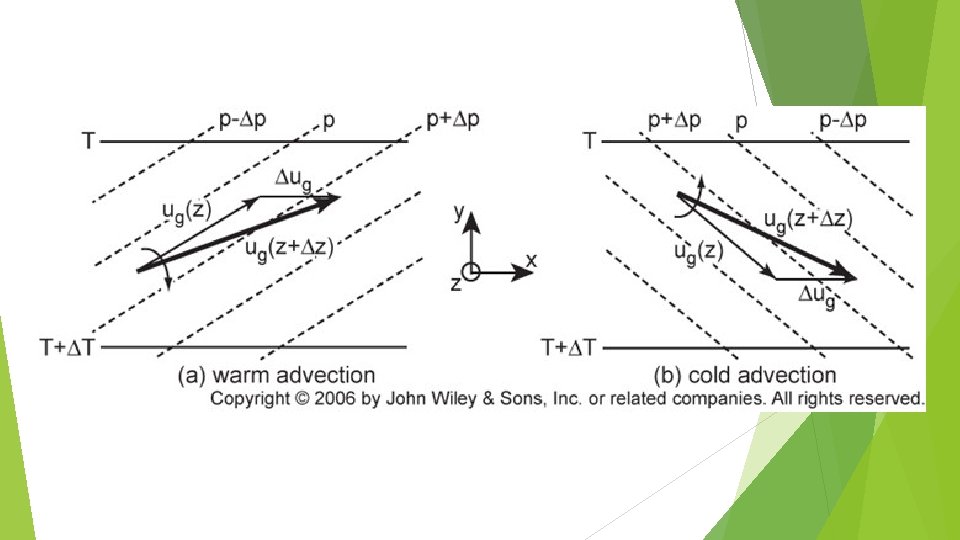
The following rule also follows from these equations: The thermal wind blows parallel to the isotherms with the cold air on the left hand side. The closer the isotherms the stronger thermal wind.
 and (6. 7) it appears that the")
Cold air advection From Equations (6. 6) and (6. 7) it appears that the direction of thermal wind is parallel to the isotherms. This leads to the following two possible situations. In Fig. (6. 4), the wind is backing going from p 0 (low level) to p 1<p 0 (higher level), in this case from west to southwest. The thermal wind is the wind vector on the high level minus the wind vector on the low level. The thermal wind blows parallel to the isotherms with the cold air on the left hand side. The geostrophic wind on both levels is blowing from the cold area. Warm air advection The thermal wind again has cold air on its left hand side, and in this case, it appears that the wind on both pressure levels is blowing from the warm area: this is a case

Hodograph and Stability Advection of air from a different average temperature, in a number of layers in the vertical, influences the stability of the atmosphere. It is relatively easy to gain an overview of the advection in different layers by performing what is called a hodograph analysis. • This involves the construction of a radial diagram with the station in the center. From this center, the wind speed at several or all pressure levels is plotted as a vector (Fig. 6. 6). • The vector is plotted in the direction of the wind. This means that a westerly wind is plotted as an arrow to the east (Fig. 6. 6). • Going to the next higher pressure level, the next arrow is plotted etc. • The end points of all vectors, are connected by straight lines (or arrows). These straight lines are the vectors of thermal wind. The end result is called a hodograph. The next step is to consider the veering or backing of the wind, starting from the lowest level to ever higher pressure levels. • In this way, the warm or cold air advection in each layer can be determined. • By comparing the areas of the triangles in relation to warm or cold air advection, it is possible to determine the changes in atmospheric stability. As an example in Fig. (6. 6) between 70 and 50 k. Pa there is more cold air advection than between 90 and 70 k. Pa. This means that in this case, the vertical temperature gradient must increase and instability is increasing.
- Slides: 9