Wind Load Factor Analysis An Exploratory Approach Snohomish


2 •")


")


- Slides: 16
Wind Load Factor Analysis: An Exploratory Approach Snohomish Wind Group Alexi Curelop, Kofi Petty, Sonya Prasertong Geography 469 Spring 2010
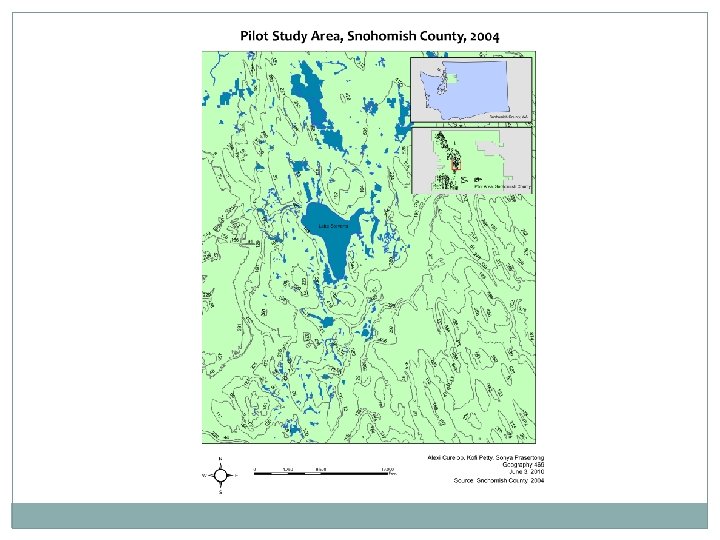
Goal and Purpose • How can we calculate and visualize the wind velocity pressure constant (Kzt factor) using the topography of Snohomish County? • Scott Beard, Plans Examiner for City of Tacoma, manually produced Kzt factors for King County and City of Tacoma • Will Rugg, GIS Analyst for Snohomish County Planning and Development Services, interested in how to automate the process via Arc. GIS • Our group decided to take on this topic in order to challenge our knowledge of how to apply GIS to real world problems
Kzt Factor Significance • Kzt factor when calculated is equivalent to specified wind speeds and is on a scale of 1 -2 (eg. Kzt of 2 = 120 mph) • It is part of a larger calculation used by planners and architects for determining appropriate areas and materials when developing land • Our project, if successful, could aid Snohomish County in reducing the costs of building and planning for their architects and planners
The Kzt Factor • Kzt = (1 + K 2 + K 3)2 • K 1 = determined from table below • K 2 = (1 – (|x|/µLh)) • K 3= e-γz/Lh Parameters for Speed-Up over Hills and Escarpments Exposure Hill Shape B µ C D γ Upwind of Crest Downwind of Crest 2 -dimensional ridges 1. 30 1. 45 1. 55 3 1. 5 2 -dimensional escarpments 0. 75 0. 85 0. 95 2. 5 1. 5 4 3 -dimensional axisym, hill 0. 95 1. 05 1. 15 4 1. 5 Source: American Society of Civil Engineers: Minimum Design Loads for Buildings and Other Structures, 2006
Need-to-Know Questions 1. What are the mid-points of the data? 2. Based off of the mid-points, what is the velocity pressure constant (Kzt factor) of the terrain? 3. How do we model the output information product?
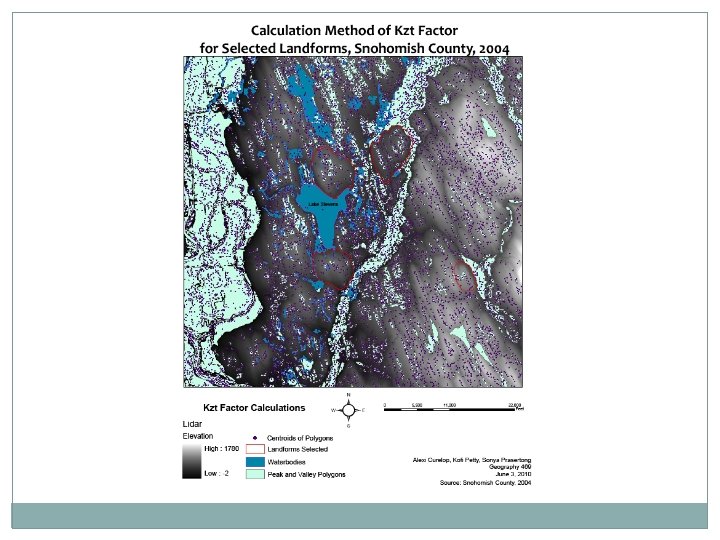
1. What are the mid-points of the data? • Using primarily Spatial Analyst, we were able to calculate the slope of our pilot area to identify base and peak elevations of landforms • We could then create a map of depicting polygons representing these areas, with the centroids for each polygon identified • Tools used: Slope Calculation, Raster Calculator, Convert Raster to Features, Neighborhood Statistics, Zonal Statistics
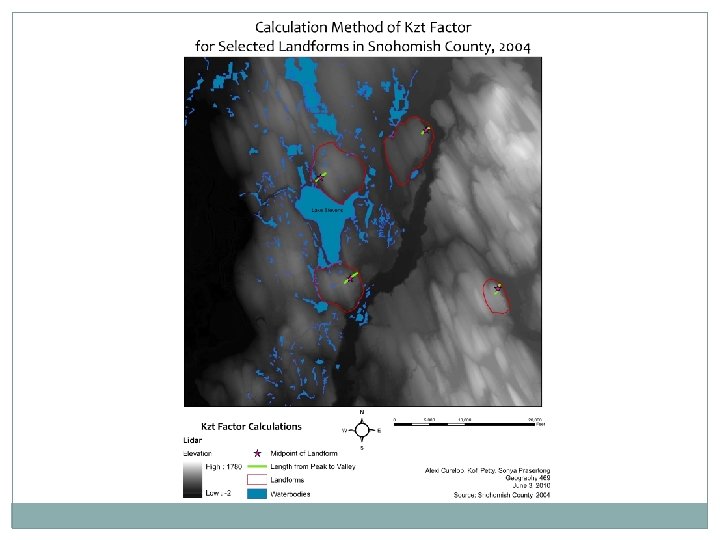
2. Based off of the mid-points, what is the velocity pressure constant (Kzt factor) of the terrain? • From here we used the Identify tool to find the exact elevations for the base and peak polygons of our landforms • We created lines and points to keep track of our calculations, which were recorded in an Excel spreadsheet • Due to the specifications of the Kzt formula, only 4 landforms were able to be selected for calculation • Tools used: Identify tool, Measurement tool, Editor toolbar, Microsoft Excel
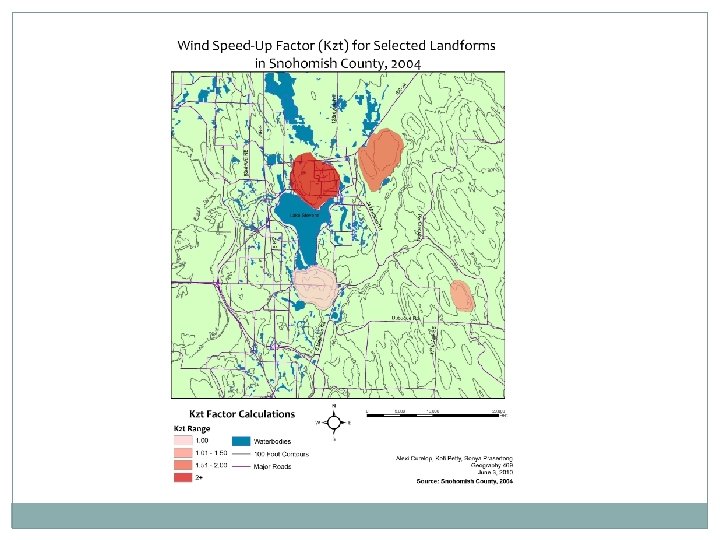
3. How do we model the output information product? • We decided the best method of visualization would be colored polygons around our selected landforms, with each color representing a range of Kzt • We decided to use the Waterbodies and Major Roads layers as a means of orienting the audience to our pilot area location • Tools used: Editor toolbar, Add Field tool, Transparency setting
Analysis/Process
Findings • Due to the specifications of what landforms can be calculated for Kzt, there were only 4 landforms that could be selected • Of these 4 landforms, each seemed to fall on the two extremes of the Kzt factor scale (either 1 or very close to 2). • Kzt Factor Results: Landform A = 2. 43 Landform B = 1. 99 Landform C = 1. 00 Landform D = 1. 93
Conclusions • The area we selected contained landforms on both extremes of the Kzt factor scale of 1 -2 • We were able to automate the process of calculating peak and base elevations • More time is needed in order to create a more complex pilot study • Python scripting could assist in automating our manual Kzt calculations • Due to our lack of comprehensive knowledge of the particulars of civil engineering formulas, errors in calculations were a possibility
Recommendations • Creating a Python script that can automatically run the manual calculations we performed • Work with individuals that have an in-depth knowledge of both the capabilities of GIS as well as civil engineering background to limit possible errors in calculations • Allow for a study with a longer timeline