Wind Energy www wind appstate edu Sizes and

 • Homes (Grid connected) • Farms")

 Cost of Energy (cents/k. Wh*) Cost of Energy")


 Top 5 Counties in Western NC 1 2")


 Wind Resource Assessment a. NC State Wind Map b. Anemometer loan")

- Slides: 26
Wind Energy www. wind. appstate. edu
Sizes and Applications Small ( 10 k. W) • Homes (Grid connected) • Farms • Remote Applications (e. g. battery changing, water pumping, telecom sites, icemaking) Intermediate (10 -500 k. W) • Village Power • Hybrid Systems • Distributed Power Large (500 k. W – 6 MW) • Central Station Wind Farms • Distributed Power • Offshore Wind Generation Stations
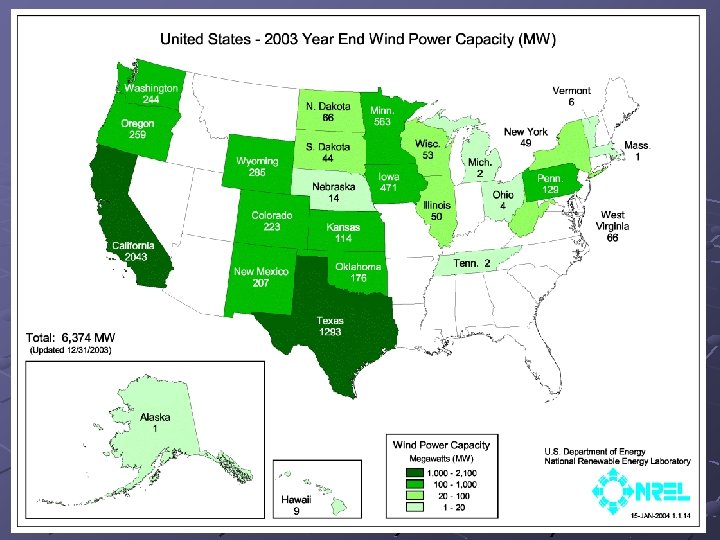
World Growth Market Total Installed Wind Capacity 1. Germany: 14000 MW 2. United States: 6374 MW 3. Spain: 5780 MW 4. Denmark: 3094 MW 5. India: 1900 MW World total 2003: 37220 MW Source: Wind. Power Monthly
Capacity & Cost Trends Capacity (MW) Cost of Energy (cents/k. Wh*) Cost of Energy and Cumulative Domestic Capacity *Year 2000 dollars Increased Turbine Size - R&D Advances - Manufacturing Improvements
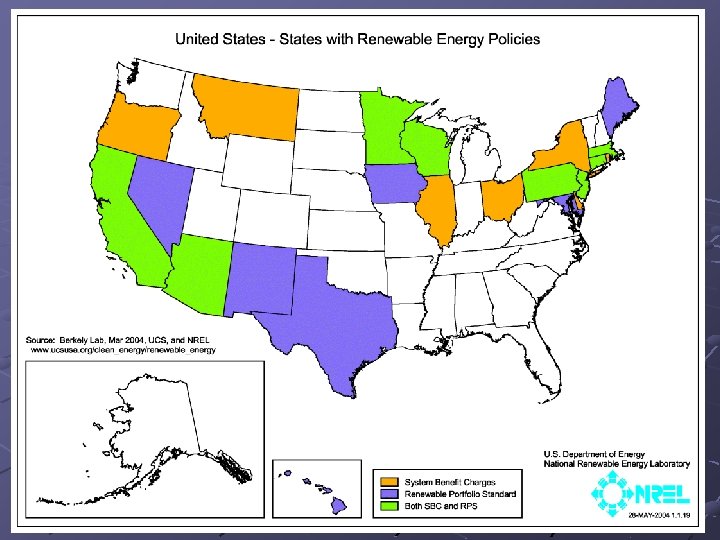
Drivers for Wind Power Declining Wind Costs Fuel Price Uncertainty Federal and State Policies Economic Development Green Power Energy Security
Net Metering By State 25 k. W 50 k. W 15/150 k. W 100 k. W 40 k. W 25 k. W 20 k. W 25/100 k. W 25 k. W No Limit 30 k. W 25 k. W 10/400 k. W PV Only 10 k. W 100 k. W, 25, 000 k. Wh/y 50 k. W 60 k. W 25 k. W 1, 000 No 40 k. Wh/ Limit mo 10/25 k. W 1 MW 100 k. W 25 k. W 10/500 k. W 80 k. W Solar Only 25/100 k. W 25/ 100 k. W 10/100 k. W PV Only 50 k. W Monthly Net Metering Annual Net Metering Varies by Utility or Unknown None Individual Utilities Revised: 9 Jul 04 Investor-Owned Utilities Only, Not Rural Cooperatives Investor-Owned Utilities and Rural Cooperatives
Benefits • • • 5 million KWH/yr 500 homes $500, 000/yr green power 7. 5 million lbs CO 2/yr 8. 3 tons NOX/yr
Economic Development Impacts Land Lease Payments: 2 -3% of gross revenue $2500 -4000/MW/year Local property tax revenue: 100 MW brings in on the order of $1 million/yr 1 -2 jobs/MW during construction 2 -5 permanent O&M jobs per 50 -100 MW, Local construction and service industry: concrete, towers usually done locally Manufacturing and Assembly plants expanding in U. S. (Micon in IL, LM Glasfiber in ND)
Reliability of Wind Turbines 100 % Available 80 60 40 20 0 1981 '83 '85 '90 '98 Year
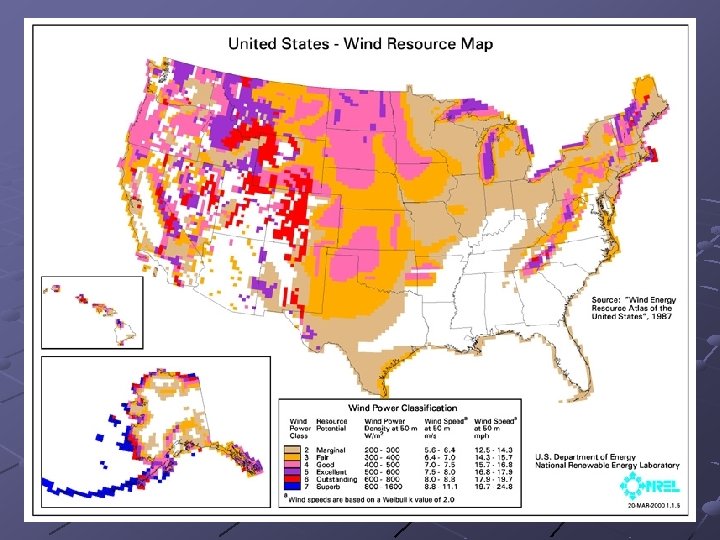
Location and Percentage of High Quality Wind Resources in the US Class 6 (4. 3%) Class 5 (6. 3%) Class 4 & above 27. 5%
North Carolina Wind Map
Ashe & Watauga County Wind Classes
Land Areas of Wind Power Classes in 24 Western NC Counties Class @ 50 m Power Density (W/m 2) Area (acres) Percentage of Total 1 - < 100 3, 889, 086 59. 32 1+ (100, 200] 1, 895, 923 28. 92 2 (200, 300] 473, 175 7. 22 3 (300, 400] 159, 767 2. 44 4 (400, 500] 68, 013 1. 04 5 (500, 600] 30, 374 0. 46 6 (600, 800] 24, 275 0. 37 7 > 800 15, 419 0. 24 >= 2 (200, > 800] 771, 024 11. 76 >= 4 (400, > 800] 138, 000 2. 1
Wind Resource Analysis by County (acres) Top 5 Counties in Western NC 1 2 3 4 5 6 7 2 -7 4 -7 Haywood 99484 36769 19294 9360 4576 5120 3242 78361 22298 Watauga 93356 47809 14302 5396 2303 1729 939 72480 10368 Buncombe 191061 33596 13976 6592 3182 2688 2668 62705 15132 Ashe 184824 40000 9162 4190 1877 1166 58277 9113 Avery 79528 9281 4210 2352 1739 1107 46495 9409 27804
County Wind Maps for Western NC True Wind Map Combined With: § Road data § Digital elevation models § Public lands § Appalachian Trail § Town boundaries § Utility grid § Tax parcel maps www. wind. appstate. edu
North Carolina Coastal Resources
Wind Monitoring Activities
Number of Turbines in Class 4/5 Sites @ 80 m to produce:
Small Residential Scale Turbines could power 1 - 6 houses (3, 000 – 60, 000 WWH/yr)
Small Wind Initiative
Issues for Wind Energy Issues for Wind Legal n “ridge law” n park/forestrictions Visual Impacts Attitudes towards Wind Avian Impacts Indirect negative economic impacts n real estate values
Wind Activities 1) Wind Resource Assessment a. NC State Wind Map b. Anemometer loan program c. TVA wind assessment work d. NC Wind Energy Assessment Projects 2) Education a. Small Wind Workshops at ASU and Solar Center b. Wind Summit in Boone, NC c. Anemometer loan program d. Small Wind Initiative 3) Wind Working Group 4) Economic impact analyses 5) Environmental and Avian Impact analyses 6) Legal/Permitting Issues 7) Attitudinal surveys 8) Web Site: http: //www. wind. appstate. edu/
In conclusion: §Good wind resources in mountains and along coastal areas in all southeastern states, although not widespread, § Technology is available, reliable and economical, § Majority seem to support wind energy, although significant opposition exists, § significant barriers/ concerns, § more possibilities for small wind