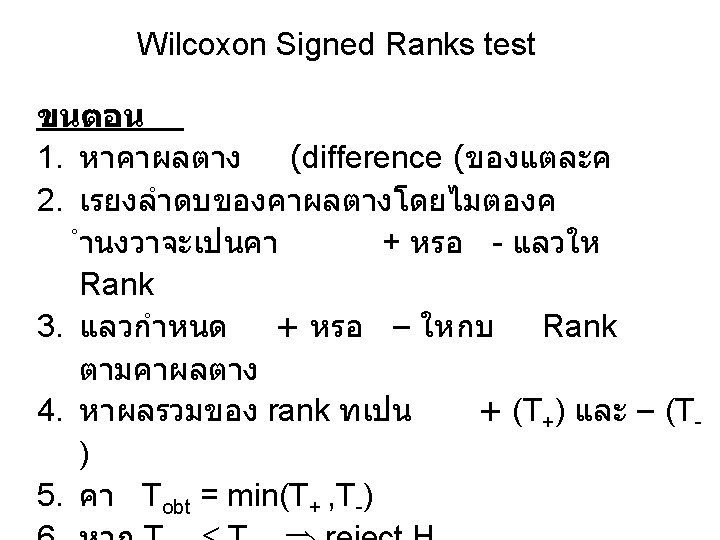
Wilcoxon Signed Ranks test 2 correlated group design


 in contaminated raw meat between pairs")


 nondialyzed patient (2) dialyzed")

 nondialyzed patient (2) dialyzed")


 observed the behavior of 6 male colobus monkeys (Colobus guereza)")


- Slides: 28
Wilcoxon Signed Ranks test ����� ? • 2 correlated group design • ������������� 1. 2. Before/Method 1 After/Method 2 ����� Ho: ��� Median ��������� 0 H 1: ��� Median ��������� 0 Contrary to paired t-test Ho: ��� Mean ��������� 0
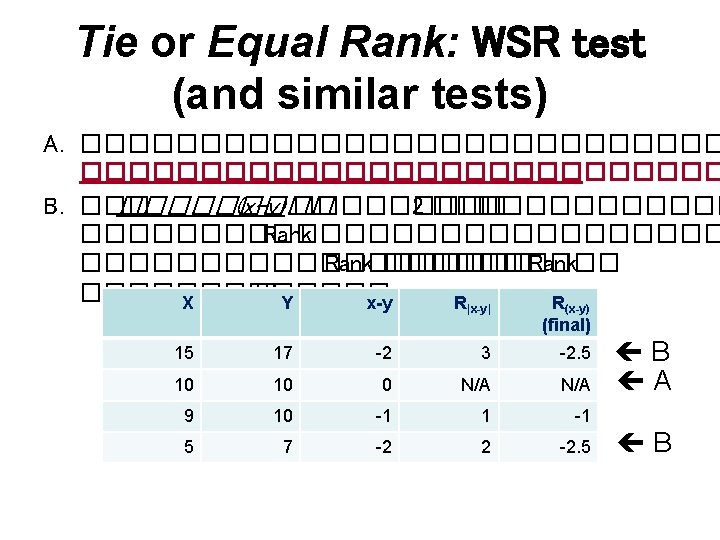
• If N > 2 , 5 then use Tmin to estimate z (one-tail) for testing hypothesis – Note: some may say that N as few as 8 can be used this estimation where • Tmin = min(T+ , T-) • N : number of all pair differences not equal to 0; may be the same as or less than that of observations • ts : number of pair differences with the same rank sth, i. e. tied ranks; summation of all groups (r) of tied ranks is necessary
Ho: The median difference of polybrominated biphenyl (PBB) in contaminated raw meat between pairs is equal to 0 H 1: The median difference of polybrominated biphenyl (PBB) in contaminated raw meat between pairs is not equal to 0 Example Sample Raw Cooked difference |difference| Rank Sign 1 0. 19 0. 15 0. 04 - 0. 04 4 - -4 2 0. 20 0. 10 - 0. 10 8 - -8 3 0. 01 0. 02 0. 01 1 + 1 4 0. 16 0. 18 0. 02 2 + 2 5 0. 10 0. 05 - 0. 05 5 - -5 6 0. 27 0. 04 0. 23 - 0. 23 9 - -9 7 0. 08 0. 01 0. 07 - 0. 07 6 - -6 8 0. 23 0. 15 0. 08 - 0. 08 7 - -7 9 0. 07 0. 04 0. 03 - 0. 03 3 - -3 10 0 Median difference = -0. 05, Tobt=3 Tcrit, 2 -tailed, α=0. 05, N=9 = 5 z = -2. 31; P 2 -tailed = 0. 02 Rank+ T+=3 Rank- T-=-42 Conclusion: Because of Tobt<Tcrit, Reject Ho and accept H 1; thus, cooking does decrease PBB level in contaminated meat
Example Does hemodialysis have effect on the size of the liver? Ho: Mean ranks of liver sizes in three groups are the same H 1: Mean ranks of liver sizes in three groups are NOT the same Control nondialyzed patient 206. 90 194. 60 288. 00 150. 00 145. 60 269. 20 197. 30 174. 90 288. 30 173. 20 187. 50 357. 50 147. 20 223. 40 229. 20 143. 80 143. 00 249. 00 192. 60 170. 00 346. 10 216. 60 202. 60 213. 50
Ranking Group 2 1 1 2 2 Scores 143. 00 143. 80 145. 60 147. 20 150. 00 173. 20 174. 90 187. 50 Rank 1 2 3 4 5 6 7 8 9 Group 1 2 1 3 3 2 3 Scores 192. 60 194. 60 197. 30 202. 60 206. 90 213. 50 216. 60 223. 40 229. 20 Rank 10 11 12 13 14 15 Group 3 3 3 Scores 249. 00 269. 20 288. 00 288. 30 346. 10 357. 50 Rank n 1 = R 1 = 19 20 7 54 21 22 n 2 = R 2 = 23 24 7 55 16 k N 17 = 3 = 24 18 n 3 = 10 R 3 =191
Hcrit, α=0. 05, df=2 = 2α=0. 05, df=2 = 5. 991 P = chisq. dist. rt(14. 94, 2) = 0. 0005 Hobt > Hcrit, reject Ho, that is, difference in liver size does exist among three populations
Which group has the largest size of liver? Control (1) nondialyzed patient (2) dialyzed patient (3) 206. 90 194. 60 288. 00 150. 00 145. 60 269. 20 197. 30 174. 90 288. 30 173. 20 187. 50 357. 50 147. 20 223. 40 229. 20 143. 80 143. 00 249. 00 192. 60 170. 00 346. 10 216. 60 202. 60 213. 50
Which group has the largest size of liver? Using Dunn procedure •
Which group has the largest size of liver? Control (1) nondialyzed patient (2) dialyzed patient (3) 206. 90 194. 60 288. 00 150. 00 145. 60 269. 20 197. 30 174. 90 288. 30 173. 20 187. 50 357. 50 147. 20 223. 40 229. 20 143. 80 143. 00 249. 00 192. 60 170. 00 346. 10 216. 60 202. 60 213. 50 * 1 - * z 1 - * = 0. 05 = 0. 00833 = 0. 99167 = 2. 39398 |z 12| = |z 13| = |z 23| = 0. 03780 3. 26738 3. 22639 * *
Something’s different but results are the same Mann-Whitney U test Kruskal-Wallis test Ranks N 6 Mean Rank 10. 08 Sum of Ranks 60. 50 Protein 14 10. 68 149. 50 Total 20 Marker class F_st value DNA Ranks F_st value Marker class DNA Protein Total N 6 14 20 Mean Rank 10. 08 10. 68 Test Statisticsb F_st value Mann-Whitney U 39. 500 Test Statisticsa, b F_st value Chi-Square 0. 043 Wilcoxon W 60. 500 df Z -0. 206 Asymp. Sig. 0. 837 Exact Sig. 0. 857 Point Probability 0. 033 Asymp. Sig. (2 -tailed) Exact Sig. [2*(1 -tailed Sig. )] 0. 837 0. 841 a 1
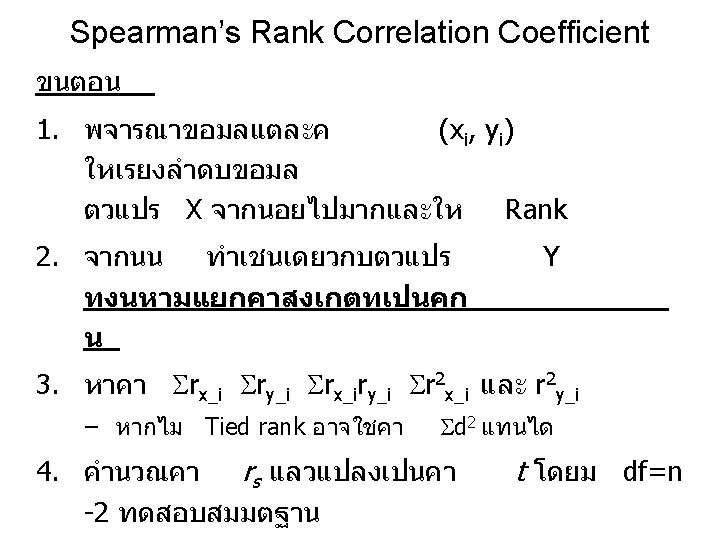
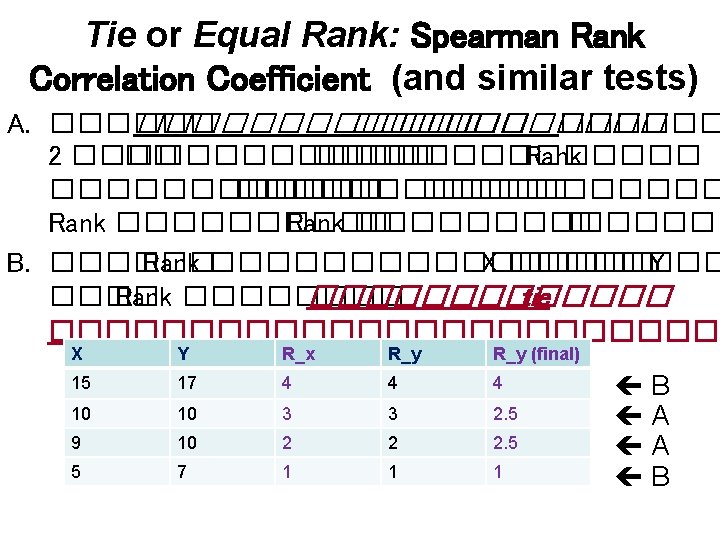
Spearman’s Rank Correlation Coefficient • When to use • Finding bivariate correlation for ordinal or ranked variables, or for data with uncertainty about normality • Detecting monotonic correlation between variables • A monotonic function is one that either never increases or never decreases as its independent variable increases. The following graphs illustrate monotonic functions: Monotonically increase – as x increases, y never decreases Monotonically decrease – as x increases, y never increases Non-monotonic – as x increases, y sometimes decreases and sometimes increases
Spearman’s rank correlation coefficient, rs n=# paired ranks rx_i=ranks of xi variables ry_i=ranks of yi variables rx_i=sum of ranks of x variable
Spearman’s rank correlation coefficient, rs • •
Approximation of t for testing rs df = n-2 where n=# paired ranks
Value of rs Interpretation r= 0 The two variables do not vary together at all The two variables tend to increase or decrease together Perfect correlation < 0 r > 1 r = 1. 0 < 1 -r > 0 r = -1. 0 One variable increases as the other decreases Perfect negative or inverse correlation
Melfi and Poyser (2007) observed the behavior of 6 male colobus monkeys (Colobus guereza) in a zoo and number od eggs of Trichuris nematodes per gram of monkey feces. They wanted to know whether social dominance was associated with the number of nematode eggs. Ho : social dominance and the number of nematode eggs are NOT associated H 1 : social dominance and the number of nematode eggs are associated Monkey Dominance name rank, x Eggs per Rank of Eggs gram per gram, y Erroll 1 5777 1 Milo 2 4225 2 Fraiser 3 2674 3 Fergus 4 1249 4 Kabul 5 749 6 Hope 6 870 5 Tcal > Tcrit [or P << 0. 05] reject Ho and accept H 1, that is social dominance and the number of nematode eggs are statistically associated From -- http: //www. biostathandbook. com/spearman. html
Ho: No correlation between nicotine in blood and nicotine in cigar H 1: There is correlation between them Nicotine in r blood )nmol/L( cigar )mg( x sum ry d d 2 r 2 x r 2 y rx*ry 196. 5 0. 76 4 1 3 9 16 1 4 192. 8 0. 84 3 2 1 1 9 4 6 197. 3 0. 96 5 3 2 4 25 9 15 199. 1 1. 11 6 4 2 4 36 16 24 207. 4 1. 14 9 5 4 16 81 25 45 204. 2 1. 21 8 6 2 4 64 36 48 183. 0 1. 28 1 7 -6 36 1 49 7 185. 7 1. 51 2 8 -6 36 4 64 16 234. 1 1. 53 10 9 1 1 100 81 90 199. 9 1. 66 7 10 -3 9 49 100 70 120 385 325 55 55
rx sum ry 55 d 55 d 2 120 r 2 x 385 r 2 y 385 rx*ry 325
Hypothesis testing tcal = 0. 801 df=8 P = t. dist. 2 t(0. 801, 8)=0. 94 Tcrit, 2 -tailed, α=0. 05 = 2. 306 tcal < tcrit Retain H 0, that is there is no statistically correlation between nicotine in blood and nicotine in cigar
Pearson, rp, vs Spearman rank, rs, correlation coefficients Perfect positive monotonic relationship Perfect negative monotonic relationship rp= 0. 647 rs= 1. 000 rp= -0. 647 rs= -1. 000 rp= 0. 008 rs= 0. 000 NO monotonic relationship, but perfect quadratic relationship rp= 0. 022 rs= 0. 069 NO relationship