Why Probability and Statistics some examples zwpustc edu
 3600565 Dept of")
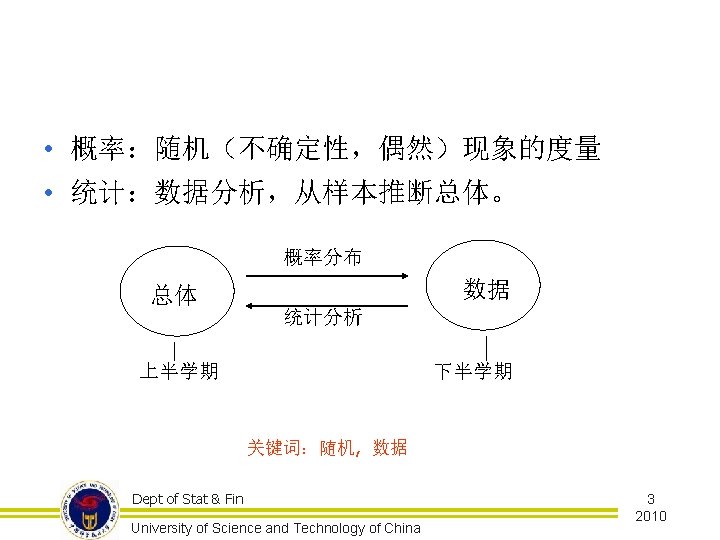
Why Probability and Statistics? ----some examples 张伟平 zwp@ustc. edu. cn (O) 3600565 Dept of Stat & Fin 部分摘录自 -----A Modern Introduction to Probability and Statistics: Understanding Why and How, Springer, 2005 University of Science and Technology of China 1 2010

简介:概率论和数理统计 Diagram showing the difference between statistics and probability. (Image by MIT Open. Course. Ware. Based on Gilbert, Norma. Statistics. W. B. Saunders Co. , 1976. ) Dept of Stat & Fin University of Science and Technology of China 2 2010


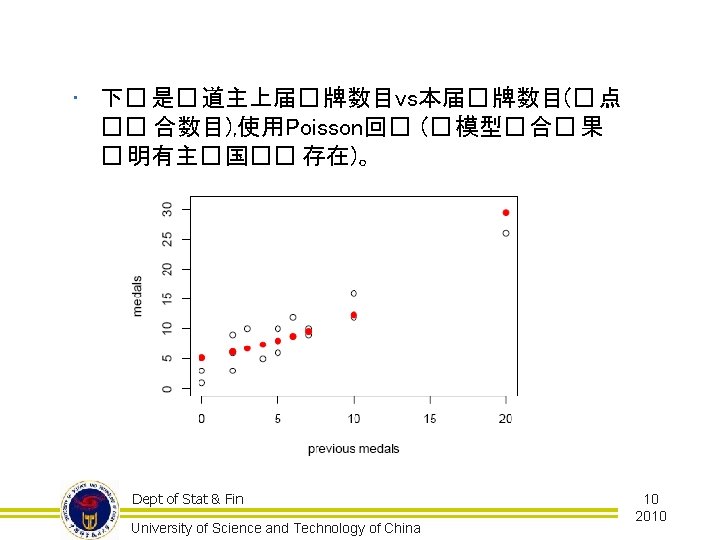
Ex 1: 主办国优势 1932-1998 年冬奥会主 � 国� 牌数 和上一届� 牌数。 Dept of Stat & Fin University of Science and Technology of China 8 2010

Ex 2: 主办国优势 n 中国可能的金牌数? Dept of Stat & Fin University of Science and Technology of China 13 2010
![模型: 拟合结果 所以北京奥运会的 金牌数为 49. 294, 95%置信区间为[41. 05171, 57. 50797]. Dept of Stat &](http://slidetodoc.com/presentation_image_h2/7868ee4dedd6b4fcd84e5dd0c28af6fd/image-14.jpg "模型: 拟合结果 所以北京奥运会的 金牌数为 49. 294, 95%置信区间为[41. 05171, 57. 50797]. Dept of Stat &")
模型: 拟合结果 所以北京奥运会的 金牌数为 49. 294, 95%置信区间为[41. 05171, 57. 50797]. Dept of Stat & Fin University of Science and Technology of China 14 2010
 mortality in Dutch men during 1996 European football")
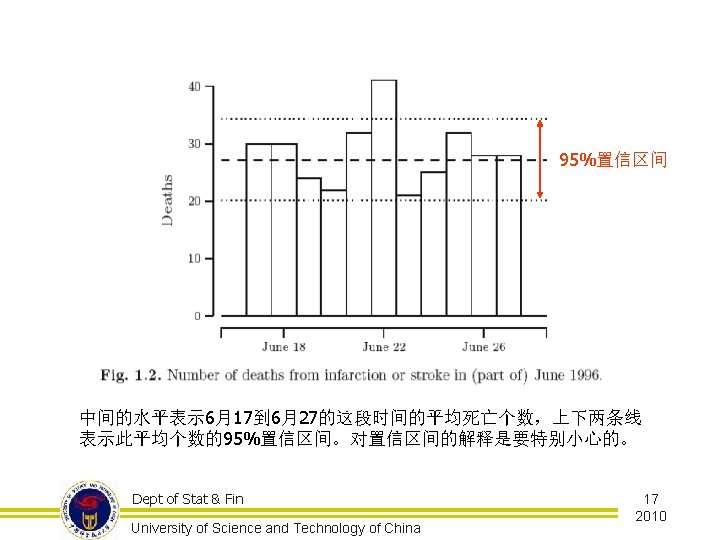
Ex 3: Killer football n Cardiovascular(心藏血管) mortality in Dutch men during 1996 European football championship: longitudinal population study, 2000,British Medical Journal,321: 1552 -1554 n 作者声称 6月22号那� 足球比�� 全国 人口死亡率有着明� 的影响! Dept of Stat & Fin University of Science and Technology of China 15 2010

详细资料:http: //mil. qianlong. com/4919/2003/09/21/42@1605800. htm Dept of Stat & Fin University of Science and Technology of China 20 2010
, 则女儿的身高预测值为(163.")
§ 使用回归得到 Dheight= 30. 4869+0. 5326*Mheight n 如果母亲的身高为 63. 78 inches (162 cm), 则女儿的身高预测值为(163. 7 cm) 64. 45613=30. 4869+0. 5326*63. 78 进一步, 预测的95%置信区间为[152. 3 cm, 175. 14 cm] Dept of Stat & Fin University of Science and Technology of China 21 2010

下表是四个厂家所使用的月份字母编码 Dept of Stat & Fin University of Science and Technology of China 26 2010

An Empirical Approach to Economic Intelligence in World War II Richard Ruggles, Henry Brodie, JASA, Vol. 42, No. 237 (Mar. , 1947), pp. 72 -91 Dept of Stat & Fin University of Science and Technology of China 29 2010

§ 在Michelson的时代,光速已经知道大约是 300000 km/s,因此他的目标是使此值更准 确! § 下图表示了Michelson的实验装置 Dept of Stat & Fin University of Science and Technology of China 33 2010

Dept of Stat & Fin University of Science and Technology of China 34 2010
 § 每个量的测量中都存在误差!单独的误差 可能回严重影响最终的结果!")
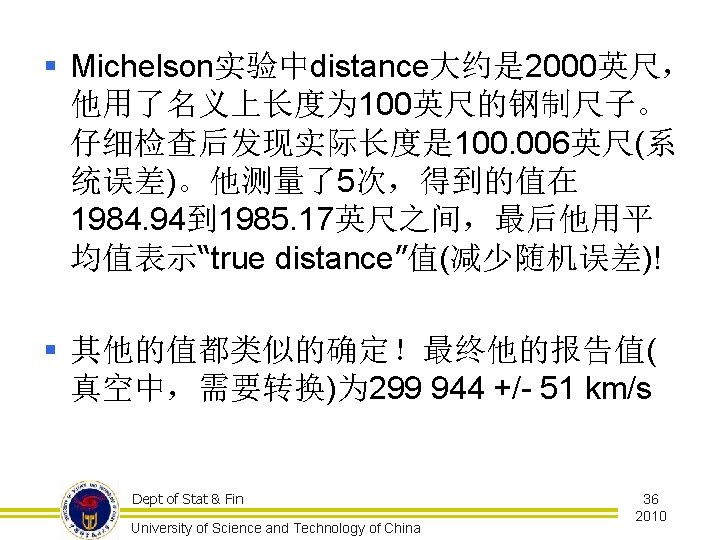
§ • • 因此需要测量四个量: Distance Radius Displacement Revolutions per seconds (rps) § 每个量的测量中都存在误差!单独的误差 可能回严重影响最终的结果! Dept of Stat & Fin University of Science and Technology of China 35 2010

§ 尽管Michelson很小心的测量,但是仍忽略 了一些误差! § 现在的测量方法显示光在真空中的速度的 95%置信区间为 299 944+/-15. 5 km/s! http: //en. wikipedia. org/wiki/Albert_Abraham_Michelson Dept of Stat & Fin University of Science and Technology of China 37 2010

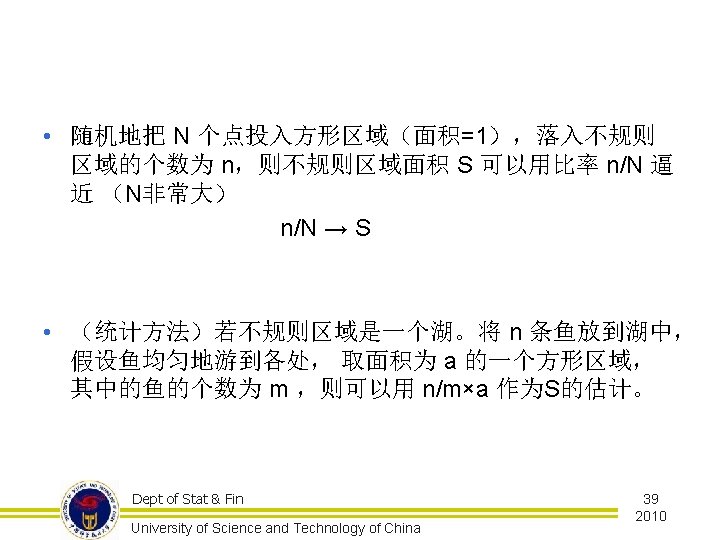
Ex 7: 蒙特卡罗方法 如何求不�� 区域的面� ? Dept of Stat & Fin University of Science and Technology of China 38 2010
的500个Index的首位 数字的统计频数( 1986. 1. 2 – 1995. 12.")
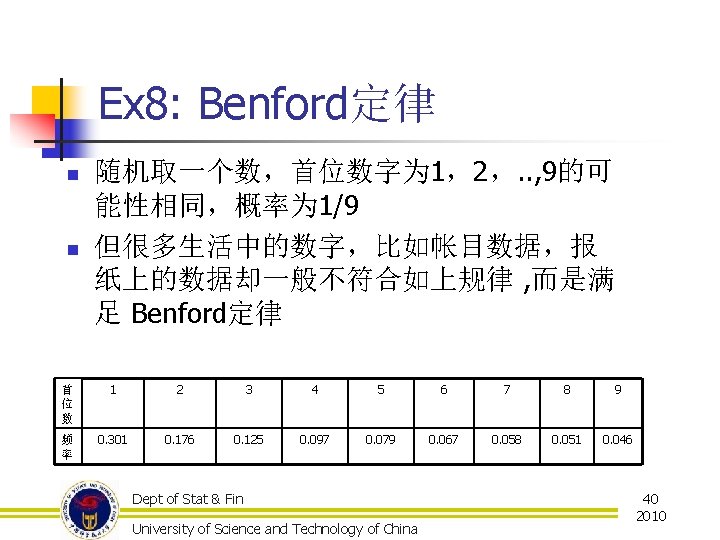
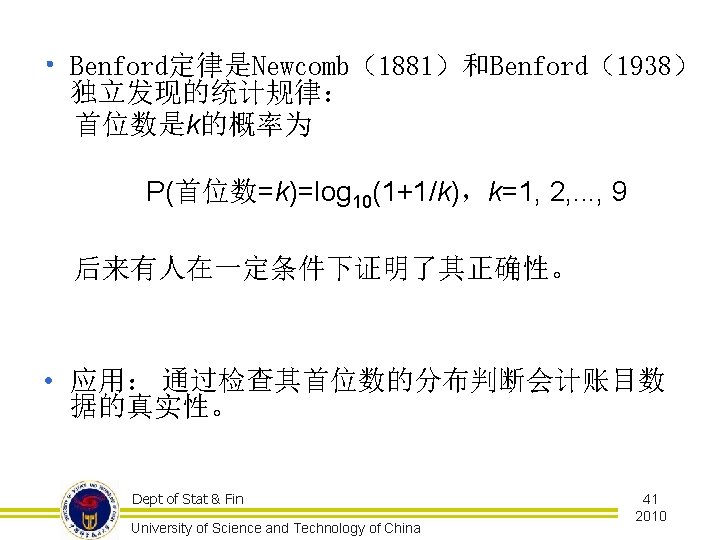
• 例. Standard & Poors (S&P)的500个Index的首位 数字的统计频数( 1986. 1. 2 – 1995. 12. 29 )。该 批数据是否满足Benford定律? 首位数 1 2 3 4 5 6 7 8 9 频数 735 432 273 266 200 175 169 148 126 期望数 760 445 315 245 200 169 146 129 116 --- 皮尔逊(Pearson)卡方检验。基本符合定律。 Dept of Stat & Fin University of Science and Technology of China 42 2010

§ § More Amazing Applications of Probability and Statistics, visit http: //www. intuitor. com/statistics/ or Search Google Read “How to lie with statistics” …… Dept of Stat & Fin University of Science and Technology of China 43 2007

Dept of Stat & Fin University of Science and Technology of China 44 2007
- Slides: 44