Why Performance Measurement Matters Why Performance Measurement Matters


 How can we make it happen? • Event")
 Example In the past 10 years,")


")
 Waterworks Benchmark Results (National Water and Wastewater Benchmarking Initiative)")


- Slides: 68
Why Performance Measurement Matters
Why Performance Measurement Matters “Above all… measurement is meant to enable us to take purposeful action based on knowledge rather than opinion or guesswork. ” -Peter F. Drucker in the Practice of Management
Welcome and Learning Objectives
• Why performance measurement and why now? • The role of finance in performance measurement • Principles of effective performance measurement • The difference between benchmarking and performance accountability. • Introduction to Results Based Accountability • Special issues with performance measurement • Special issues in data presentation 4
Why does Performance Measurement Matter to You? • What ways have you, personally, started to use performance data in your day to day life? – Bathroom scale? – MER for mutual funds? – Map My Run, Strava, My Fitness Pal? – Score in LOTRO? • Why do you care about any of these things?
Why does Performance Measurement Matter for Government? • “Value for Money” • Transparency • Funders require data (Infrastructure Ontario)
Familiar Areas of Performance Measurement • Internal – Staff performance appraisals – Budget Variance Report – Other? • External – Strategic Plans – Benchmark Reports (FIR, MPMP, OMBI) – Economic Development Reports (eg: Economist Livability Index) – Other?
What Issues Arise when you Commit to a Performance Measurement Framework? • What is the purpose of the reporting? – Pay for performance? – Budget cutting? – Optimizing performance? • Who is the audience of the reports and how sophisticated are they? – Internal management? – Councillors? – Taxpayers? • What do I want them to know and not know? – “telling Council is not going to me any good. ”
Downsides of Performance Measurement • Ideas?
What do we mean by Performance? Examples of metrics regularly seen in “performance reports” • Regular tracking of activity – • eg: number of fire calls, number of performance appraisals completed, number of development applications received etc. Tracking of performance to targets – eg: budget to actuals variance, emergency call response times, number of development applications processed on time, etc. • Monitoring of Indicators – eg: credit rating, air quality, precipitation, GDP, construction starts, etc. • Benchmarking – eg: Municipal Performance Measurement Program (MPMP), Ontario Municipal Benchmarking Initiative (OMBI), National Water and Wastewater Benchmarking Initiative (NWWBI), etc.
• Why performance measurement and why now? • The role of finance in performance measurement • Principles of effective performance measurement • The difference between benchmarking and performance accountability. • Introduction to Results Based Accountability • Special issues with performance measurement • Special issues in data presentation 11
Why Finance? • Typical finance role in a private sector corporation • Finance already handles MPMP and often OMBI – experience and systems in place. • Finance professionals have background and skills in managing and analyzing large data sets. • Finance is the dumping ground for everything else no one wants to do. (Joke? ) 12
Why not Finance? • Performance Measurement is linked to financial savings rather than performance optimization. • “Why should I report to those pencil heads about my road quality data? ” Privileging of financial analysis over other professionals (engineers, social workers, health workers, lawyers). • Offloading of managerial responsibility to Finance rather than self-ownership – “Finance told me to do it that way. ” 13
Finance Leads, Services Own • Finance provides the leadership, tools and framework …. . BUT • Service Owners are accountable and provide direction on appropriate metrics and methodologies. 14
Who else could lead a corporate performance measurement initiative? • Ideas? • How might the initiative be different? 15
• Why performance measurement and why now? • The role of finance in performance measurement • Principles of effective performance measurement • The difference between benchmarking and performance accountability. • Introduction to Results Based Accountability • Special issues with performance measurement • Special issues in data presentation 16
Principles of Successful Performance Measurement Recommendations for Strengthening Performance Measurement / Management Systems Presentation to GFOA by Harry Hatry – Urban Institute 1. Determining what information will be useful and how to obtain it 2. Analyzing that information 3. Using the information New report on PM best practices (Free) expected on Urban Institute website in about four weeks website: http: //www. urban. org 17
Melinda’s Principles of a Successful Performance Measurement Framework 1. Quality data Data meets minimum standards while being efficient to collect 2. Consistency in Collection People responsible for collection know what they are being asked to do 3. Consistency in Reporting tools are consistent and comparable over time 4. Potential for Analytics Information is collected and stored in a manner that make analysis possible 5. Clarity for audience Audience can understand use the resulting data 6. Clarity of Purpose Staff, managers, councillors know why you are collecting and reporting performance data and understand their roles. 18
Consistency in Collection and Reporting 19
Sample Data Dictionary Data Characteristic Metric Name and Id No. Service Name and Description Metric Value Proposition Type of Indicator (Quality, Quantity, Result, Cost, Population, Performance) Numerator Definition and Source Denominator Definition and Source Data Frequency Data Timeliness Reliability and Accuracy Known Tolerances Unit of Measure Preferred Trend Targets / Benchmarks and Source Accountability References, Guidelines, Technical Support Description
Potential for Analytics The Government Finance Officers Association found in 2013 that advanced technology was not widely used for performance analysis and one CIO refused to implement advanced dashboards until they had learned to collect and use the data they had. Lessons from Performance Measurement Leaders: A Sample of Larger Local Governments in North America http: //www. gfoa. org/lessons-performance-management-leaders-sample-larger-local-governmentsnorth-america Simple Excel Based Data Collection Tool 21
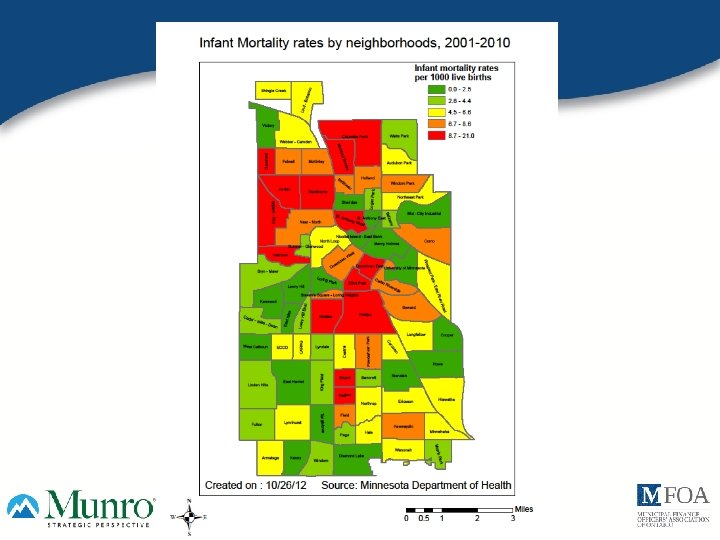
Moving up the analytics continuum (Minneapolis) How can we make it happen? • Event correlation What will happen? • Traffic impact • Weighted hotspot What happened and why? • Pattern discoverer • Hotspot • Anomaly detection • GPS analysis How are things going? • Dashboard • Scheduled report
Analytics - A Real Life (not so good) Example In the past 10 years, Vancouver has seen an increase in the quality of its priority pavements: Arterial, Bus Routes and Bike Routes. Compared to other municipalities, Vancouver has more “good” pavements.
What Happened Next!
Clarity of Purpose MPMP – Provincial Mandatory Monitoring Program OMBI – Voluntary Benchmarking Sharing Program Performance Appraisals – Staff Engagement and Improvement Pay for Performance – Management Evaluation and Accountability Other?
Clarity of Purpose - Elements of an Accountability Framework Senior Leadership Ownership Buy In is not enough Reliable Framework No one wants to be accountable to unreliable data Regular Reporting Annual metrics in the budget report never get looked at Local Reflection on benchmark data OMBI (NWWBI, MPMP, etc. ) is no replacement for local data with local interpretation Vigorous Debate Challenge the meaning of the results and push to find ways to “turn the curve” on poor results Follow Up Even without “targets” service owners need to be charged to demonstrate improvement over time. AVOID Tying performance results to pay, jobs, or other personal benefits.
Accountability Examples • New York and Baltimore City. Stat, Boston About Results, Results Minneapolis – meetings every two weeks. • Vancouver – three “variance” meetings per year: yearend, Q 2 Service Reviews and Q 3 pre-budget. • Windsor – annual Corporate Strategic Action Plan Report Card. • OMBI – annual performance report publicized and circulated to all members
• Why performance measurement and why now? • The role of finance in performance measurement • Principles of effective performance measurement • The difference between benchmarking and performance accountability. • Introduction to Results Based Accountability • Special issues with performance measurement • Special issues in data presentation 28
Benchmarks – what are they good for? Benchmarks are used in at least two ways in government performance measurement 1. Comparisons to minimum standards whether set internally or externally 1. Comparisons to peer organizations 29
Comparison to External Standards
Comparison to Peers (OMBI)
Comparison to Peers (NWWBI) Waterworks Benchmark Results (National Water and Wastewater Benchmarking Initiative)
• Why performance measurement and why now? • The role of finance in performance measurement • Principles of effective performance measurement • The difference between benchmarking and performance accountability. • Introduction to Results Based Accountability • Special issues with performance measurement • Special issues in data presentation 33
Performance Measurement Frameworks Ontario Municipal Benchmarking Iniaitive Harvard Balanced Scorecard Results Based Accountability Service Level Financial Performance How much did you do? Efficiency How well did you do it? Customer Service Satisfaction (customer / stakeholder) Is anyone better off? Community Impact Knowledge and Innovation How much did it cost? (my add on)
How would these metrics sort on the frameworks from the previous slide? 1. 2. 3. 4. 5. Number of mothers seen at Well-baby clinic Violent Crime Rate Number of water main breaks per km of pipe Non-driver error collisions per vehicle-km Children ready for school using Early Development Instrument 6. Cost per open library hour 7. Number of graduates of job training obtaining employment 8. Percentage of people placed in supportive housing remaining in housing for more than one year.
What other related metrics would you need to see to explain these ones? 1. 2. 3. 4. 5. Number of mothers seen at Well-baby clinic Violent Crime Rate Number of water main breaks per km of pipe Non-driver error collisions per vehicle-km Children ready for school using Early Development Instrument 6. Cost per open library hour 7. Number of graduates of job training obtaining employment 8. Percentage of people placed in supportive housing remaining in housing for more than one year.
Introduction to Results Based Accountability™ • Designed for the public sector • Acknowledges the difference between “population” and “performance” accountability • Focus on outcomes – “turning the curve” to improve the lives of children, families and adults in our communities • Recognizes the dependence of public sector agents on community partners • Recognizes the urgency of change while maintaining the rigour of measuring outcomes Results Based Accountability as developed by Mark Friedman in his book Trying Hard is Not Good Enough 37
Population v. Performance Accountability Whole Communities Multiple Stakeholders Complex Factors Agency Performance Client Community More Direct Control
Is it Population or Performance Accountability? 1. 2. 3. 4. 5. Number of mothers seen at Well-baby clinic Violent Crime Rate Number of water main breaks per km of pipe Non-driver error collisions per vehicle-km Children ready for school using Early Development Instrument 6. Cost per open library hour 7. Number of graduates of job training obtaining employment 8. Percentage of people placed in supportive housing remaining in housing for more than one year.
The Seven Population Accountability Questions 1. What are the quality of life conditions that we want for the children, families and adults in our community? 2. What would these conditions look like if we could see them? 3. How can we measure these conditions? 4. How are we doing on the most important of these measures? 5. Who are the partners that have a role to play in doing better? 6. What works to do better, including no-cost and low-cost ideas? 7. What do we propose to do?
The Seven Performance Accountability Questions 1. Who are our customers (consider primary and secondary customers)? 2. How can we measure if our customers are better off? 3. How can we measure if we are delivering services well? 4. How are we doing on the most important of these measures? 5. Who are the partners that have a role to play in doing better? 6. What works to do better, including no-cost and low-cost ideas? 7. What do we propose to do?
Results Based Accountability Framework Effort Quantity Effect The larger an organization’s jurisdiction the more likely that these measures will be “Population” measures How much did you do? Quality How well did you do it? Is anyone better off? How much change / effect did you produce? # What quality of change / effect did you produce? %
Results Based Accountability Framework in Action Effort Quantity How much did you do? # of mothers at well-baby clinic Quality How well did you do it? % of mother returning to clinic more than once Effect Is anyone better off? How much change / effect did you produce? What quality of change / effect did you produce? # of babies who met height / weight milestones % of babies who met height / weight milestones # %
Results Based Accountability Framework in Action Effort Quantity How much did you do? # of violent crime calls to 911 Quality How well did you do it? % of violent crime calls responded within standard response rate Effect Is anyone better off? How much change / effect did you produce? What quality of change / effect did you produce? Change in total number of violent crimes charged % change in violent crimes charged # %
Video on Issues in Community Service Performance Reliability • Mark Friedman on How to Prove Community Impact
Exercise • Using one of the performance measures we have looked at before answer these questions: – Is the measure a population or performance measure? Can it be both? – What other measures would you want to capture to help you decide what to do, or tell the story of the measure? – Using the Population or Performance accountability questions, brainstorm some ideas for what your municipality could do to improve the results of the measure.
Metrics for Exercise on Previous Slide 1. 2. 3. 4. 5. Number of mothers seen at Well-baby clinic Violent Crime Rate Number of water main breaks per km of pipe Non-driver error collisions per vehicle-km Children ready for school using Early Development Instrument 6. Cost per open library hour 7. Number of graduates of job training obtaining employment 8. Percentage of people placed in supportive housing remaining in housing for more than one year.
• Why performance measurement and why now? • The role of finance in performance measurement • Principles of effective performance measurement • The difference between benchmarking and performance accountability. • Introduction to Results Based Accountability • Special issues with performance measurement • Special issues in data presentation 48
Forecasting and Predictability “I don’t make predictions. I never have and I never will. ” Tony Blair Perils of Forecasting Predictability High Forecast Value Low Target Value There shouldn’t be any metrics here 0 5 Low Forecast Value Low Target Value High Forecast Value High Target Value 0 Controllability 5
Exercise Using the metrics we have used before plot them for predictability and controllability and explain why.
Leading, Lagging and Proxy Indicators • • • Leading indicators – Measures of steps in the process to results – Eg: number of days I go to the gym; closure rate on police files Lagging indicators – Measures showing evidence of the result – Eg: # of pounds lost; percent change in crime rate Proxy indicators – Measures that suggest the presence of something else – Eg: BMI is a proxy for good health crime rate is a proxy for feeling safe 51
Leading, Lagging and Proxy Indicators Leading Proxy Lagging
Exercise Using the metrics list identify which ones are leading indicators, lagging indicators and proxies (of what).
• Why performance measurement and why now? • The role of finance in performance measurement • Principles of effective performance measurement • The difference between benchmarking and performance accountability. • Introduction to Results Based Accountability • Special issues with performance measurement • Special issues in data presentation 54
Who is the Audience? • Public – Range of sophistication – Mostly no time to drill into the details • Council – Range of sophistication – Mostly no time to drill into details – Often an agenda for the meaning of the data • Senior Administrators – Higher sophistication – More time to drill into details (and more motivation) – Accountability for results and desire to present favourably
Minneapolis Example of Audience / Message Evaluation Purpose Audience Accountability – Monitor progress on strategic & business plans Resource allocation ($ and people) Community transparency Strategy & policy development Electeds, residents Dept. leaders, electeds, staff Residents Dept. leaders, electeds, staff Tool § Community indicators X (residents) § Business planning § Results Minneapolis § Budget process § Intelligent Operations Platform (IOP) X X X (electeds) X X X (annual, long -term) X X (daily) X
Data Presentation Tips and Tricks 1. Only 3 -4 chunks of information can be stored in working memory and therefore understood at a glance. 2. There are 3 attributes of a typical data presentation (excluding motion) – Form • Length, width, orientation, shape, size, enclosure – Colour • Hue, intensity – Spatial position in 2 dimensions • Right, centre, left, up, down 3. Therefore, using more than three forms for multiple points of data becomes difficult for the audience to quickly understand: eg: colour, name, size, shape, position. Source: Show Me the Numbers 2 nd Ed. Stephen Few, 2012
58
Examples of Data Presentation 59
60
Examples of Data Presentation 61
62
Vancouver Water Dashboard 20 20 get Tar 63
11, 1 14 5, 3 4, 5 3, 6 3, 5 3, 9 3, 0 2, 3 1, 5 1, 9 2 Hispanic White 4, 3 6 4 7, 1 6, 4 Target 5, 6 8, 0 7, 1 7, 9 7, 1 6, 8 5, 9 8 6, 8 10 8, 5 9, 1 12 10, 9 10, 1 13, 3 12, 9 Infant Mortality Rates by Race/Ethnicity (Number of Infant Deaths per 1, 000 Live Births) 0 Minneapolis 2005 -2007 American Indian 2006 -2008 Source: Minnesota Department of Health Asian/Pacific Islander 2007 -2009 2008 -2010 Black 2009 -2011 2014 Target
Conviction Rate on Domestic Violence Cases 100% 90% 80% 70% 60% 58% 48% 61% 66% 72% 70% 72% 2011 2012 64% 70% 54% 40% 30% 20% 10% 0% 2005 Source: CAO 2006 2007 2008 2009 2010 2013 2014 Target
“The Quiet Movement to Make Government Fail Less Often” “None of this work is sexy. Rigorous evaluation, randomized trials and social impact bonds will never stir the political passion that calls for universal health insurance or lower taxes do. If anything, measurement and accountability are destined to provoke more opposition – from interest groups that have something to lose – than support. (This opposition often takes the form of, “Measurement is hard, ” as if that were a reason to skip it. )” http: //www. nytimes. com/2014/07/15/upshot/the-quiet-movement-to-makegovernment-fail-less-often. html? _r=3
Thanks! melinda@munrostrategy. com www. munrostrategy. com Twitter: @munrostrategy Linked In: ca. linkedin. com/in/melindamunro