Why might this map be useful Why might

Why might this map be useful?
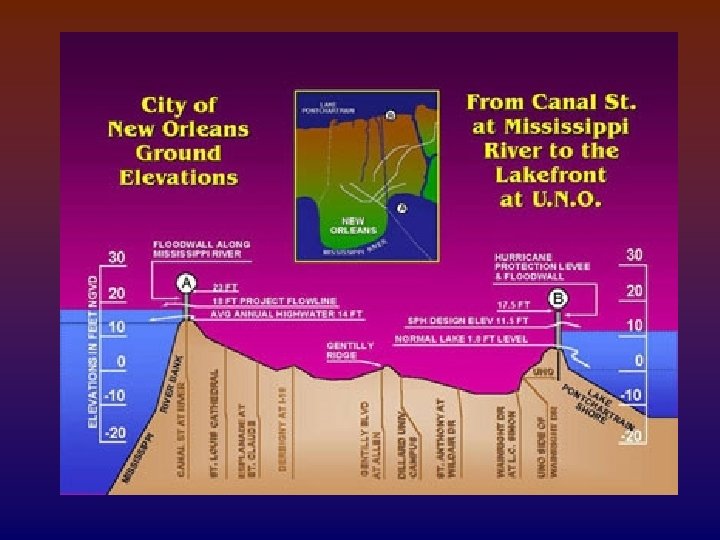

Why might this map be useful?

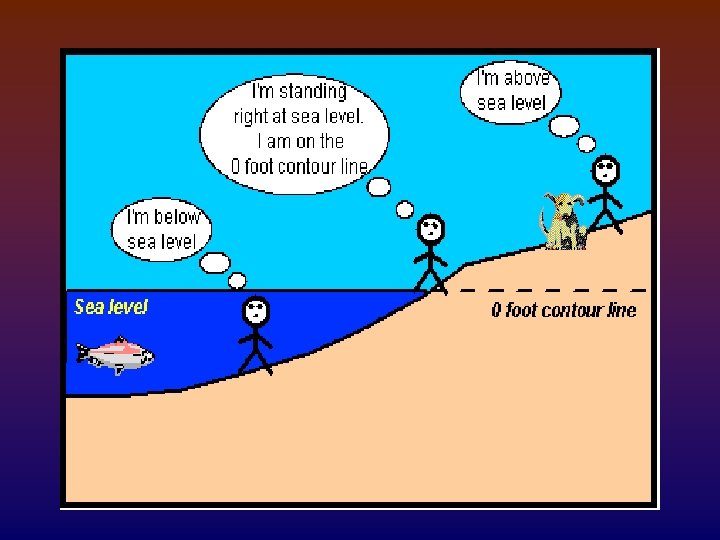
Contour means “shape. ” v Topography is the physical features of the land. Ex: Mountains, Valleys, Cliffs, slope of the land. v Contour maps show the true shape of the land in a 2 -D format. v Contour maps show elevations above sea level and surface features. v

Contour Lines connect points of equal elevation. v Contour interval is the difference in elevation between two adjacent contour lines. v Every fifth contour line is an index contour and is darkened and numbered on the map. v 100 20
? ANSWER: 10 ft")
What is the contour interval (in feet)? ANSWER: 10 ft

Closed loop contours Closed loop contour lines on a map show a hill (peak, mountain, etc. )

Slope of the Land: Widely spaced contours show a gentle slope. Closely spaced contours show a steep slope. Gentle slope Steep slope Which side of the hill has a steep slope? West Which side has a gentle slope? Contour interval 100 ft. East

Depressions- holes- are shown by closed loop contours with hachured marks inside them. Barringer Crater, Arizona

Barringer Crater

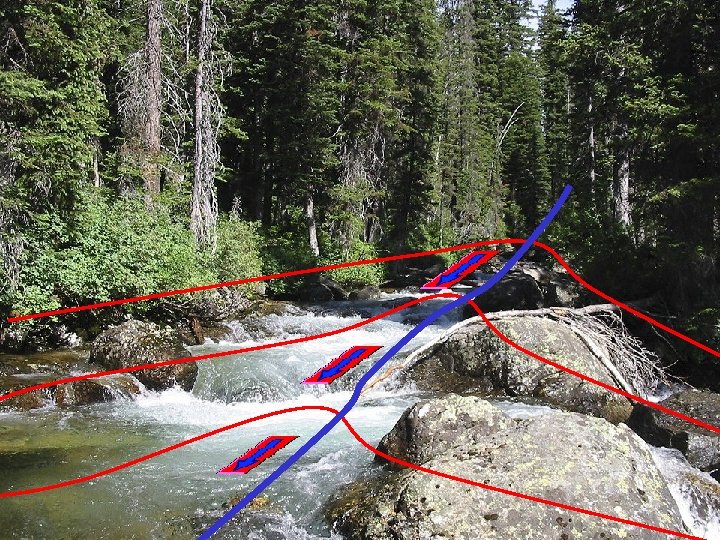
Rivers always flow downstream. v Contour lines bend to form a “V” and point upstream. v Downstream Upstream

Cliffs v Contour lines appear to run together representing a vertical slope.

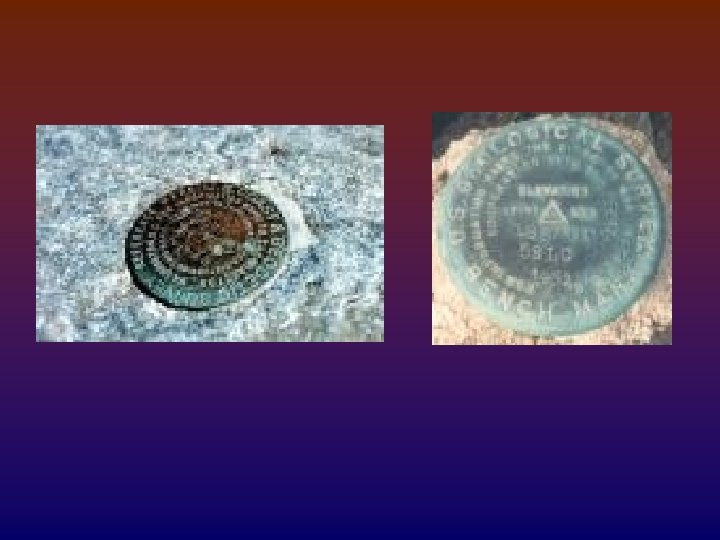
Exact elevation BM X 119 Exact elevation= 119 ft Benchmarks- tells us the exact elevation at a particular location. v Wherever you see this on a map, you will find a metal plate cemented to the ground at that location.

Highest or Maximum Elevation 1. Locate the top of the mountain. 2. Find the contour interval. 3. Add the contour interval to the innermost circle (contour line) 4. Subtract 1 from this number to get the maximum value of the mountain or hill. 120 139 X_____ 100 Highest possible elevation on this 139 ft mountain is: _____

2. Latitude and longitude 3. Map scale ex: 1: 24, 000

Hill in a hole

FEATURES ON A CONTOUR MAP v v v 1. Latitude and Longitude 2. Scale (usually in miles and kilometers) 3. Man made structures (roads, parks, schools, etc) 4. Contour lines (show elevation) 5. Contour Interval 6. Benchmarks (exact elevation is measured) 7. Depressions (elevation drop) 8. Shoreline (elevation of zero) 9. Relief (difference between the highest and lowest points on map) 10. Gradient (closely spaced = steep; widely spaced = gentle) 11. Topographic Series (how much latitude the map covers)

COLORS ON A CONTOUR MAP v Sometimes there is a key for the colors on a specific map, otherwise use the following va. Brown, or reddish brown- contour lines vb. Green, vegetation, parks, etc vc. Blue, some type of water vd. Black man made structures
- Slides: 21