Why graph Variables Linear relationship Determining a gradient

Why graph? Variables Linear relationship Determining a gradient Units Relationships Graph Skills Spikes / outliers y = mx+c Solving a constant Non -Linear relationships (2. 1 investigation) Drawing a LBF Proportionality Data Transformation

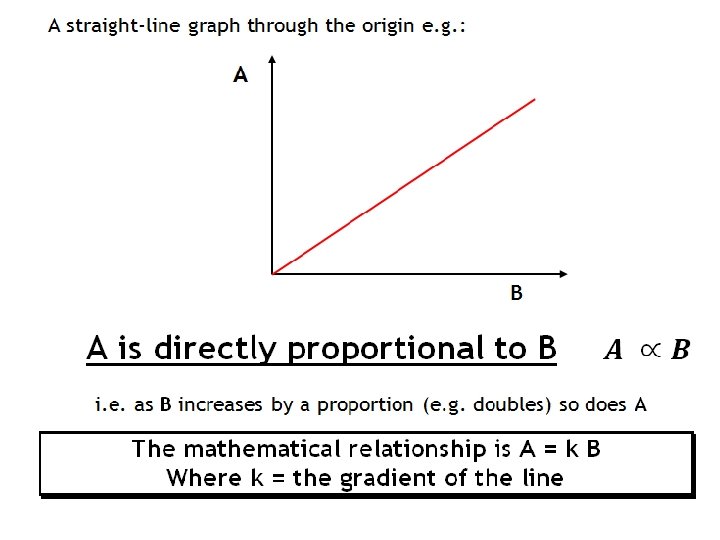
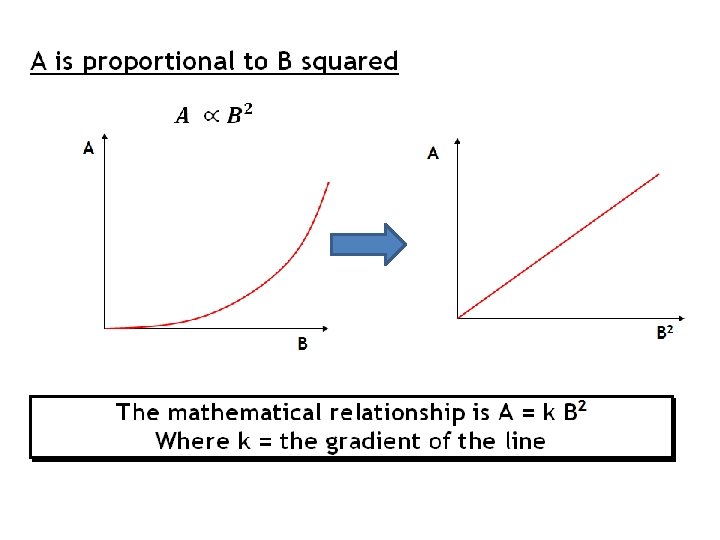
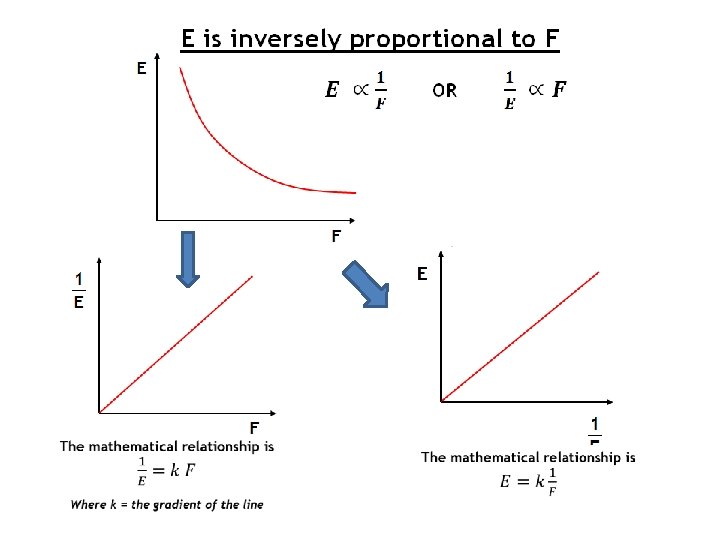
Why graph? • A scientist studies data gathered from an experiment in an attempt to establish a (mathematical) relationship. • Common relationships: Linear (or directly proportional), square, inversely proportional, inverse square, square root. • The clearest and simplest way to see a relationship is to plot a graph.

Who will cool down faster, a penguin on its own, or a penguin in a huddle?

Relationship Variables: o the independent variable - the one you are testing o the dependent variable - the one you are measuring o the controlled variables - all other variables that are kept constant (unchanged) o Why be concerned about control variables?

Why be concerned about control variables?
")
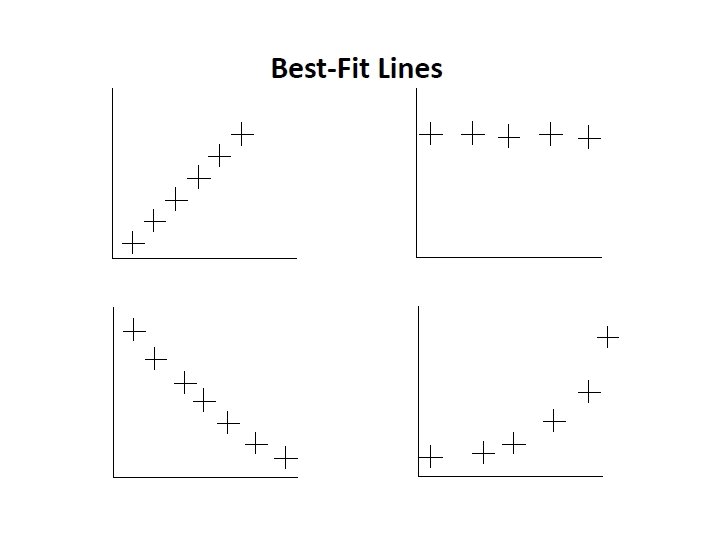
Drawing a LBF Be sure to: Independent variable (usually plotted on the x axis) • the variable that you have control over Dependent variable (usually plotted on the y axis) • this is the quantity that you have to measure and is affected by how you alter the independent variable. • Label the axes and use the units • Sensible scale please • Plot the points • Draw a best fit line • If it looks like it should be a straight line then use a ruler • If it looks like a curve then draw a best fit freehand curve

Determining a gradient Gradient = Rise / Run
 Calculate the gradient of this graph correct unit 45 A 40")
Gradient d (m) Calculate the gradient of this graph correct unit 45 A 40 35 30 correct sig. fig 25 20 15 A M 10 Dt = 7 s 5 0 Dd = 30 m 1 2 3 4 5 6 7 8 9 t (s)

Gradient Units The gradient of the graphs have been worked out for you. Write down the units of the gradient for each graph. d (m) F (N) t (s) = 5 m s-1 x (m) = 0. 75 N m-1
 t 2 (s 2) = 5 m s-2 (s½) = 6 m")
L (m) t 2 (s 2) = 5 m s-2 (s½) = 6 m s-1/2
 Distance (m) 0 0 1 2 2")
Example 1: Distance Time graph: Time (s) Distance (m) 0 0 1 2 2 4 3 6 4 8 5 10 6 12 independent variable: control variables: Aim: determine Velocity of ball

What are the units? Distance time graph 14 12 Distance 10 8 6 4 2 0 0 1 2 3 Time 4 5 6 7
![What are the units? Distance time graph 14 12 Distance [m] 10 8 6](http://slidetodoc.com/presentation_image_h2/c4c2ff92fc8db6067fd9631085149b56/image-14.jpg "What are the units? Distance time graph 14 12 Distance [m] 10 8 6")
What are the units? Distance time graph 14 12 Distance [m] 10 8 6 4 2 0 0 1 2 3 4 Time [s] 5 6 7

Ask yourself what is the relationship? i. e. is y α x? Distance time graph 14 12 Distance [m] 10 8 6 y is proportional to x 4 2 0 0 1 2 3 4 Time [s] 5 6 7
![What is the gradient? Distance time graph 14 12 Distance [m] 10 8 Rise:](http://slidetodoc.com/presentation_image_h2/c4c2ff92fc8db6067fd9631085149b56/image-16.jpg "What is the gradient? Distance time graph 14 12 Distance [m] 10 8 Rise:")
What is the gradient? Distance time graph 14 12 Distance [m] 10 8 Rise: 6 4 Run: 2 0 0 2 4 Time [s] Do not use data points to find your gradient but use ‘easy’ and ‘well spread’ points from your LBF 6 8
![What are the units of the gradient? Distance time graph 14 12 Distance [m]](http://slidetodoc.com/presentation_image_h2/c4c2ff92fc8db6067fd9631085149b56/image-17.jpg "What are the units of the gradient? Distance time graph 14 12 Distance [m]")
What are the units of the gradient? Distance time graph 14 12 Distance [m] 10 8 Rise: 6 4 Run: 2 0 0 1 2 3 4 Time [s] 5 6 7

What is the equation of a straight line? The equation of a straight line is: Y =mx+c Y 10 Math… Nothing new!

What is the Mathematical relationship ? Distance time graph All straight line graphs are of the form y = mx + c 14 12 Distance [m] 10 8 Rise: 6 4 Run: 2 0 0 1 2 3 4 Time [s] 5 6 7
 Velocity (ms-1) 0 0 1 3. 5")
Example 2: Velocity Time graph: Time (s) Velocity (ms-1) 0 0 1 3. 5 2 9 3 11 4 17 5 21 6 26 independent variable: control variables: Aim: determine acceleration of ball

What is the Mathematical relationship ?

C 2 = k D
- Slides: 25