
Why Doesnt Capital Flow from Rich to Poor


- Slides: 45
Why Doesn’t Capital Flow from Rich to Poor Countries? An Empirical Investigation Laura Alfaro Harvard Business School Sebnem Kalemli Ozcan University of Houston, NBER Vadym Volosovych University of Houston
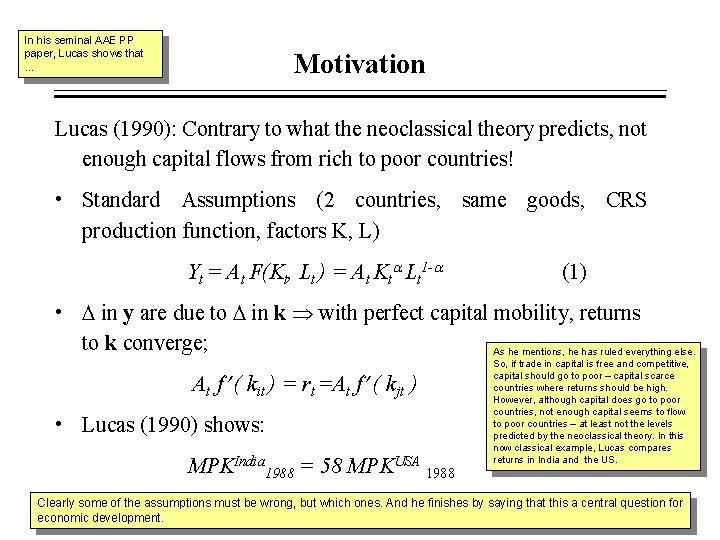
In his seminal AAE PP paper, Lucas shows that … Motivation Lucas (1990): Contrary to what the neoclassical theory predicts, not enough capital flows from rich to poor countries! • Standard Assumptions (2 countries, same goods, CRS production function, factors K, L) Yt = At F(Kt, Lt ) = At Kt Lt 1 - (1) • in y are due to in k with perfect capital mobility, returns to k converge; As he mentions, he has ruled everything else. At f ( kit ) = rt =At f ( kjt ) • Lucas (1990) shows: MPKIndia 1988 = 58 MPKUSA 1988 So, if trade in capital is free and competitive, capital should go to poor – capital scarce countries where returns should be high. However, although capital does go to poor countries, not enough capital seems to flow to poor countries – at least not the levels predicted by the neoclassical theory. In this now classical example, Lucas compares returns in India and the US. (2) Clearly some of the assumptions must be wrong, but which ones. And he finishes by saying that this a central question for economic development.
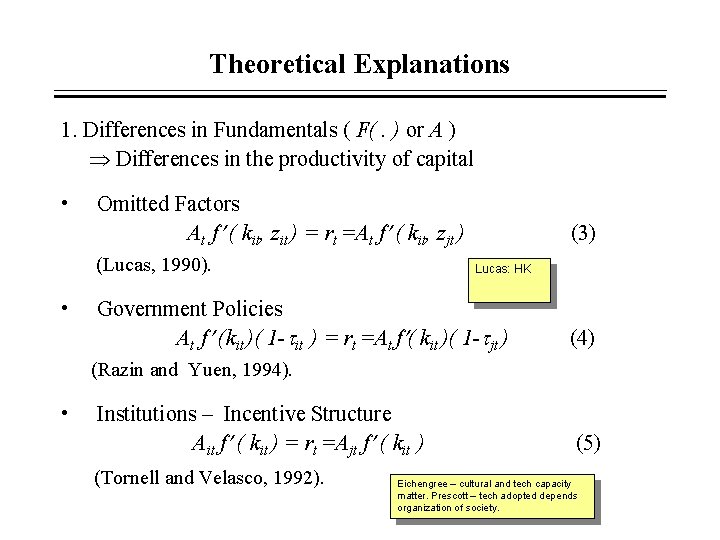
Theoretical Explanations 1. Differences in Fundamentals ( F(. ) or A ) Differences in the productivity of capital • Omitted Factors At f ( kit, zit ) = rt =At f ( kit, zjt ) (Lucas, 1990). • (3) Lucas: HK Government Policies At f (kit )( 1 - it ) = rt =At f ( kit )( 1 - jt ) (4) (Razin and Yuen, 1994). • Institutions – Incentive Structure Ait f ( kit ) = rt =Ajt f ( kit ) (Tornell and Velasco, 1992). (5) Eichengree – cultural and tech capacity matter. Prescott – tech adopted depends organization of society.
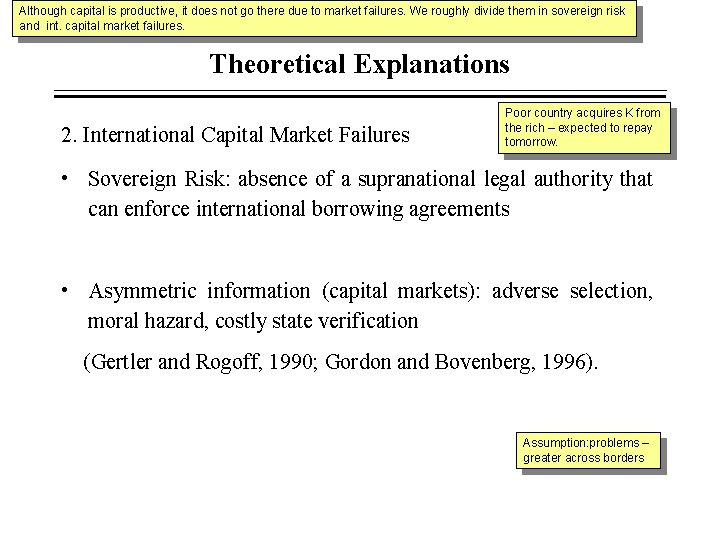
Although capital is productive, it does not go there due to market failures. We roughly divide them in sovereign risk and int. capital market failures. Theoretical Explanations 2. International Capital Market Failures Poor country acquires K from the rich – expected to repay tomorrow. • Sovereign Risk: absence of a supranational legal authority that can enforce international borrowing agreements • Asymmetric information (capital markets): adverse selection, moral hazard, costly state verification (Gertler and Rogoff, 1990; Gordon and Bovenberg, 1996). Assumption: problems – greater across borders
Empirical Literature • Lucas Paradox is related to major puzzles in International Economics: Feldstein-Horioka, Home bias, Risk Sharing - Lack of flows / lack of foreign equity holding. • Focus on determinants of FDI, debt, equity. (Calvo et. al, 1993, 1996; Edwards, 1991; Wei and Wu, 2001; Lane 2000; Portes and Rey, 2000). • Indirect historical evidence on Lucas Paradox (Clemens and Williamson, 2003). … However, empirical literature: indirect, no consensus…
… We still don’t know 1. Which of theoretical explanations for the Lucas Paradox are empirically relevant? • Lucas (1990): Human Capital Externalities if all knowledge spillovers are local * All benefits of the country’s stock of human capital accrue entirely to producers within the country (? ) • Which benefits do really end in the border? (Rules, laws…) Mexico Story; CR Story
… We still don’t know 1. Which of theoretical explanations for the Lucas Paradox are empirically relevant? • Lucas (1990): Human Capital Externalities if all knowledge spillovers are local * All benefits of the country’s stock of human capital accrue entirely to producers within the country (? ) • Which benefits do really end in the border? (Rules, laws…) 2. What role do institutions play for capital flows?
Aim of the Paper ü Investigate the role of different theoretical explanations for the Lucas Paradox in a systematic empirical study. • What role do institutional quality play for capital flows? Results: For the period 1970 -2000, the most important variable in explaining the Lucas Paradox is: Institutional Quality
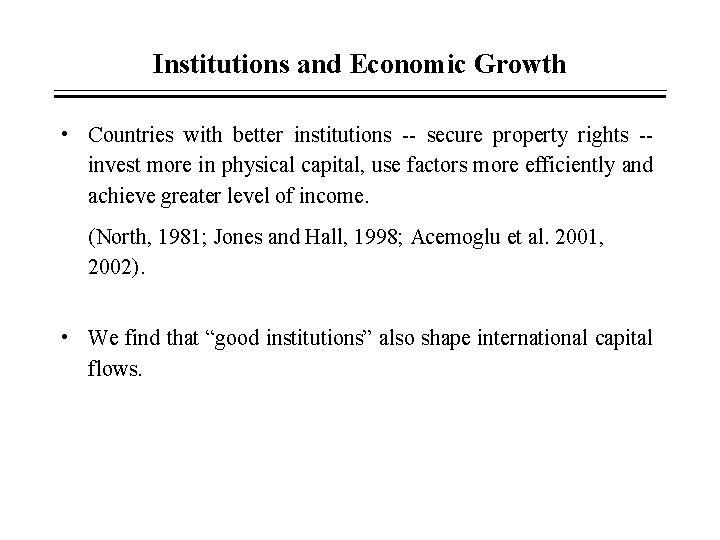
Institutions and Economic Growth • Countries with better institutions -- secure property rights -invest more in physical capital, use factors more efficiently and achieve greater level of income. (North, 1981; Jones and Hall, 1998; Acemoglu et al. 2001, 2002). • We find that “good institutions” also shape international capital flows.
Outline • Introduction and Motivation • Data • Empirical Results – Main Results – Robustness – Endogeneity • Conclusions Many robustness – I won’t have time to go over everything –
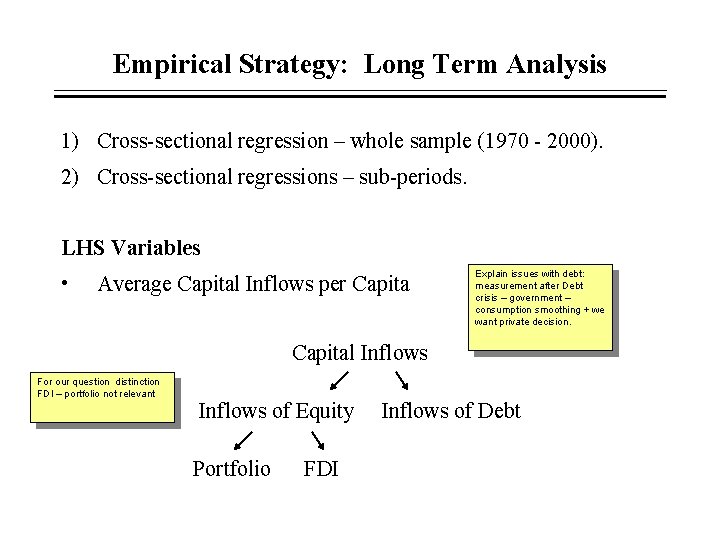
Empirical Strategy: Long Term Analysis 1) Cross-sectional regression – whole sample (1970 - 2000). 2) Cross-sectional regressions – sub-periods. LHS Variables • Average Capital Inflows per Capita Explain issues with debt: measurement after Debt crisis – government – consumption smoothing + we want private decision. Capital Inflows For our question distinction FDI – portfolio not relevant Inflows of Equity Portfolio FDI Inflows of Debt
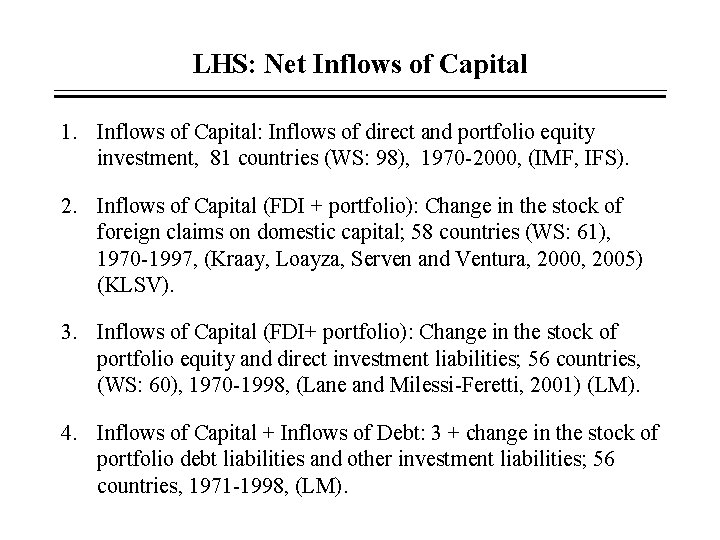
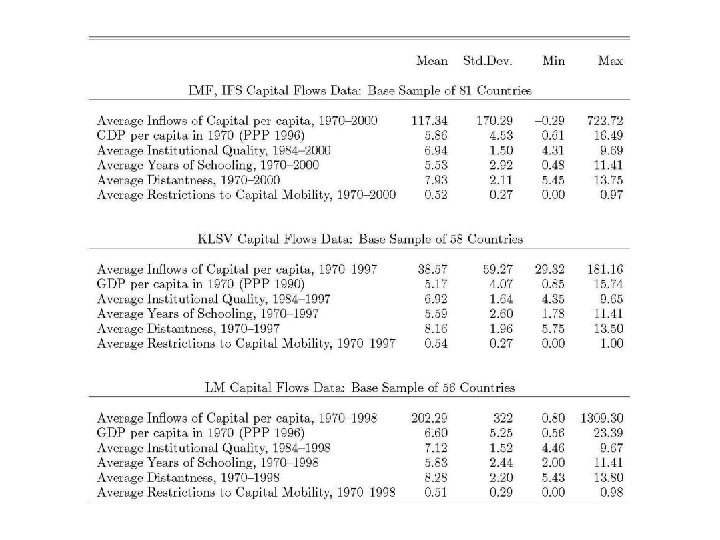
LHS: Net Inflows of Capital 1. Inflows of Capital: Inflows of direct and portfolio equity investment, 81 countries (WS: 98), 1970 -2000, (IMF, IFS). 2. Inflows of Capital (FDI + portfolio): Change in the stock of foreign claims on domestic capital; 58 countries (WS: 61), 1970 -1997, (Kraay, Loayza, Serven and Ventura, 2000, 2005) (KLSV). 3. Inflows of Capital (FDI+ portfolio): Change in the stock of portfolio equity and direct investment liabilities; 56 countries, (WS: 60), 1970 -1998, (Lane and Milessi-Feretti, 2001) (LM). 4. Inflows of Capital + Inflows of Debt: 3 + change in the stock of portfolio debt liabilities and other investment liabilities; 56 countries, 1971 -1998, (LM).
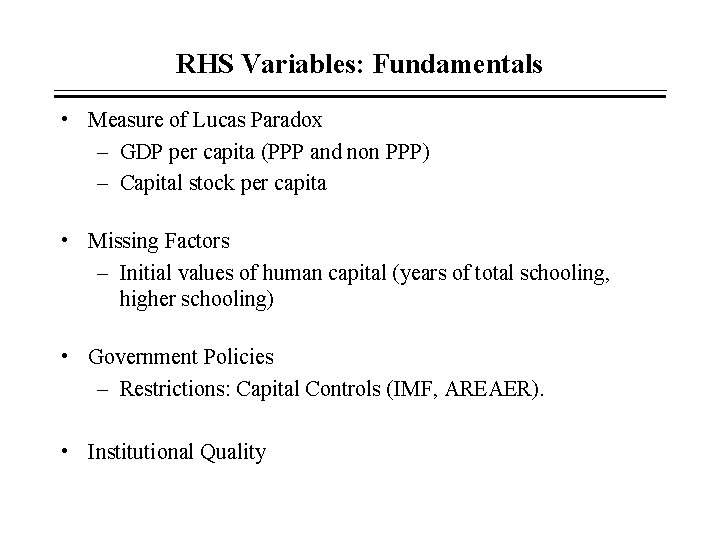
RHS Variables: Fundamentals • Measure of Lucas Paradox – GDP per capita (PPP and non PPP) – Capital stock per capita • Missing Factors – Initial values of human capital (years of total schooling, higher schooling) • Government Policies – Restrictions: Capital Controls (IMF, AREAER). • Institutional Quality
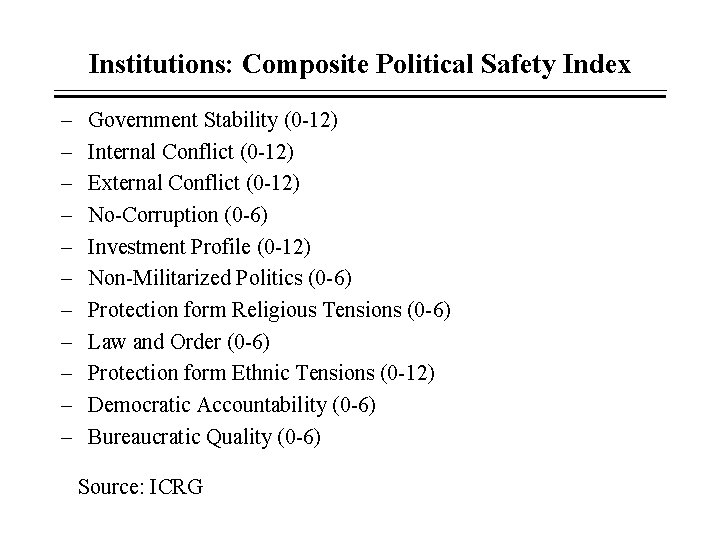
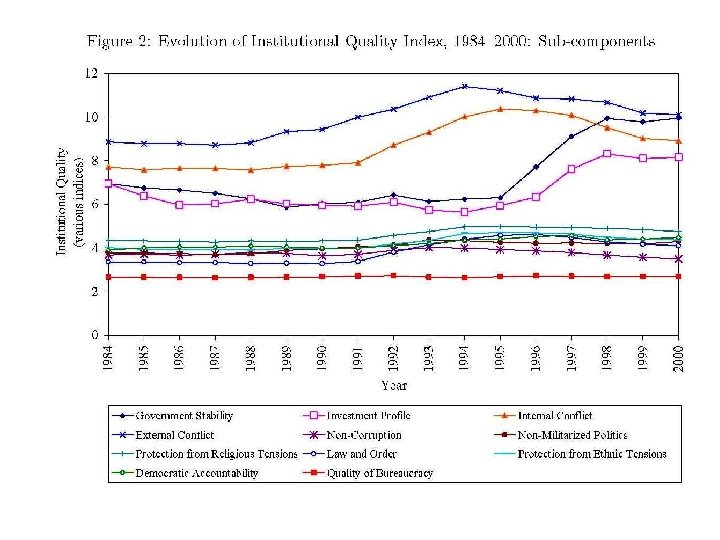
As North (1995) argues, institutions provide the incentive structure of an economy. The work by North (1981) and 2002) argue that institutions - social, legal and political organizations of a society - shape its economic performance. Institutions, most likely, affect economic performance through their effect on investment decisions by protecting the property rights of entrepreneurs against the government and other segments of society and preventing elites from blocking the adoption of new technologies. In general, weak property rights due to poor institutions can lead to lack of productive capacities or uncertainty in returns in an economy. Fundamentals: Institutions • North (1995) defines institutions as the humanly devised constraints that structure political, economic and social interaction; - Informal constraints (traditions, customs) - Formal rules (constitutions, laws, property rights) * Rules of the game Incentive structure of the Economy • How can we measure Institutional Quality? – Composite Political Safety Index (ICRG)
Institutions: Composite Political Safety Index – – – Government Stability (0 -12) Internal Conflict (0 -12) External Conflict (0 -12) No-Corruption (0 -6) Investment Profile (0 -12) Non-Militarized Politics (0 -6) Protection form Religious Tensions (0 -6) Law and Order (0 -6) Protection form Ethnic Tensions (0 -12) Democratic Accountability (0 -6) Bureaucratic Quality (0 -6) Source: ICRG
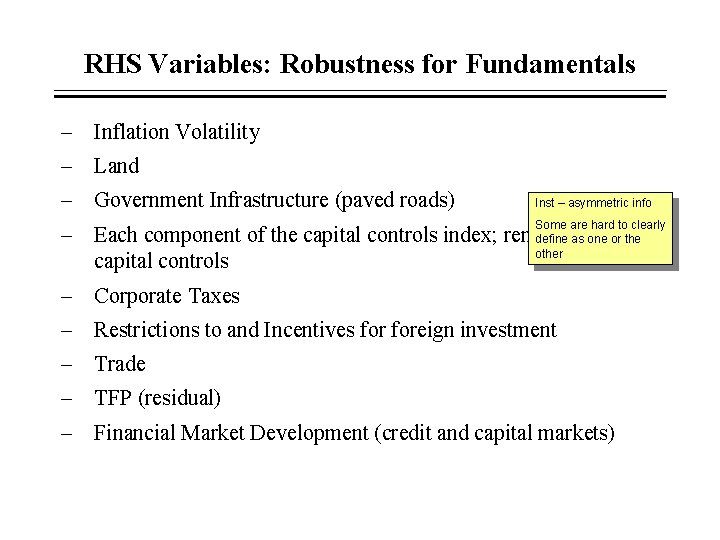
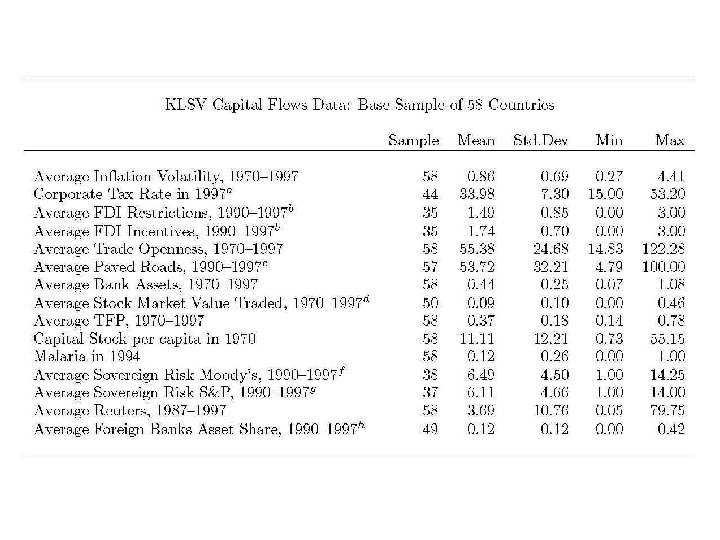
RHS Variables: Robustness for Fundamentals - Inflation Volatility - Land - Government Infrastructure (paved roads) Inst – asymmetric info Some are hard to clearly - Each component of the capital controls index; removal define asof one or the other capital controls - Corporate Taxes - Restrictions to and Incentives foreign investment - Trade - TFP (residual) - Financial Market Development (credit and capital markets)
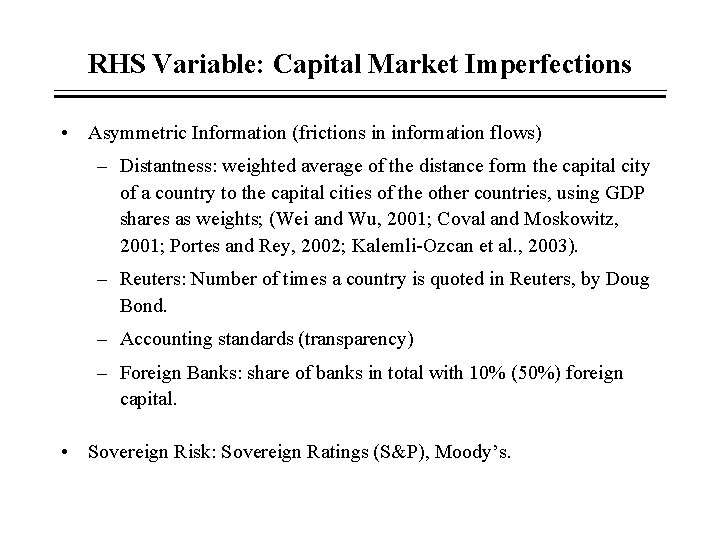
RHS Variable: Capital Market Imperfections • Asymmetric Information (frictions in information flows) – Distantness: weighted average of the distance form the capital city of a country to the capital cities of the other countries, using GDP shares as weights; (Wei and Wu, 2001; Coval and Moskowitz, 2001; Portes and Rey, 2002; Kalemli-Ozcan et al. , 2003). – Reuters: Number of times a country is quoted in Reuters, by Doug Bond. – Accounting standards (transparency) – Foreign Banks: share of banks in total with 10% (50%) foreign capital. • Sovereign Risk: Sovereign Ratings (S&P), Moody’s.
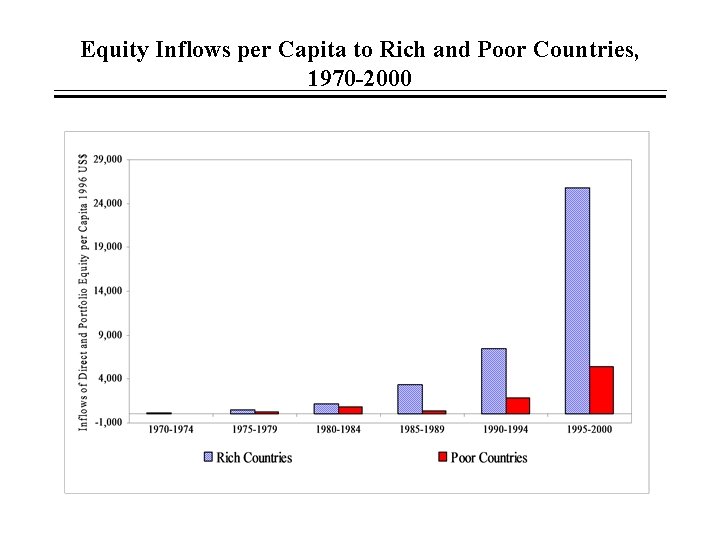
Equity Inflows per Capita to Rich and Poor Countries, 1970 -2000
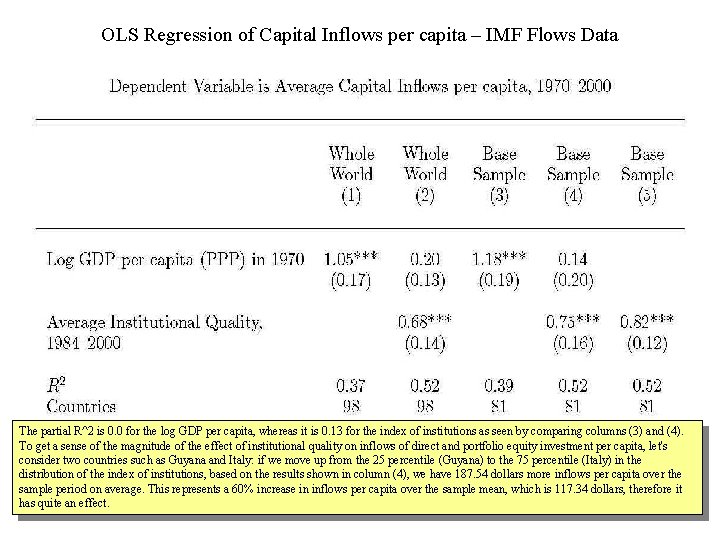
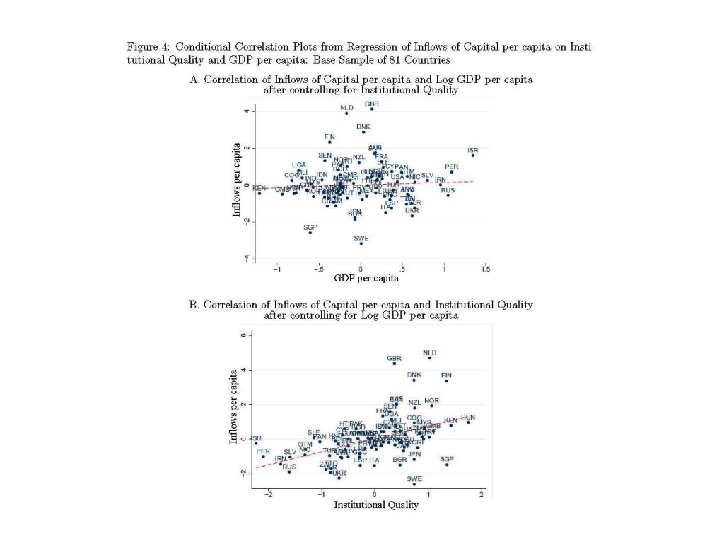
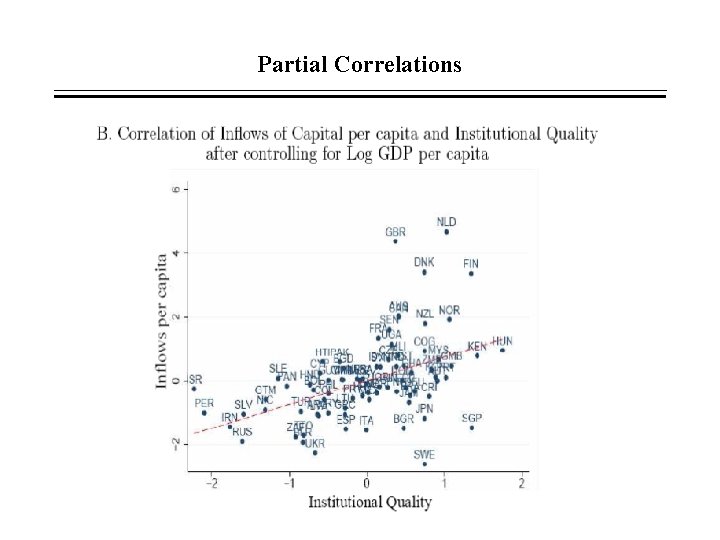
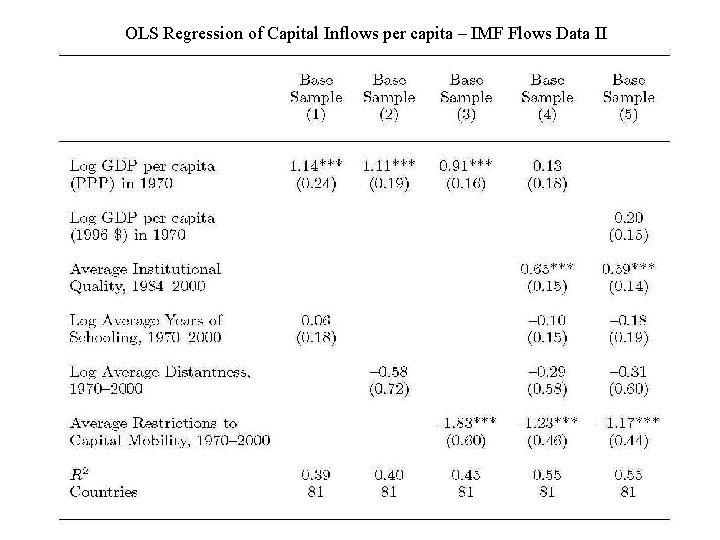
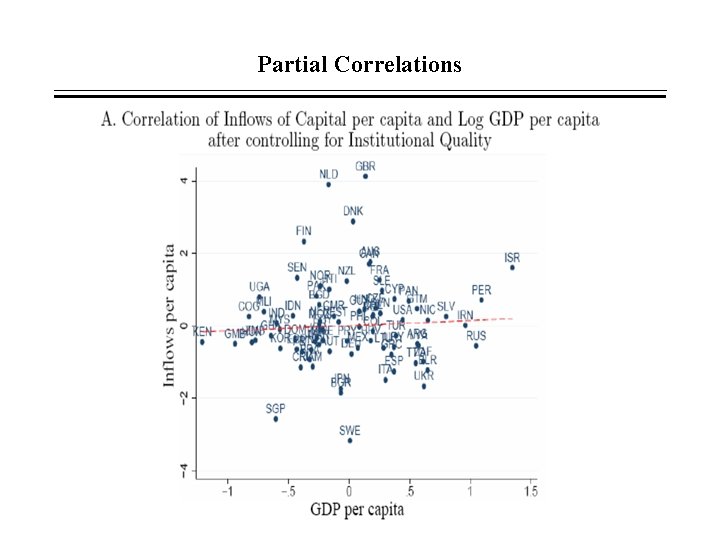
OLS Regression of Capital Inflows per capita – IMF Flows Data The partial R^2 is 0. 0 for the log GDP per capita, whereas it is 0. 13 for the index of institutions as seen by comparing columns (3) and (4). To get a sense of the magnitude of the effect of institutional quality on inflows of direct and portfolio equity investment per capita, let's consider two countries such as Guyana and Italy: if we move up from the 25 percentile (Guyana) to the 75 percentile (Italy) in the distribution of the index of institutions, based on the results shown in column (4), we have 187. 54 dollars more inflows per capita over the sample period on average. This represents a 60% increase in inflows per capita over the sample mean, which is 117. 34 dollars, therefore it has quite an effect.
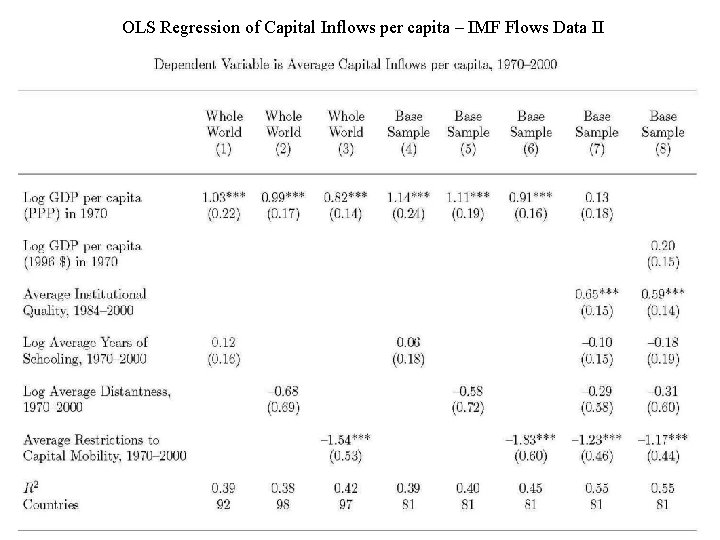
OLS Regression of Capital Inflows per capita – IMF Flows Data II
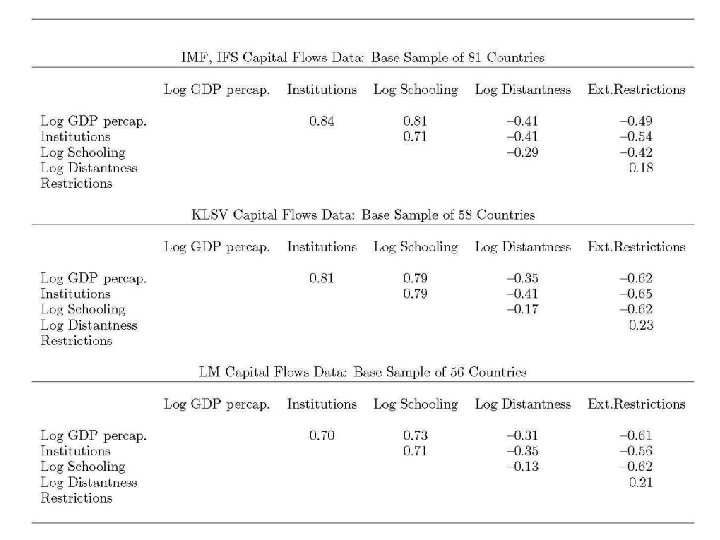
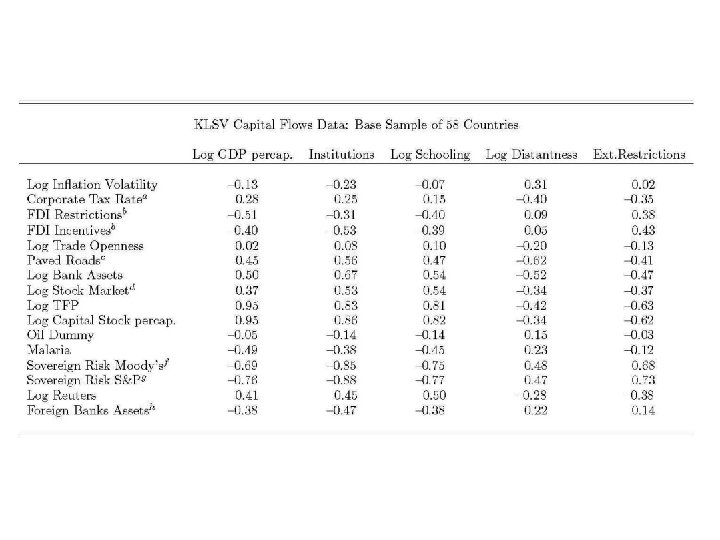
Partial Correlations
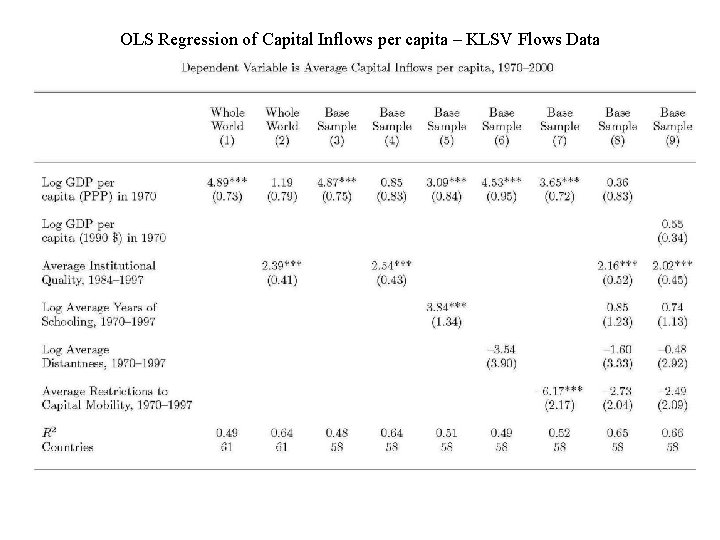
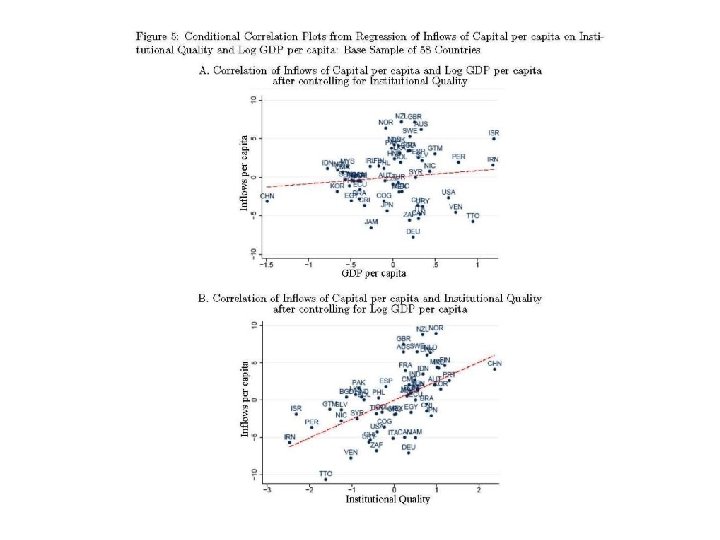
OLS Regression of Capital Inflows per capita – KLSV Flows Data
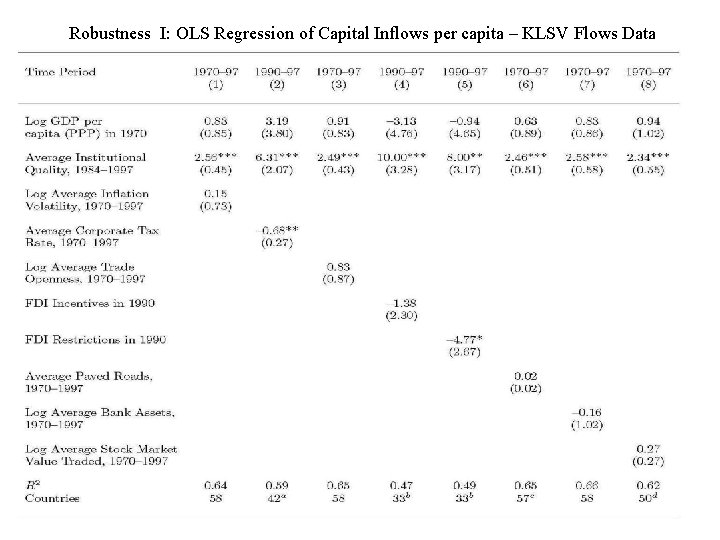
Robustness I: OLS Regression of Capital Inflows per capita – KLSV Flows Data
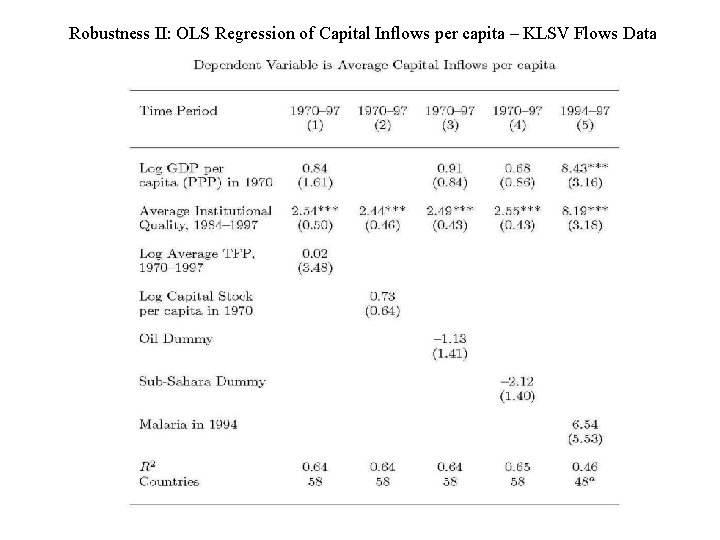
Robustness II: OLS Regression of Capital Inflows per capita – KLSV Flows Data
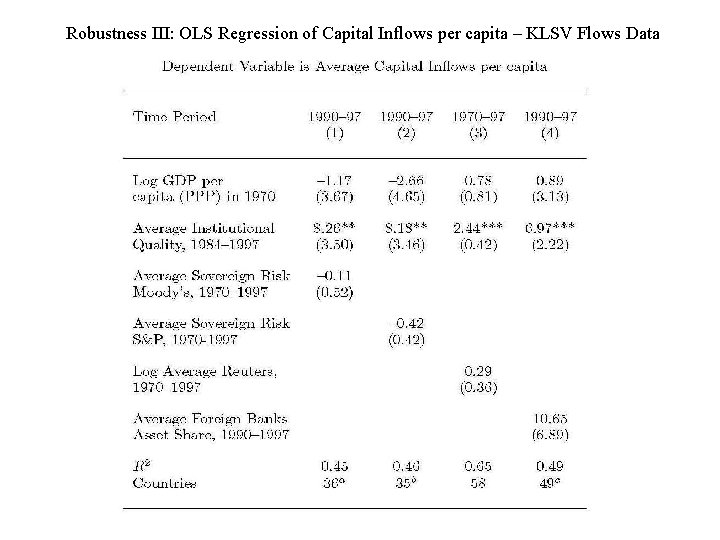
Robustness III: OLS Regression of Capital Inflows per capita – KLSV Flows Data
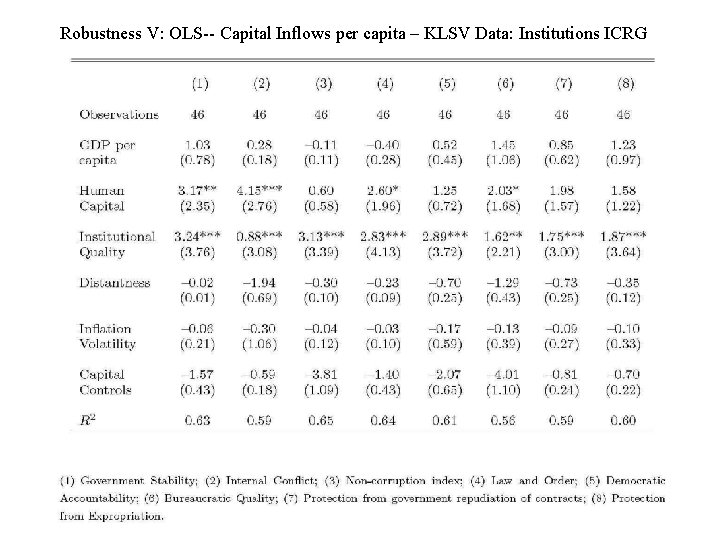
Robustness V: OLS-- Capital Inflows per capita – KLSV Data: Institutions ICRG
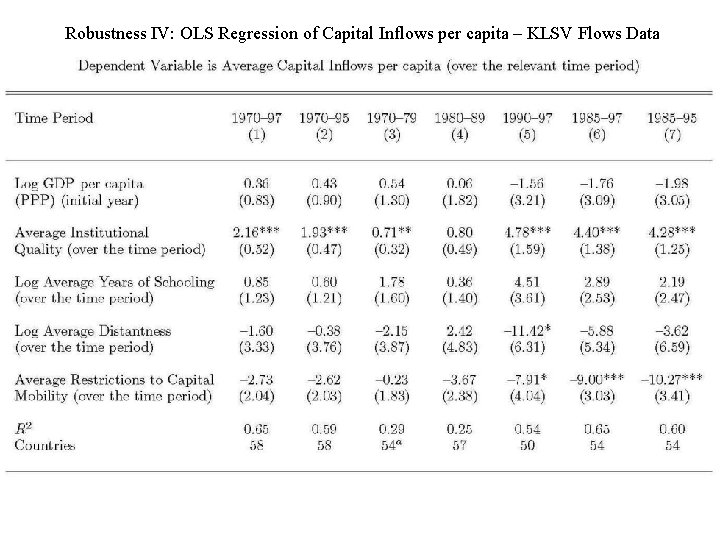
Robustness IV: OLS Regression of Capital Inflows per capita – KLSV Flows Data
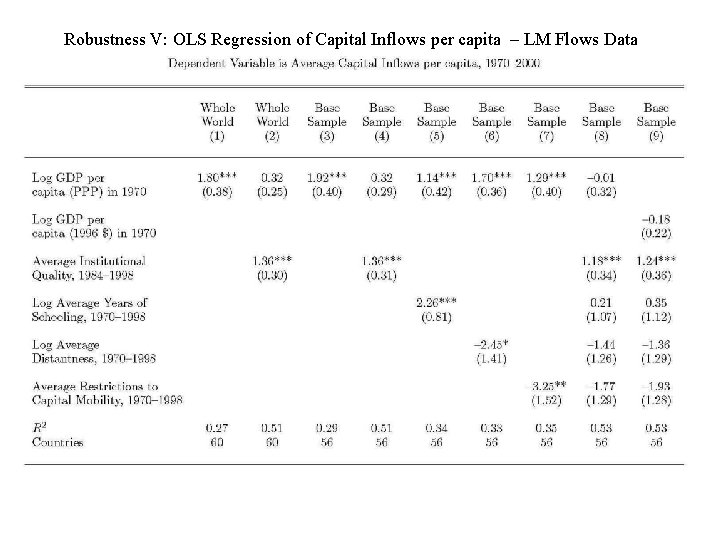
Robustness V: OLS Regression of Capital Inflows per capita – LM Flows Data
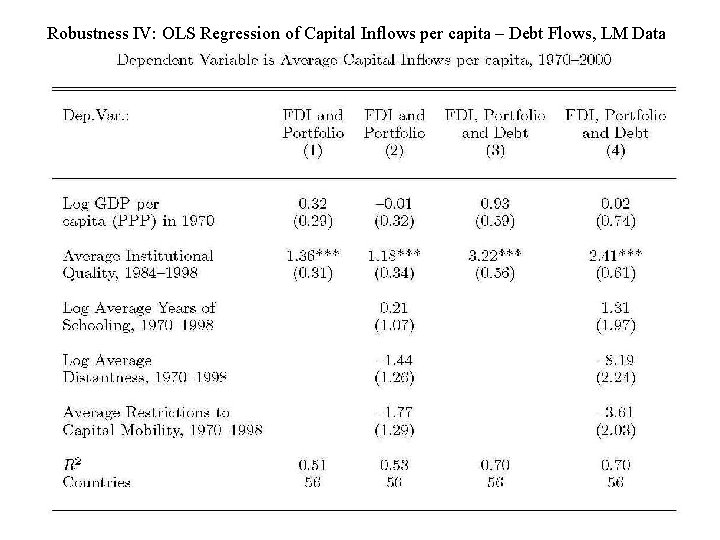
Robustness IV: OLS Regression of Capital Inflows per capita – Debt Flows, LM Data
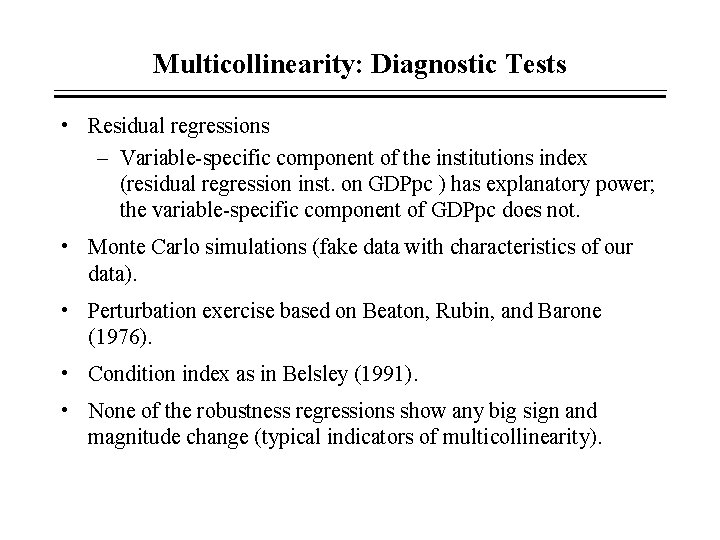
Multicollinearity: Diagnostic Tests • Residual regressions – Variable-specific component of the institutions index (residual regression inst. on GDPpc ) has explanatory power; the variable-specific component of GDPpc does not. • Monte Carlo simulations (fake data with characteristics of our data). • Perturbation exercise based on Beaton, Rubin, and Barone (1976). • Condition index as in Belsley (1991). • None of the robustness regressions show any big sign and magnitude change (typical indicators of multicollinearity).
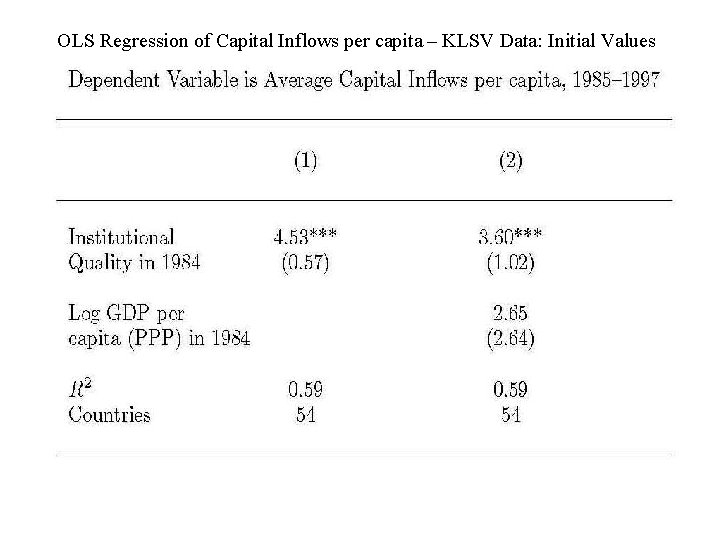
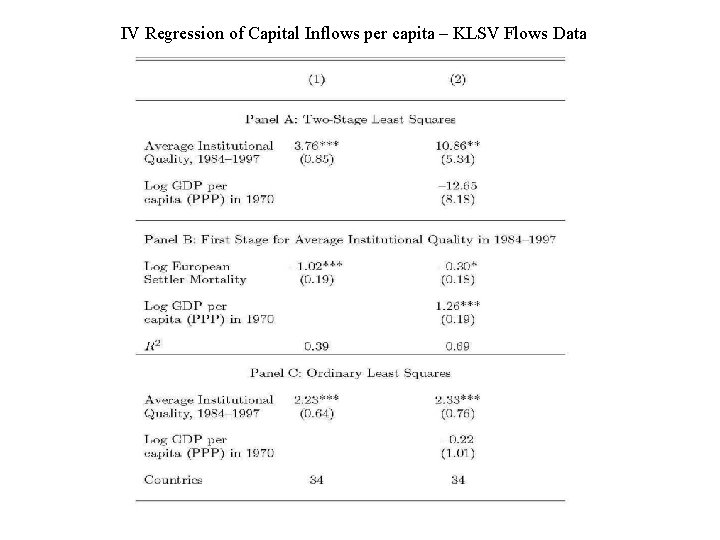
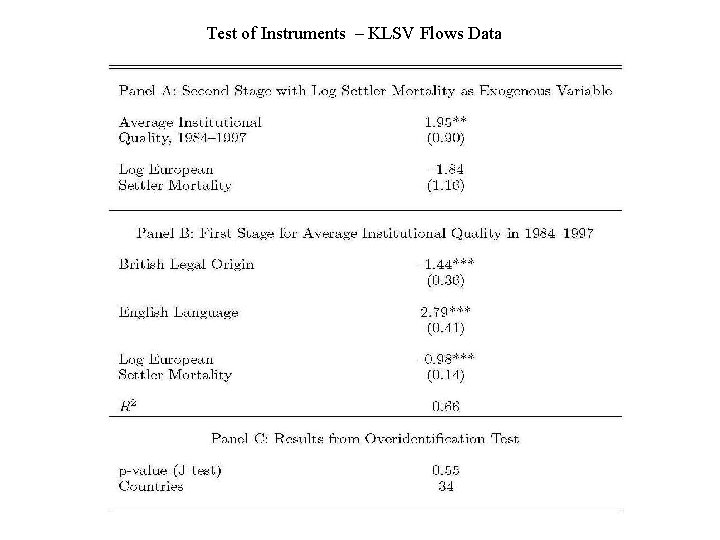
Endogeneity • Capital flows can generate incentives to reform and create investor friendly environments, (Rajan and Zingales, 2003) • Ex-post bias –perceptions Regress Capital inflows (1985 -1997) on pre-sample institutions (1984). Empirical Strategy: IV Estimation (mortality – 34 countries).
OLS Regression of Capital Inflows per capita – KLSV Data: Initial Values
IV Regression of Capital Inflows per capita – KLSV Flows Data
Conclusions • We investigate the role of the different theoretical explanations for the Lucas Paradox in an empirical framework. – Institutional Quality is the most important factor that explains the Lucas Paradox between 1971 -1998. • Our work is silent on: how to get “good” institutions: – Not easy! • Welfare implications and growth effects of capital flows: – Institutions also matter for the effectiveness of capital flows on growth (Alfaro et al. , 2003; Eichengreen, 2003; Klein, 2003) * *Better institutions: attract foreign capital + allow host countries to maximize benefits of such investments.
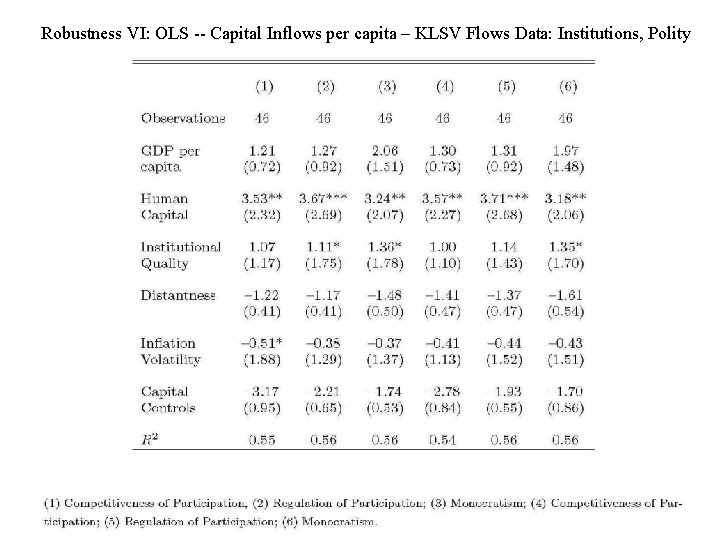
Robustness VI: OLS -- Capital Inflows per capita – KLSV Flows Data: Institutions, Polity
Test of Instruments – KLSV Flows Data
OLS Regression of Capital Inflows per capita – IMF Flows Data II
Partial Correlations