Why Do Interest Rates Change Determinants of Asset


- Slides: 62
Why Do Interest Rates Change?
Determinants of Asset Demand An asset is a piece of property that is a store of value. Assets are Money, bonds, stocks, art, land, houses, farm equipment, machinery, etc. The factors that influence the will to buy and hold asset or to buy one asset rather that another are: Wealth, the total resources owned by individual, including all assets Expected return, the return expected over the next period on one asset relative to alternative assets Risk, the degree of uncertainty associated with the return Liquidity, the ease and speed with which an assets can be turned into cash
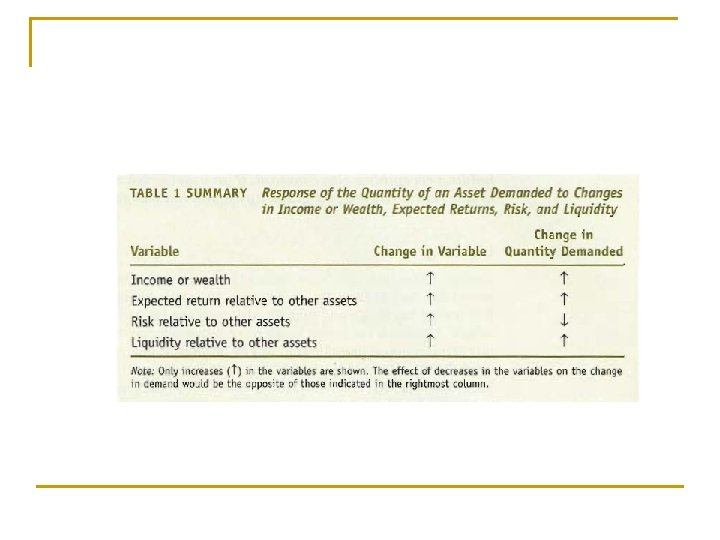
Wealth When we find that out wealth has increased, we have more resources available with which to purchase assets and so The quantity of assets we demand increases The effect of changes in wealth on the quantity demand of assets can be summarized as: Holding everything else constant, an increase in wealth raises the quantity demanded of an asset
Expected return If the expected return on an particular asset rises relative to expected returns an alternative assets, holding everything else constant Then it becomes more desirable to purchase it and the quantity demand increases An increase in an asset’s expected return relative to that of an alternative assets, holding everything else unchanged, raises the quantity demanded of assets
Risk Risk is measured by using standard deviation The higher the standard deviation, the greater the risk of an asset. Holding everything else constant, if an asset’s risk rises relative to that alternative assets, its quantity demanded will fall.
Liquidity It is a factor that describes how quickly can be asset converted into cash at low cost It is liquidity An asset is liquid if the market in which it is traded has depth and breadth That is, if the market has many buyers and sellers. The more liquid an asset is relative to alternative assets, holding everything unchanged, the more desirable it is, and the greater will be the quantity demanded.
Summary 1. The quantity demanded of an asset is usually positively related to wealth, with the response being greater if the asset is a luxury than if it is a necessity 2. The quantity demanded of an asset is positively related to its expected return relative to alternative assets 3. The quantity demanded of an asset is negatively related to the risk of its returns relative to alternative assets 4. The quantity demanded of an asset is positively related to its liquidity relative to alternative assets
Supply and Demand in the Bond Market There is only one type of security A single interest rate A demand curve shows the relationship between the quantity demanded and the price When all other economic variables held constant
Demand Curve The demand for one-year discount bonds, which make no coupon payments but pay the owner the $1. 000 face value in a year If the holding period is one year, then the return on the bonds is know absolutely and it is equal to interest rate:
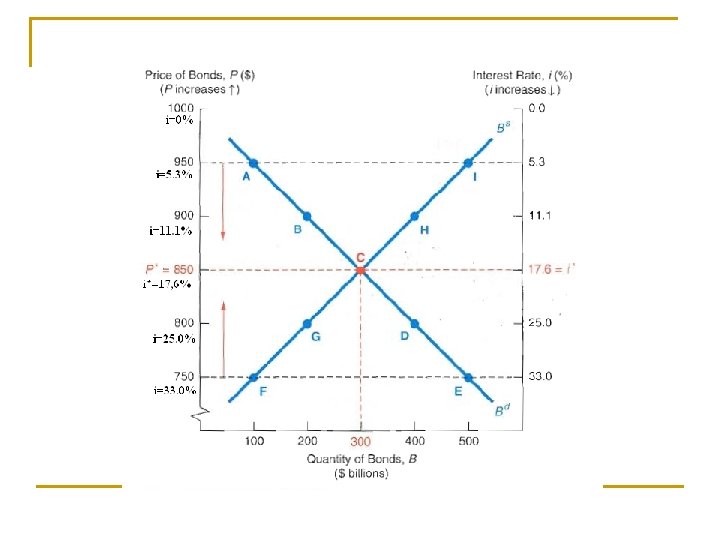
The formula shows that a particular value of the interest rate corresponds to each bond price. If the bond sells for 950$ the interest rates and expected returns are: For the bond price 900$, the interest rate and expected return are:
Because the expected return on these bonds is higher and other economic variables held constant the quantity demanded of bonds will be higher as predicted by theory of asset demand.
Demand Curve C: equilibrium in the bond market P*=850% and i*=17. 6% B: quantity of bonds demanded at the price of 900$ has risen to 200$ If the bond price is 850$ (i=17. 6%), the quantity of bonds demanded (point C) will be greater than at point B. Similarly, at the lower prices of 800$ (i=25%) and 750$(i=33. 3%) the quantity of bonds demanded will be higher (points D and E). The demand curve Connects these points Indicating, that at lower prices of the bond, the quantity demanded is higher
Supply Curve Supply curve shows relations between the quantity supplied and the price When the price of bonds is 750$ (i=33. 3%)point F shows that the quantity of bonds supplied is 100 billion. If the price is 800$ , the interest rate is the lower rate of 25%. Because of this low interest rate it is now less costly to borrow by issuing bonds, and firms will be willing to borrow more through bond issues and the quantity of bonds supplied is at the higher level of 200$ billion (point G)
Market equilibrium The amount that people are willing to buy equals the amount that people are willing to sell at a given price. If the bond price is above the equilibrium price When the price of bond is set too high, the quantity of bond supplied is greater than the quantity of demanded Excess supply People are willing selling more bonds than others are willing to buy If the bond price is below the equilibrium price When the price of bond is set too low, the quantity demanded is greater than the quantity supplied Excess demand People are willing buying more bonds than others are willing to sell
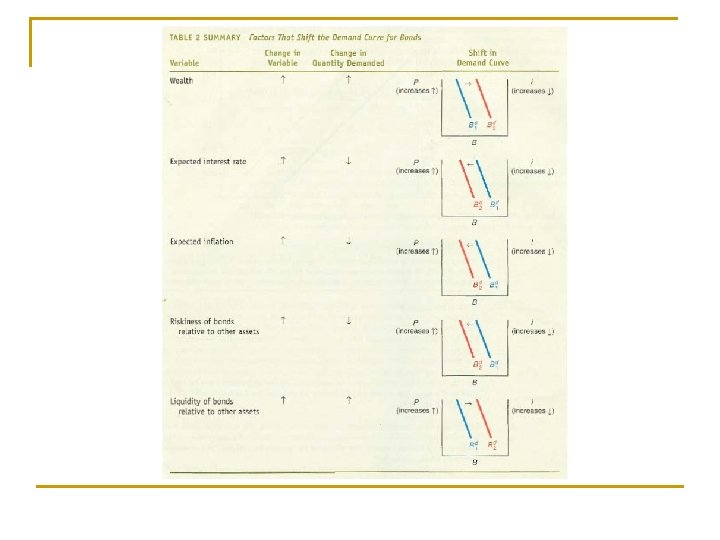
Shifts in Demand for Bonds The factors that cause the demand curve for bonds to shift are Wealth Expected return relative to alternative assets Risk of bonds relative to alternative assets Liquidity of bonds relative to alternative assets
Wealth When the economy is growing rapidly in a business cycle expansion and wealth is increasing, the quantity of bonds demanded at each bond price increases. In a business cycle expansion with growing wealth, the demand for bonds rises and the demand curve for bonds shifts to the right In a recession, when income and wealth are falling, the demand for bonds and the demand curve shifts to the left
Expected return For the bonds with maturities of greater than one year, the expected return may differ from the interest rate If people began to think that interest rates would be higher next year than they had originally anticipate The expected return today on long-term bonds would fall And the quantity demanded would fall at each interest rate Higher interest rates in the future lower the expected return for long-term bonds, decrease the demand shift the demand curve to the left.
By contrast, a revision downward of expectations of future interest rates would mean that long-term bond prices would be expected to rise more than originally anticipated and the resulting higher expected return today would raise the quantity demanded Lower expected interest rates in the future increase the demand for long-term bonds and shift the demand curve to right
Changes in expected returns on other assets can also shift the demand curve for bonds. If people became more optimistic about the stock market and began to expect higher stock prices in the future Expected capital gains Expected returns on stock would rise Expected return on bonds today relative to stocks would fall § Lowering the demand for bonds and shifting the demand curve to the left A change in expected inflation is likely to alter expected return on real assets, which affect the demand for bonds The rise in expected inflation lowering the real interest rate on bonds and the resulting decline in the relative expected return on bonds and the demand for bonds fall.
An increase in the expected rate of inflation lowers the expected return for bonds, causing their demand to decline and the demand curve to shift to the left
Risk If prices in the bond market become more volatile, the risk associated with bonds increases, and bonds become a less attractive asset. Conversely, an increase in the volatility of prices in another asset market, such at the stock market, would make bonds more attractive. An increase in the riskiness of alternative assets causes the demand for bonds to rise and the demand curve to shift to the right
Liquidity If more people started trading in the bond market, and as a result it became easier to sell bond quickly, the increase in their liquidity would cause the quantity of bonds demanded at each interest rate to rise Increased liquidity of bonds results in an increased demand for bonds, and the demand curve shifts to the right. Similarly, increased liquidity of alternative assets lowers the demand for bonds and shifts the demand curve to the left.
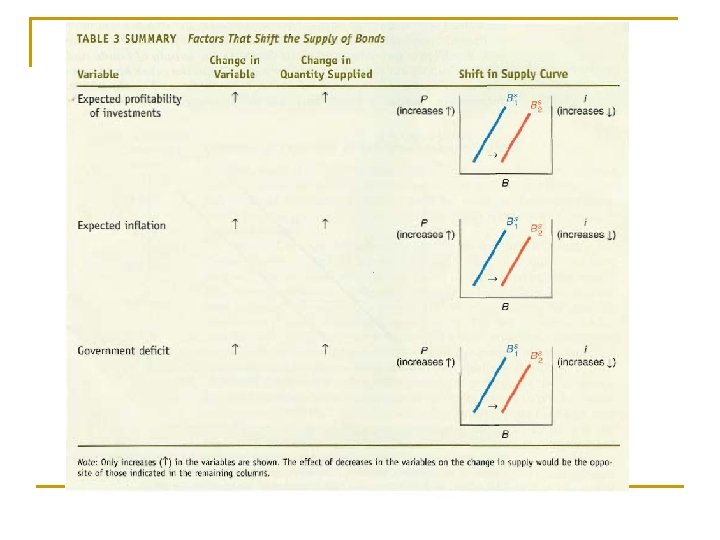
Shifts in the Supply of Bonds Main factors Expected profitability of investment opportunities Expected inflation Government budget
Expected profitability of Investment Opportunities When the economy is growing rapidly, as in a business cycle expansion, investment opportunities that are expected to be profitable abound, and the quantity of bonds supplied at any given bond price will increase. In a business cycle expansion, the supply of bonds increases, and the supply curve shifts to the right In a recession, when there are far fewer expected profitable investment opportunities, the supply of bonds falls, and the supply curve shifts to the left
Expected Inflation For a given interest rate A bond price When expected inflation increase, the real cost of borrowing falls The quantity of bonds supplied increase at any given bond price. An increase in expected inflation causes the supply of bonds to increase and the supply curve to shift to the right
Government Budget Higher government deficits Treasury Bills are bonds issues by government deficits the gap between the government‘s expenditures and its revenues When these deficits are large, there is sold more bonds and the bond supplied at each bond price increase. Higher government deficit increase the supply of bonds and shift the supply curve to the right. On the other hand government surpluses decrease the supply of bonds and shift the supply curve to the left.
Investment instruments and their characteristic Investment instrument Asset that brings a claim for the future revenue. A revenue is in the form of: Dividends Coupon payments Interests Exchange rate profits
Financial instruments Stocks A long term security without maturity day. Types of stocks Primary stocks most widespread and most traded Prior stocks Limited voting rights, priority for dividends In USA two types of prior stocks. Common and cumulative prior stocks. Common prior stocks – dividends only if company gets profit. Cumulative prior stocks – lower dividend payment but commutation of dividend payment claims in years when company get loss. Cumulated claims from bad years are paid out in good years.
Financial instruments Bonds Debtor security with right to redemption of face value and duty of an issuer to settle a claim. Maturity day is fixed. Short-term bonds – several months Long-term bonds – till 30 years Issuer of bonds undertakes to redeem face-value of bond and pay coupon payments in regular intervals. Coupon payment has several forms: Fix interest rate Difference between the face value and the issue price Variable interest rate derivates from different interest rates or revenues, foreign exchange rates, etc.
Financial instruments Types of bonds Straight Coupon Bonds The oldest type o bond. It is also known as a Vanilla Bond. Purchase of this bond investor gets right to fixed coupon payments and face value that is paid in the maturity day. For investor is this type of bond profitable in non-inflation settings and in time of interest rate decrease. For issuer is this type of bond profitable in inflation settings and in time of interest rate increase.
Financial instruments Floating Rate Notes – FRN Bonds with floating coupon payment. The value of coupon payment is very often derived from determine referential value (PRIBOR, LIBOR, BRIBOR, etc. ). Interbank referential rate is only starting point for coupon payment. To this variable level is very often crediting fixed premium (6 M PRIBOR + 0, 1%). Coupon payment imitates with a delay the development of market interest rates. Investor participate in the growth and decline in market interest rate (risk and chance).
Financial instruments In same types of FRN there are strictly defined borders for movements of coupon payments. Floor FRN minimal border for decline of coupon payment. Cap FRN maximal border for growth of coupon payment. Minimax FRN maximal and minimal border Droplock FRN in interest rate decline under determine border FRA is converted into Straight Coupon Bond.
Financial instruments Zero Coupon Bonds without coupon payment. This type of bond is issued with discount it means that issue price is lower than the face value. In the maturity day is paid back the face value. The profit for investor is difference between the issue price and the face value. Index-Linked Bonds The coupon payments are determined by development of some index wages, prices, oil or some market index. With the real indexing Development of index-linked bonds is determined by changes in real asst prices. During growth of inflation the price of most real assets is growing this bonds retain value in high inflation conditions. With financial indexing Development of index-linked bonds is determined by changes in financial instrument prices e. g. stock index.
Financial instruments Convertible bonds This bond links classical bond rights with the right to convert this bond into another Bond or stock of the same issuing company Investor into this convertible bond must decide in particular day if converts bond into another instrument or retains bond till maturity when takes face value and regular coupon payments.
Financial instruments The coupon payments of this bond are lower than in case of standard bonds. In situation when investors assume that stocks of issuing company are underestimate and expected growth in their price.
Financial instruments Subordinated bonds special type of bonds in case of liquidation or bankrupt the claims of owner of subordinated bonds will be satisfied after satisfaction of all other claims. The best know subordinated bonds are follows: Junk Bonds of poor quality Rating in level of speculative (Ba, BB, B) Issued by companies near bankruptcy – Fallen Angels or young, starting companies with high risk profile Junk Bonds High risk but also above-average revenue The value of Junk Bonds reacts to sensitive in economy cycle
Financial instruments Perpetuity Bond Without maturity Coupon payments for unlimited period Issued usually by government
Rating A revenue that is expected from particular bond is derived from level of risk related with particular bond. For appreciation of credit risk is used rating. Credit risk – depends on an issuer and his possibility to settle obligation. Rating offers information how is an particular subject able to fulfill its commitments in time and in full extent.
Rating First rating is related with debenture bonds of railway companies in USA. Made in 1909 by John Moody. In 1914 first rating company Moody’s Investor Service. In 1916 rating company Standard & Poor’s. The development of rating from the 1960’s-70’s in USA and 1970’s – 1980’s in Europe. The first activities was related with rating of debenture bonds and bills of exchange. Nowadays rating companies carry out rating of Bonds, mortgages, derivatives or instruments as a result of securitization. Companies, cities, countries, etc.
List of Ratings
Financial instruments Options are financial instrument which give the holder the right, but not the obligation, to buy (call) or to sell (put) an underlying asset at a predetermined price (exercise price or strike price) on or up to a certain date (European or American exercise style).
Financial instruments Underlying assets The option derives its price from the value of an underlying asset. This can be a stock, index, basket or any other financial asset. A basket is a group of two or more assets, such as shares or indices. Usually baskets have an investment theme, usually a region or a sector (such as shares of banking or telecommunications companies).
Financial instruments European and American style Options can be classified as a European or American style according to holder may use its right to receive payment. European style holder can use its right only in particular predetermined maturity day. American style holder can use its right on any business day till particular predetermined maturity day.
Financial instruments First option exchange was established in 1973 in Chicago. According to embodied right Chicago Board Options Exchange About 60 % of all option trades is in North America About 30 % in Europe and the rest is Asia Call Option – right to buy underlying Put Option – right to sell underlying Premium The price of option
Financial instruments Motions to use options Speculation bear or bull market trend Hedging, especially Interest rate risk Exchange rate risk
Financial instruments Call option A call option is an financial instrument which gives the holder the right, but not the obligation, to buy an underlying asset at a predetermined price (exercise price or strike price) on or up to a specified date (European or American style). A call option gives the holder the possibility to benefit from an increase in the value of the underlying asset, while limiting potential losses to the premium paid.
Financial instruments A put option is a financial instrument which gives the holder the right, but not the obligation, to sell an underlying asset at a predetermined price (exercise price or strike price) on or up to a specified date (European or American style). A put option gives the holder the possibility to benefit from a decrease in the value of the underlying asset, while limiting potential losses to the premium paid.
Financial instruments In case of put or call options there are different expectations between buyer and seller. According to character of trade: Exchange trading options Off-exchange trading options Exchange trading options are traded together with financial futures in derivative exchanges from the 1970's. All options parameters are standardized: Underlying, exercise price, maturity day Off-exchange trading options are designed according to investor requirements, esp. to hedge against risks.
Financial instruments Warrants � A call warrant is a tradable security which gives the holder the right, but not the obligation, to buy an underlying asset at a predetermined price (exercise price or strike price). A put warrant is a tradable security which gives the holder the right, but not the obligation, to sell an underlying asset at a predetermined price (exercise price or strike price).
Financial instruments Warrants are in some characteristics similar to options but there also differences: Warrant is security issued by one issuer Option is not security and it is issued by more persons. Warrants are traded in spot markets, are not under strong standardization and offer several types of underlying. Options are traded in future exchanges, are under strong regulations and types of underlying are limited. Warrants has duration several years Option has duration several mounts Number of issued warrants is fixed determined Number of options is daily changeable. According to right dominates call warrants Number of call and put options are almost similar
Financial instruments Warrants has been traded since 1850's. The interest of investors has increase since the 1980's. Motivations to use warrants Hedging of current low price of financial instrument for future buy. Hedging of current high price of financial instrument for future sell. Speculation for future bull or bear market – leverage effect. Leverage effect Investor profit from warrant investment can rise in some conditions quicker than profit in particular rising underlying. The reason is that investor invest less money in warrant then is direct investment in underlying. But leverage effect works in both ways in decline of underlying the decline in warrant price is higher.
Financial futures Financial futures contract is a standardized contract, traded on a futures exchange, to buy or sell a certain underlying instrument at a certain date in the future, at a specified price. The future date is called the delivery date or final settlement date. The pre-set price is called the futures price. The price of the underlying asset on the delivery date is called the settlement price. A futures contract gives the holder the obligation to buy or sell which differs from an options contract. Financial futures contracts are not issued but it is necessary to meet buyer and sell of contract their contract is according to parameters and conditions similar. This process is called as a matching.
Financial instruments Real assets Financial instruments in physical, material form. Advantages of investment in real assets Hedging again inflation Diversification in portfolio Hedging against political uncertainty Revenues Disadvantages High transactional costs Spread between bid and offer about 20 -25% in financial assets spread about 0, 5 -2 %. Non-existence of liquid and effective market Volatility of revenues in short time period
Financial instruments Precious metals, especially Gold, platinum, palladium and silver The revenues from precious metals are volatile and investment in precious metal is related with higher risk. Investments in gold instruments Nowadays in the world there is about 150 000 tunes of gold, yearly is mined about 1600 -2000 tunes. Investment n gold instruments are in form of Direct investment -goldbrick, ingot Indirect investment - “paper gold” - stocks of mining companies, gold bonds, etc.
Financial instruments Direct investment Centers: London, Zurich, NY, Hong-Kong, etc. Spot or future trades Spot trades Physical buy of goldbrick, ingots with delivery till 2 days Investor can gold takes physically or deposit in bank -> gets certificate about proprietorship. With spot trading of gold are related storage and insurance costs about 2 -3% per year. Standard goldbrick weights 400 troy ounce (12, 44 kg) and it is called bar. For retail investors are created tola bars on Ten tola bars with weight about several grams.
Financial instruments Future trades in form of Gold swaps, gold loans and gold forward sales Traded in OTC markets Main traders: gold producers, central banks and dealers. Gold loans Financing of a gold mining, used since 1982. Before gold mining a mining company borrow gold that sell and money uses for gold mining financing. Mined out gold is used as a payment for loan. Forward sales are used by mining companies to sell gold that will be mined in several years. Main purpose is a hedging against decline in gold price. Forward sales are mediated by banks called bullion banks. This bank borrows (usually from central bank) gold in volume that is expected to be mined and sell then in spot market. Money from transaction are deposited in money market. Several months later mining company returns mined gold together with interest payment to central bank. Mining company gets back financial resources from activity in money market together with interest payments minus interest payments paid central bank and provision for bullion bank.
Financial instruments Investing in stocks of gold mining companies The value of gold mining companies is determined by development of price of gold. Movements of these stocks are determined by leverage effect it means that 1% change in price of gold effect several percentage change in price of gold mining companies stocks. Beside price of gold these stocks are determined by Mining costs, political and economical situation in the country, labour costs, etc. Gold bonds Index bonds that development is related with the development of price of gold.
Financial instruments Diamonds The most of diamond supply is under control of South African company De. Beers Consolidate Mines Limited that keep 1/3 of all diamond mine. Control about 75 % of world trade with not-cutted diamonds. Real Estates Arts