
Whole Washington Better healthcare for less Gerald Friedman
Whole Washington Better healthcare for less Gerald Friedman Professor of Economics University of Massachusetts at Amherst March 2, 2018 Follow me at @gfriedma@econs. umass. edu
Where we are going • America’s health care: too expensive for too little • How we got into this mess: the market turn in health policy • A better way: Whole Washington • How we will win: people power over money power
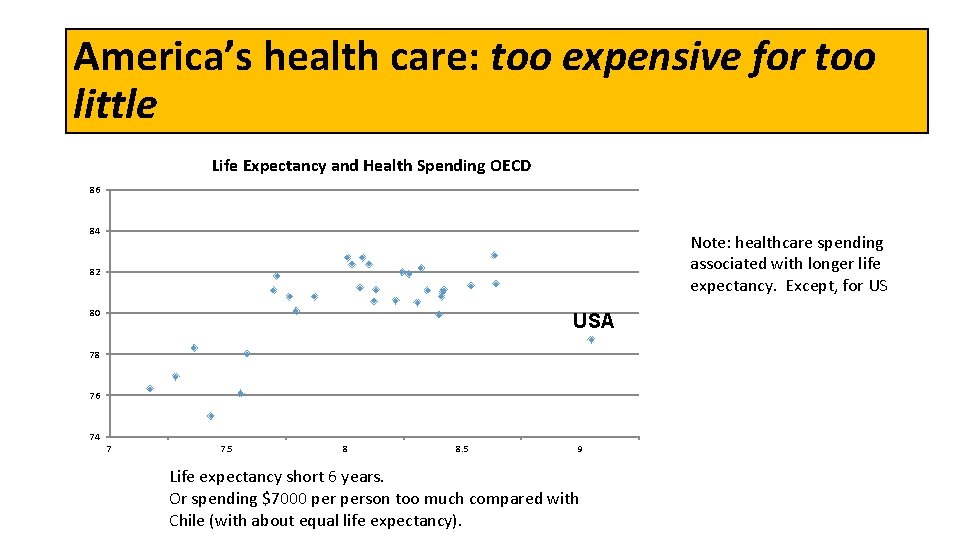
America’s health care: too expensive for too little Life Expectancy and Health Spending OECD 86 84 Note: healthcare spending associated with longer life expectancy. Except, for US 82 80 USA 78 76 74 7 7. 5 8 8. 5 9 Life expectancy short 6 years. Or spending $7000 person too much compared with Chile (with about equal life expectancy).
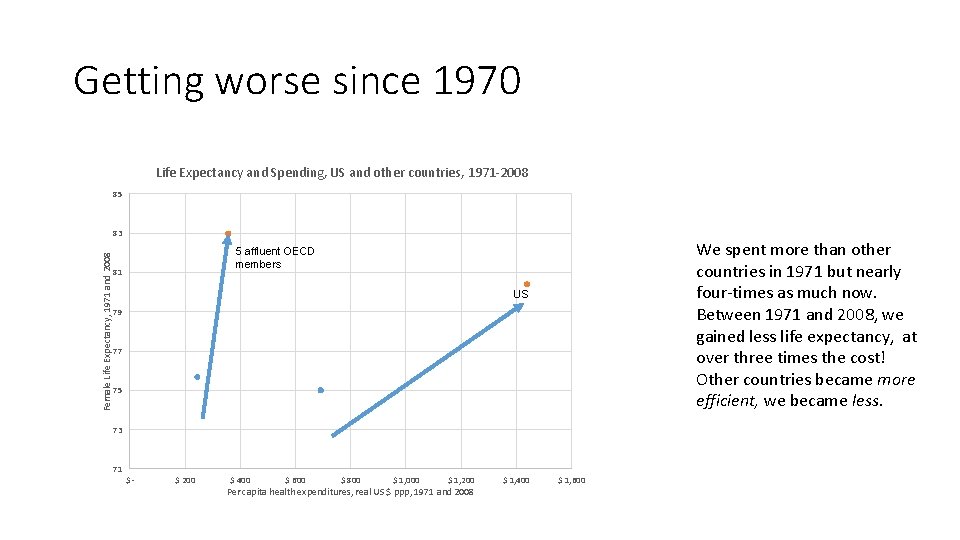
Getting worse since 1970 Life Expectancy and Spending, US and other countries, 1971 -2008 85 83 We spent more than other countries in 1971 but nearly four-times as much now. Between 1971 and 2008, we gained less life expectancy, at over three times the cost! Other countries became more efficient, we became less. Female Life Expectancy, 1971 and 2008 5 affluent OECD members 81 US 79 77 75 73 71 $- $ 200 $ 400 $ 600 $ 800 $ 1, 000 $ 1, 200 Per capita health expenditures, real US $ ppp, 1971 and 2008 $ 1, 400 $ 1, 600
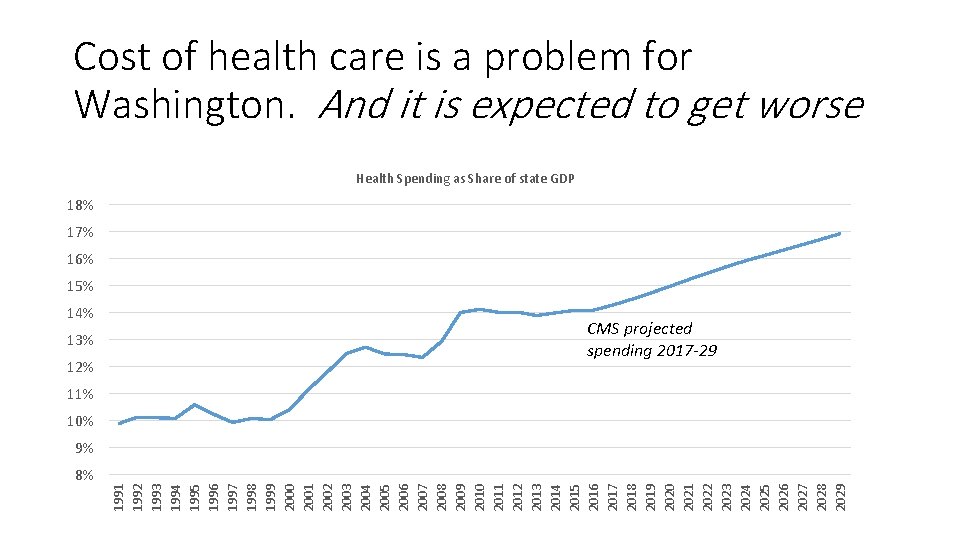
Cost of health care is a problem for Washington. And it is expected to get worse Health Spending as Share of state GDP 18% 17% 16% 15% 14% 13% 12% CMS projected spending 2017 -29 11% 10% 8% 1991 1992 1993 1994 1995 1996 1997 1998 1999 2000 2001 2002 2003 2004 2005 2006 2007 2008 2009 2010 2011 2012 2013 2014 2015 2016 2017 2018 2019 2020 2021 2022 2023 2024 2025 2026 2027 2028 2029 9%
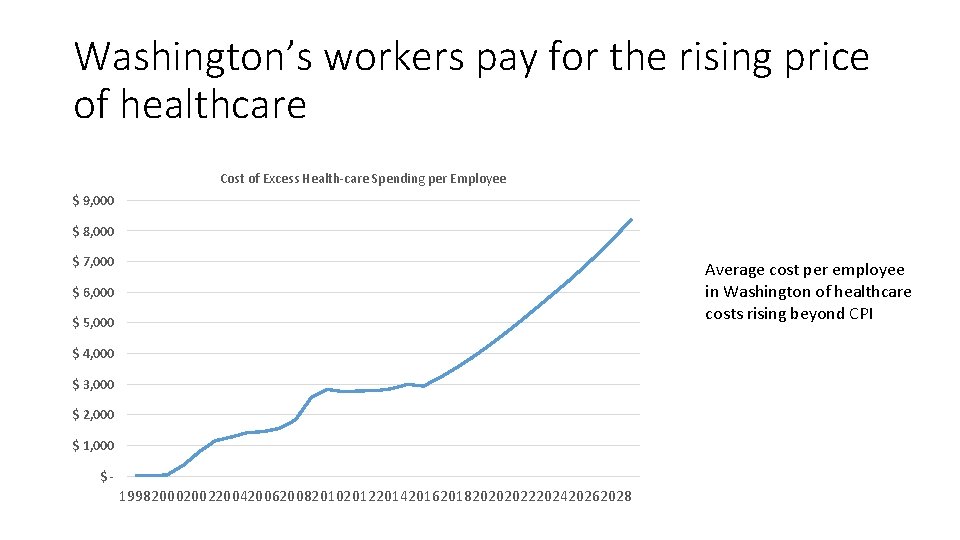
Washington’s workers pay for the rising price of healthcare Cost of Excess Health-care Spending per Employee $ 9, 000 $ 8, 000 $ 7, 000 Average cost per employee in Washington of healthcare costs rising beyond CPI $ 6, 000 $ 5, 000 $ 4, 000 $ 3, 000 $ 2, 000 $ 1, 000 $- 1998200020022004200620082010201220142016201820202022202420262028
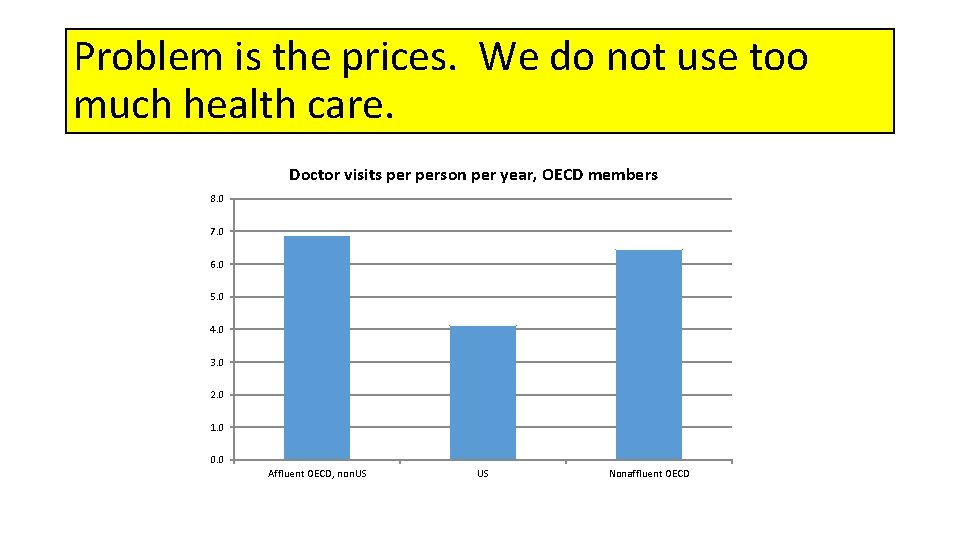
Problem is the prices. We do not use too much health care. Doctor visits person per year, OECD members 8. 0 7. 0 6. 0 5. 0 4. 0 3. 0 2. 0 1. 0 0. 0 Affluent OECD, non. US US Nonaffluent OECD
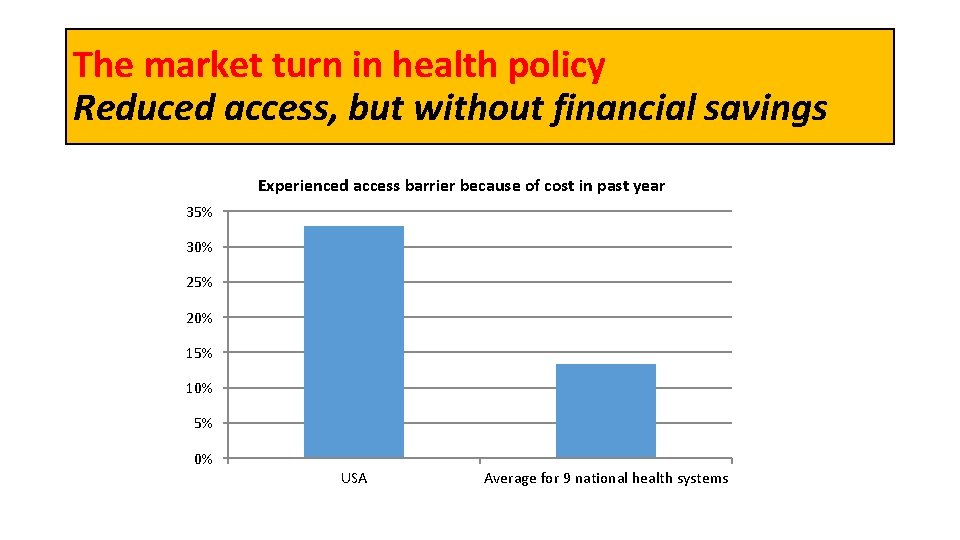
The market turn in health policy Reduced access, but without financial savings Experienced access barrier because of cost in past year 35% 30% 25% 20% 15% 10% 5% 0% USA Average for 9 national health systems
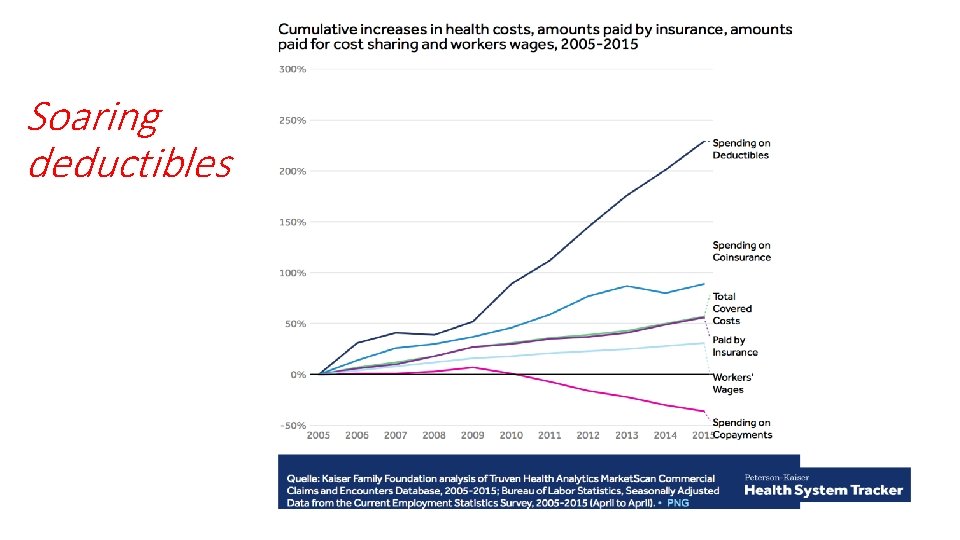
Soaring deductibles
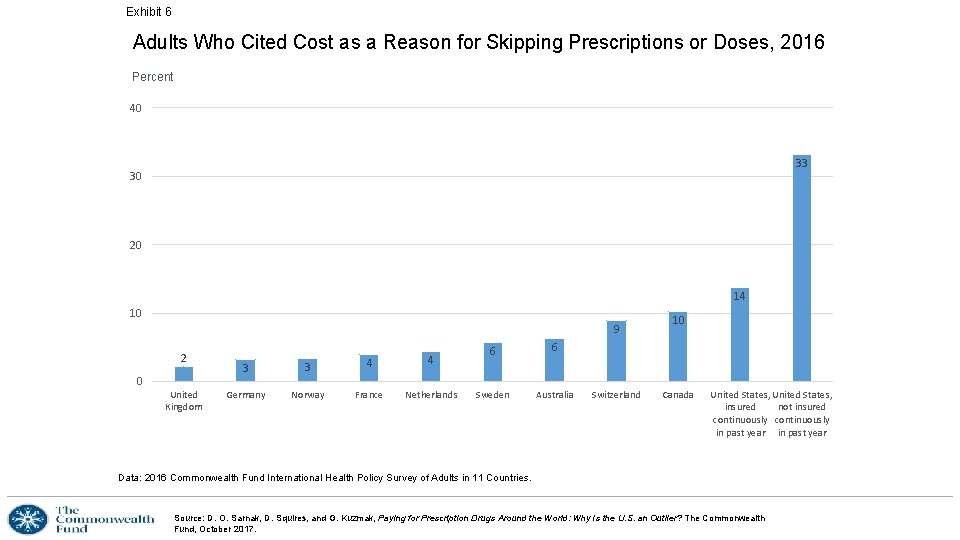
Exhibit 6 Adults Who Cited Cost as a Reason for Skipping Prescriptions or Doses, 2016 Percent 40 33 30 20 14 10 9 2 0 United Kingdom 3 3 4 4 Germany Norway France Netherlands 6 6 Sweden Australia Switzerland 10 Canada United States, insured not insured continuously in past year Data: 2016 Commonwealth Fund International Health Policy Survey of Adults in 11 Countries. Source: D. O. Sarnak, D. Squires, and G. Kuzmak, Paying for Prescription Drugs Around the World: Why Is the U. S. an Outlier? The Commonwealth Fund, October 2017.
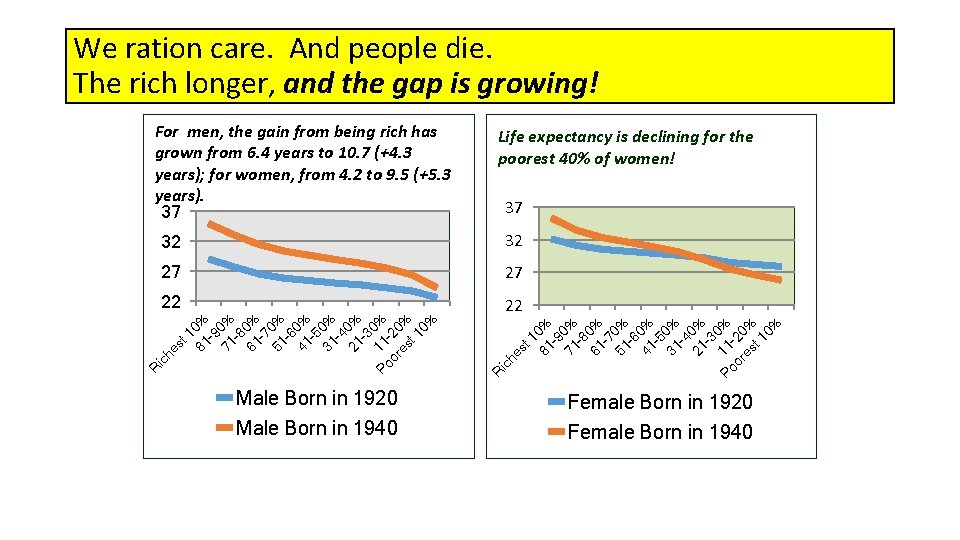
We ration care. And people die. The rich longer, and the gap is growing! For men, the gain from being rich has grown from 6. 4 years to 10. 7 (+4. 3 years); for women, from 4. 2 to 9. 5 (+5. 3 years). 37 Life expectancy is declining for the poorest 40% of women! 37 27 27 22 22 R ic h es t ic h R 1 81 0% -9 71 0% -8 61 0% -7 51 0% -6 41 0% -5 31 0% -4 21 0% -3 0 1 Po 1 % or -20 es % t 1 0% 32 Male Born in 1920 Female Born in 1920 Male Born in 1940 Female Born in 1940
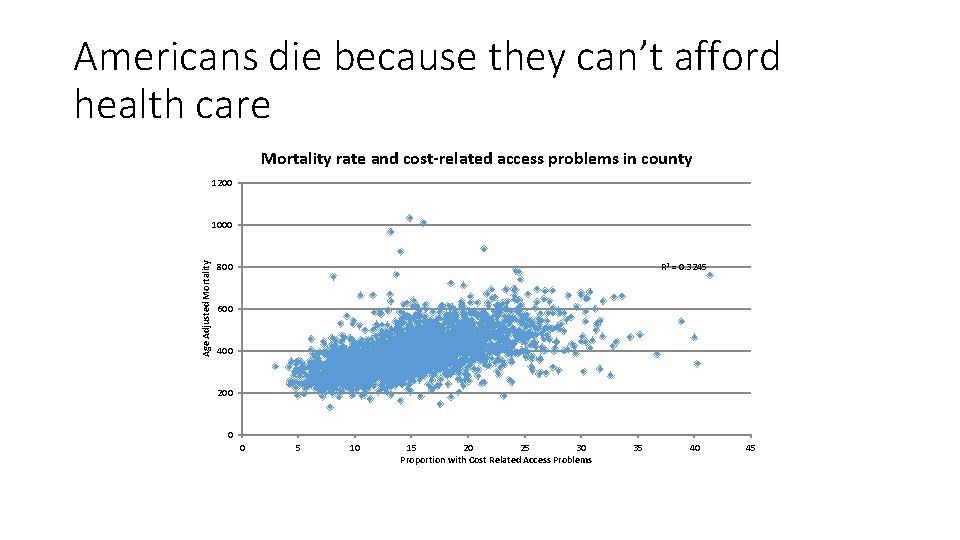
Americans die because they can’t afford health care Mortality rate and cost-related access problems in county 1200 Age Adjusted Mortality 1000 800 R 2 = 0. 3245 600 400 200 0 0 5 10 15 20 25 30 Proportion with Cost Related Access Problems 35 40 45
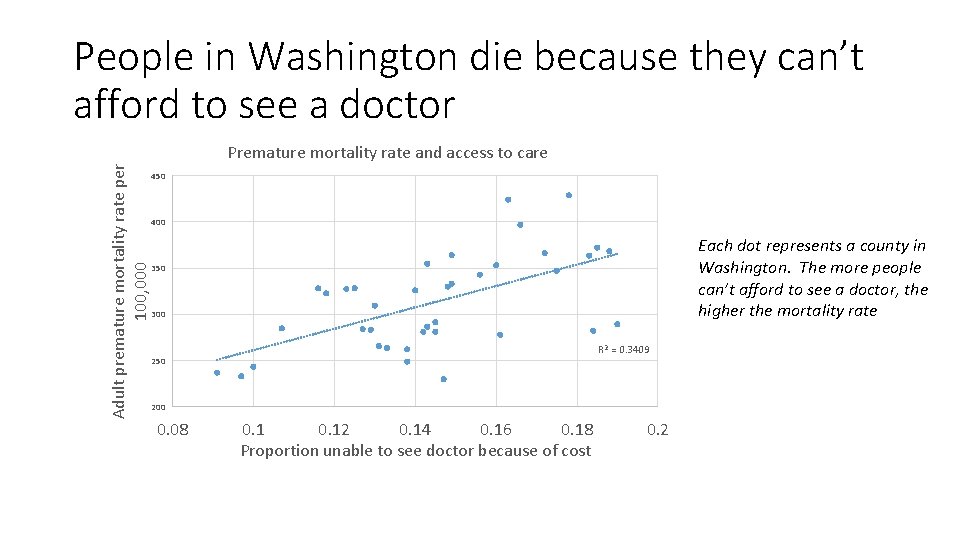
People in Washington die because they can’t afford to see a doctor Adult premature mortality rate per 100, 000 Premature mortality rate and access to care 450 400 Each dot represents a county in Washington. The more people can’t afford to see a doctor, the higher the mortality rate 350 300 R 2 = 0. 3409 250 200 0. 08 0. 12 0. 14 0. 16 0. 18 Proportion unable to see doctor because of cost 0. 2
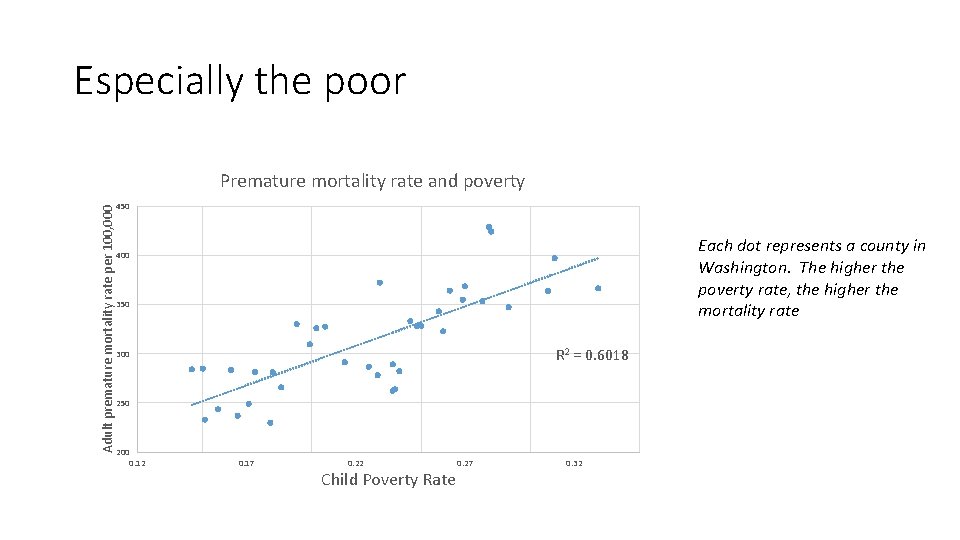
Especially the poor Adult premature mortality rate per 100, 000 Premature mortality rate and poverty 450 Each dot represents a county in Washington. The higher the poverty rate, the higher the mortality rate 400 350 R 2 = 0. 6018 300 250 200 0. 12 0. 17 0. 22 Child Poverty Rate 0. 27 0. 32
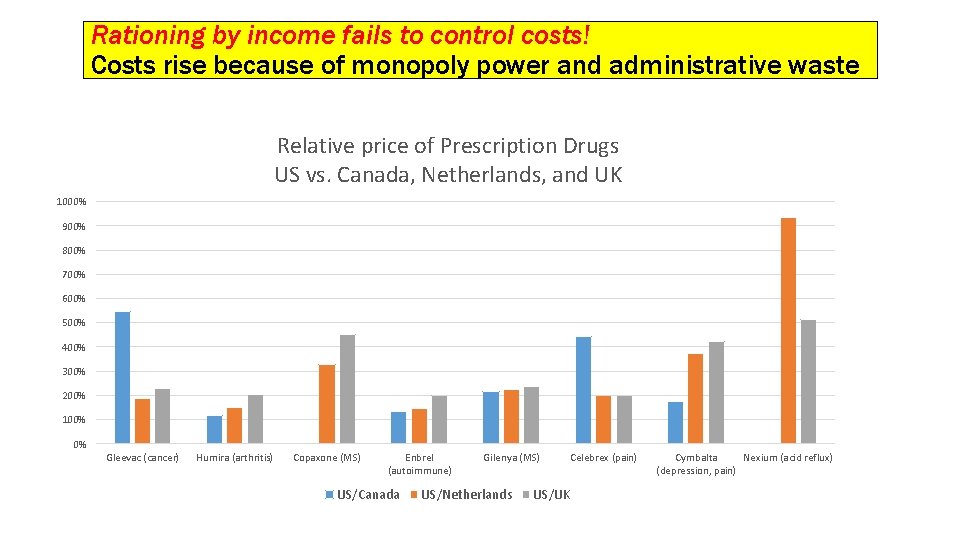
Rationing by income fails to control costs! Costs rise because of monopoly power and administrative waste Relative price of Prescription Drugs US vs. Canada, Netherlands, and UK 1000% 900% 800% 700% 600% 500% 400% 300% 200% 100% 0% Gleevac (cancer) Humira (arthritis) Copaxone (MS) Enbrel (autoimmune) Gilenya (MS) Celebrex (pain) US/Canada US/Netherlands US/UK http: //www. commonwealthfund. org/usr_doc/Davis_slowinggrowth. UShltcare expenditureswhatareoptions_989. pdf These are quality controlled price indices from the Bureau of Labor Cymbalta Nexium (acid reflux) (depression, pain)
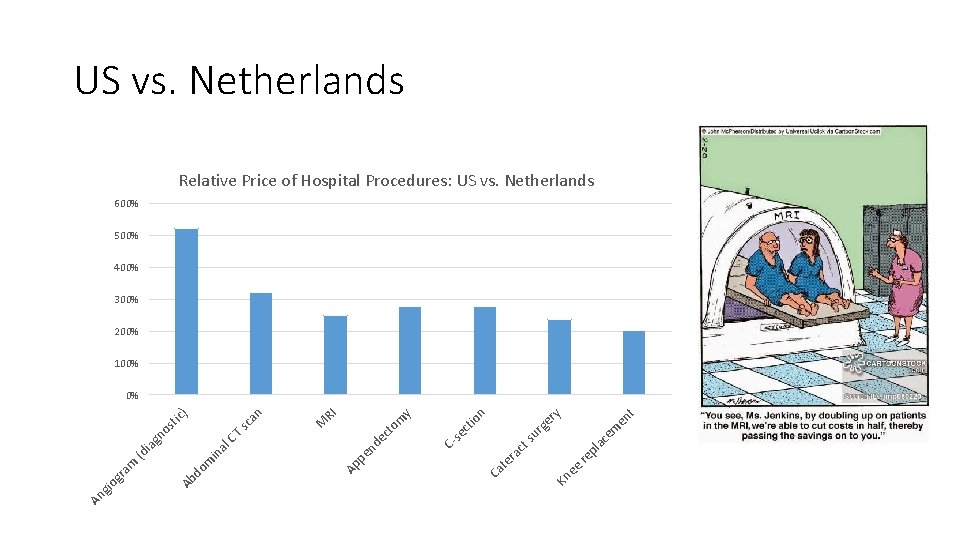
US vs. Netherlands Relative Price of Hospital Procedures: US vs. Netherlands 600% 500% 400% 300% 200% 100% re ee Kn Ca te ra pl ct su r ac em ge en t ry n io ct ct o de pe n Cse m y RI M Ap in do m Ab An gio gr am (d al ia CT gn os tic ) sc an 0%
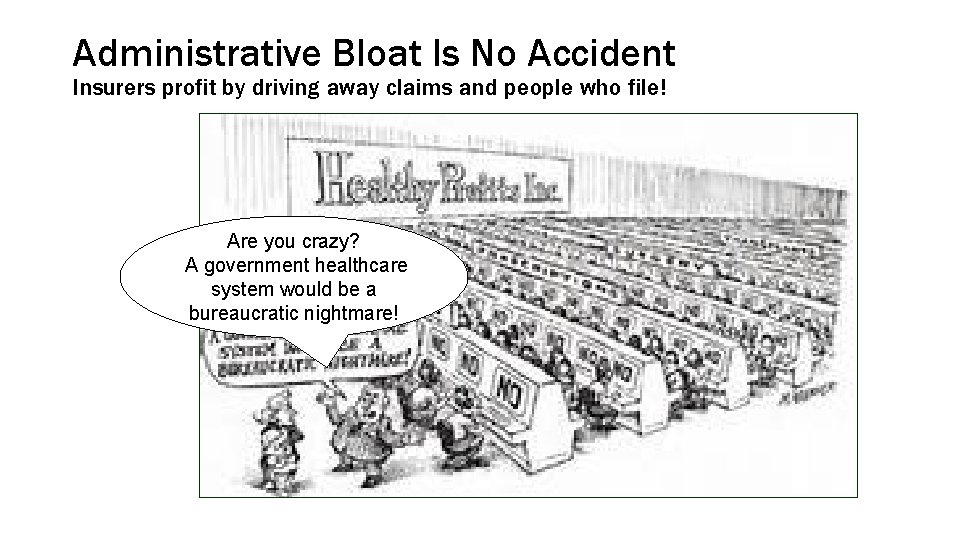
Administrative Bloat Is No Accident Insurers profit by driving away claims and people who file! Are you crazy? A government healthcare system would be a bureaucratic nightmare!
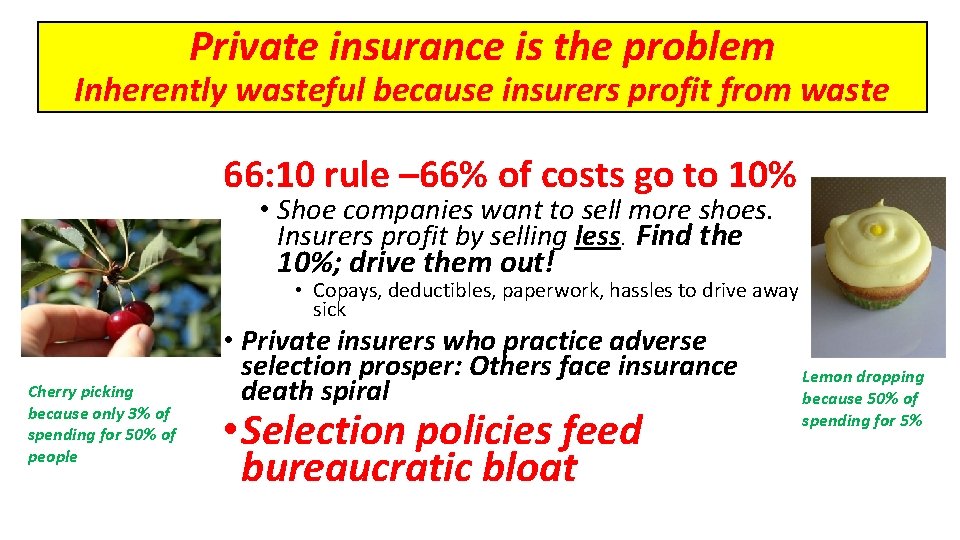
Private insurance is the problem Inherently wasteful because insurers profit from waste 66: 10 rule – 66% of costs go to 10% • Shoe companies want to sell more shoes. Insurers profit by selling less. Find the 10%; drive them out! • Copays, deductibles, paperwork, hassles to drive away sick Cherry picking because only 3% of spending for 50% of people • Private insurers who practice adverse selection prosper: Others face insurance death spiral • Selection policies feed bureaucratic bloat Lemon dropping because 50% of spending for 5%
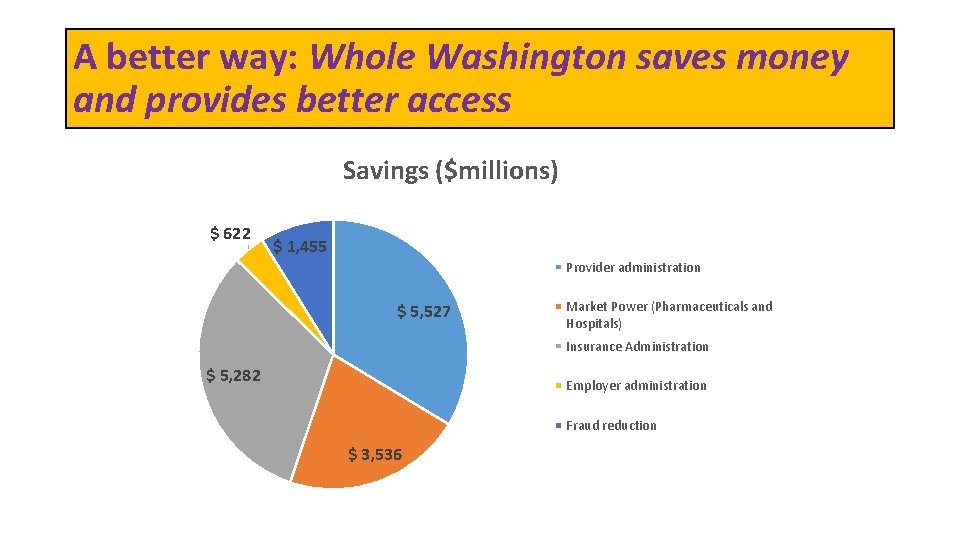
A better way: Whole Washington saves money and provides better access Savings ($millions) $ 622 $ 1, 455 Provider administration $ 5, 527 Market Power (Pharmaceuticals and Hospitals) Insurance Administration $ 5, 282 Employer administration Fraud reduction $ 3, 536
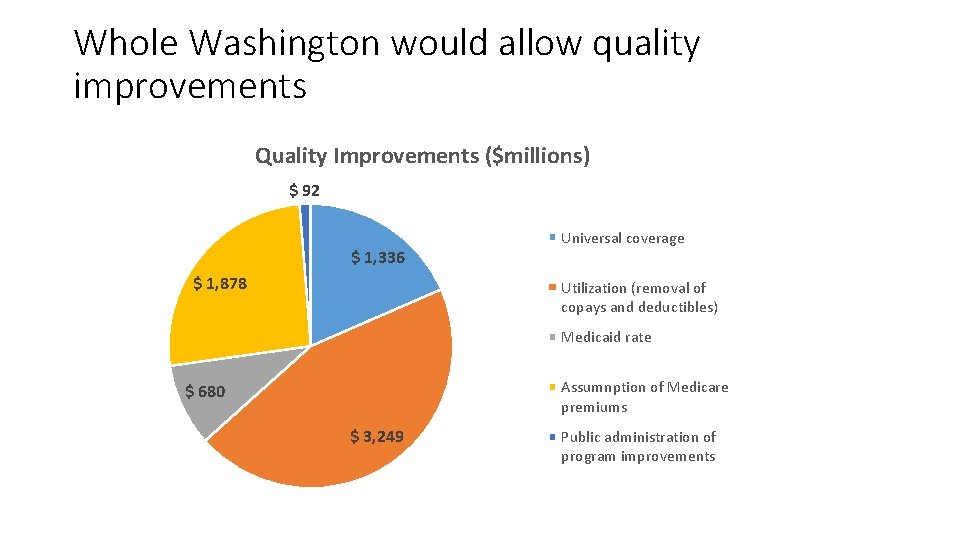
Whole Washington would allow quality improvements Quality Improvements ($millions) $ 92 $ 1, 336 $ 1, 878 Universal coverage Utilization (removal of copays and deductibles) Medicaid rate Assumnption of Medicare premiums $ 680 $ 3, 249 Public administration of program improvements
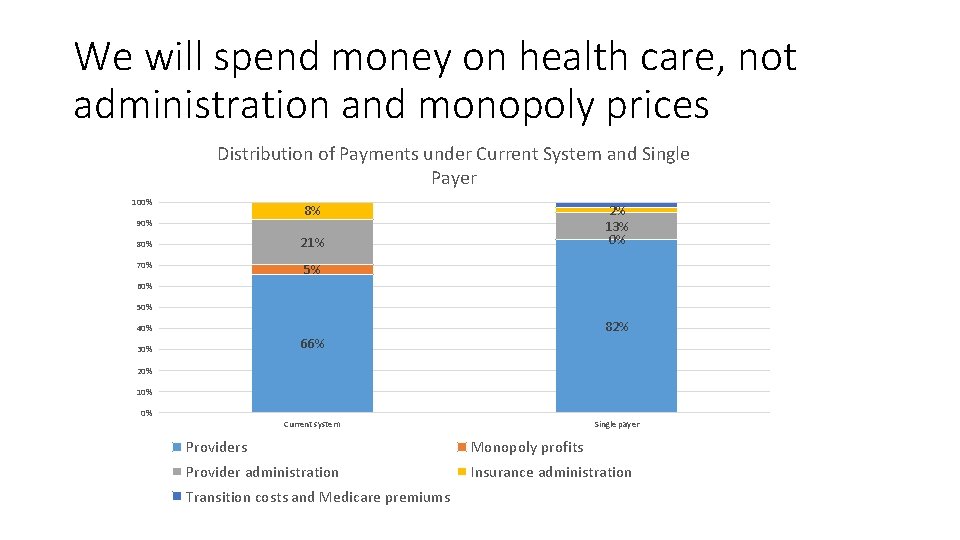
We will spend money on health care, not administration and monopoly prices Distribution of Payments under Current System and Single Payer 100% 2% 13% 0% 8% 90% 80% 21% 70% 5% 60% 50% 82% 40% 66% 30% 20% 10% 0% Current system Single payer Providers Monopoly profits Provider administration Insurance administration Transition costs and Medicare premiums
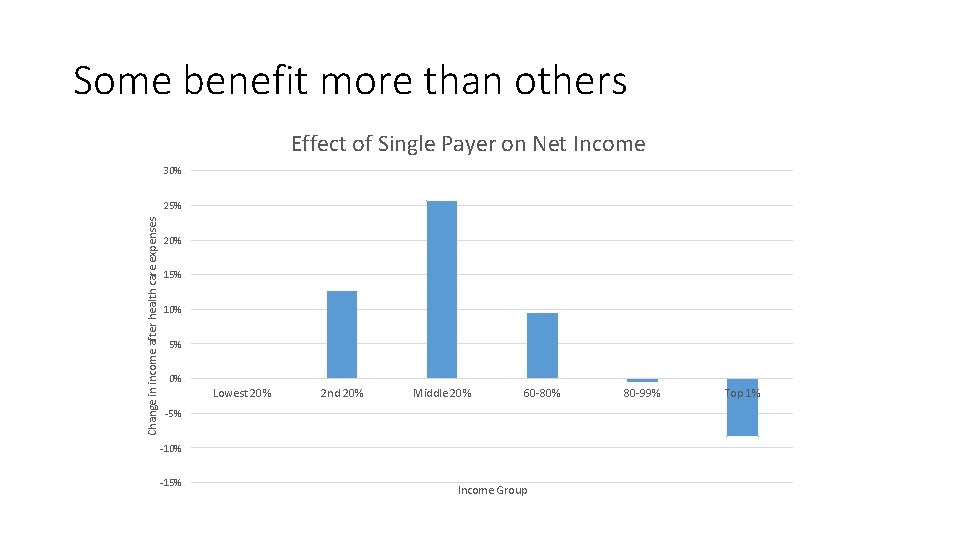
Some benefit more than others Effect of Single Payer on Net Income 30% Change in income after health care expenses 25% 20% 15% 10% 5% 0% Lowest 20% 2 nd 20% Middle 20% 60 -80% -5% -10% -15% Income Group 80 -99% Top 1%
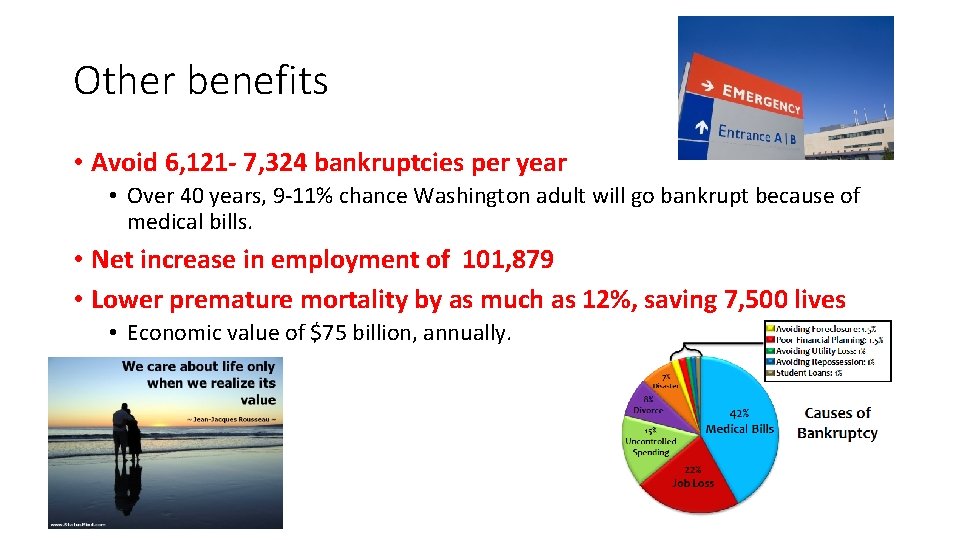
Other benefits • Avoid 6, 121 - 7, 324 bankruptcies per year • Over 40 years, 9 -11% chance Washington adult will go bankrupt because of medical bills. • Net increase in employment of 101, 879 • Lower premature mortality by as much as 12%, saving 7, 500 lives • Economic value of $75 billion, annually.
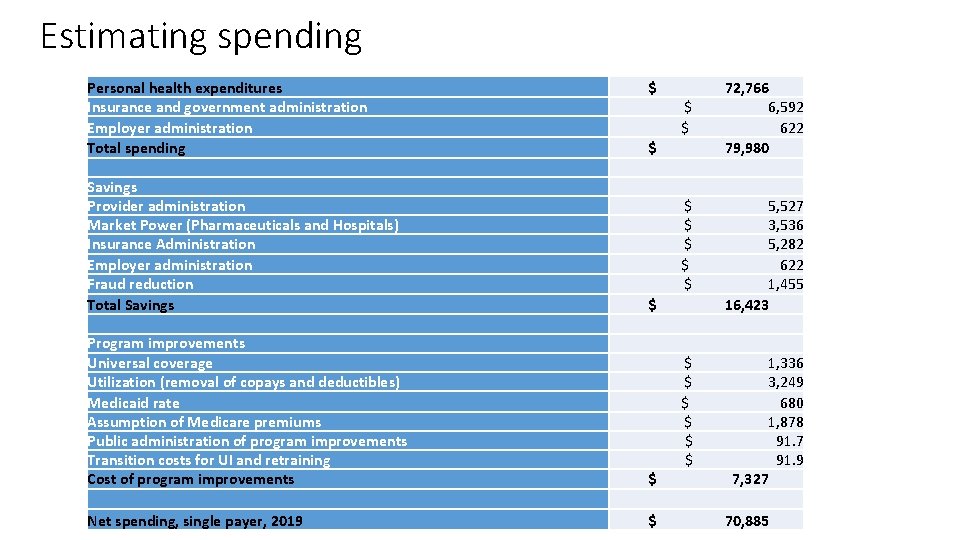
Estimating spending Personal health expenditures Insurance and government administration Employer administration Total spending Savings Provider administration Market Power (Pharmaceuticals and Hospitals) Insurance Administration Employer administration Fraud reduction Total Savings $ $ $ $ $ 5, 527 3, 536 5, 282 622 1, 455 16, 423 $ $ $ 1, 336 3, 249 680 1, 878 91. 7 91. 9 7, 327 $ Program improvements Universal coverage Utilization (removal of copays and deductibles) Medicaid rate Assumption of Medicare premiums Public administration of program improvements Transition costs for UI and retraining Cost of program improvements $ Net spending, single payer, 2019 $ 72, 766 6, 592 622 79, 980 70, 885
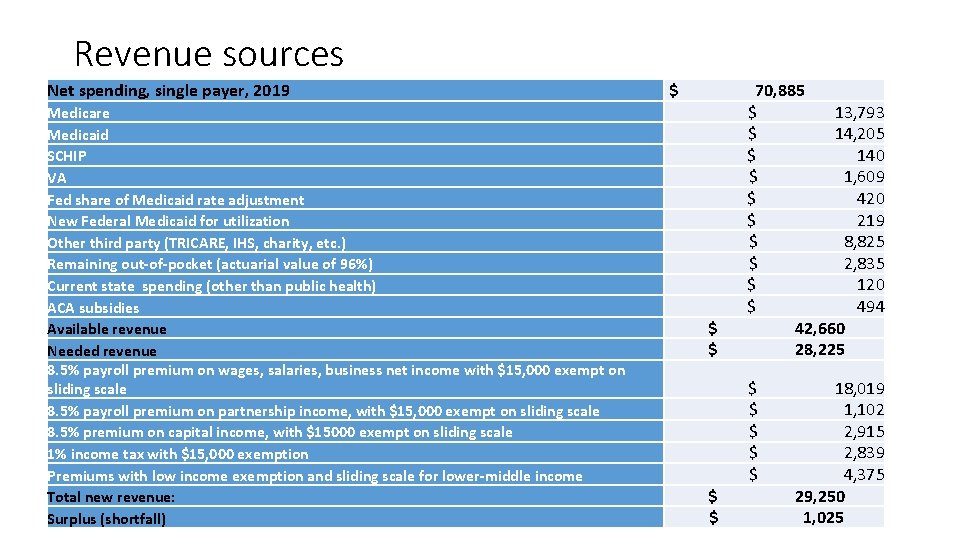
Revenue sources Net spending, single payer, 2019 Medicare Medicaid SCHIP VA Fed share of Medicaid rate adjustment New Federal Medicaid for utilization Other third party (TRICARE, IHS, charity, etc. ) Remaining out-of-pocket (actuarial value of 96%) Current state spending (other than public health) ACA subsidies Available revenue Needed revenue 8. 5% payroll premium on wages, salaries, business net income with $15, 000 exempt on sliding scale 8. 5% payroll premium on partnership income, with $15, 000 exempt on sliding scale 8. 5% premium on capital income, with $15000 exempt on sliding scale 1% income tax with $15, 000 exemption Premiums with low income exemption and sliding scale for lower-middle income Total new revenue: Surplus (shortfall) $ $ $ 70, 885 $ 13, 793 $ 14, 205 $ 140 $ 1, 609 $ 420 $ 219 $ 8, 825 $ 2, 835 $ 120 $ 494 42, 660 28, 225 $ $ $ 18, 019 1, 102 2, 915 2, 839 4, 375 29, 250 1, 025
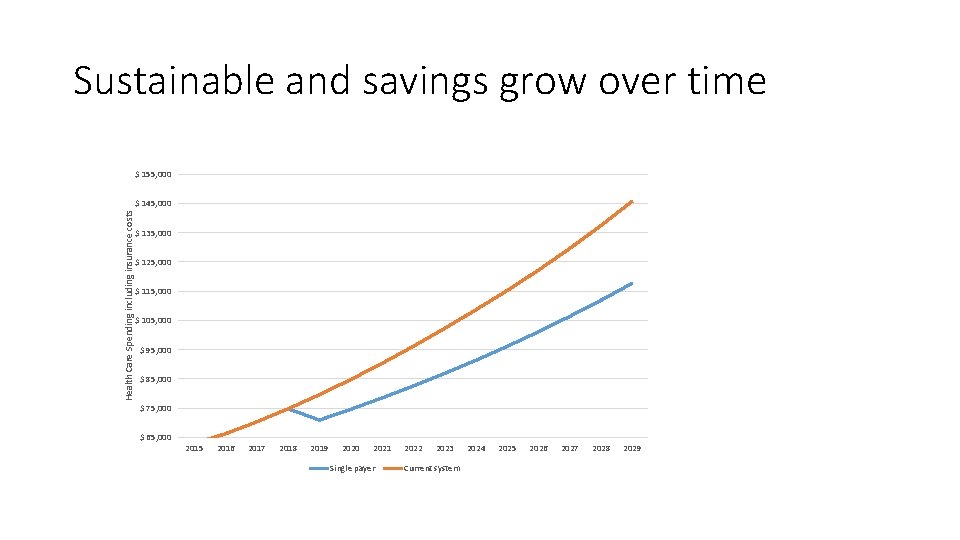
Sustainable and savings grow over time $ 155, 000 Health Care Spending including insurance costs $ 145, 000 $ 135, 000 $ 125, 000 $ 115, 000 $ 105, 000 $ 95, 000 $ 85, 000 $ 75, 000 $ 65, 000 2015 2016 2017 2018 2019 2020 2021 Single payer 2022 2023 Current system 2024 2025 2026 2027 2028 2029
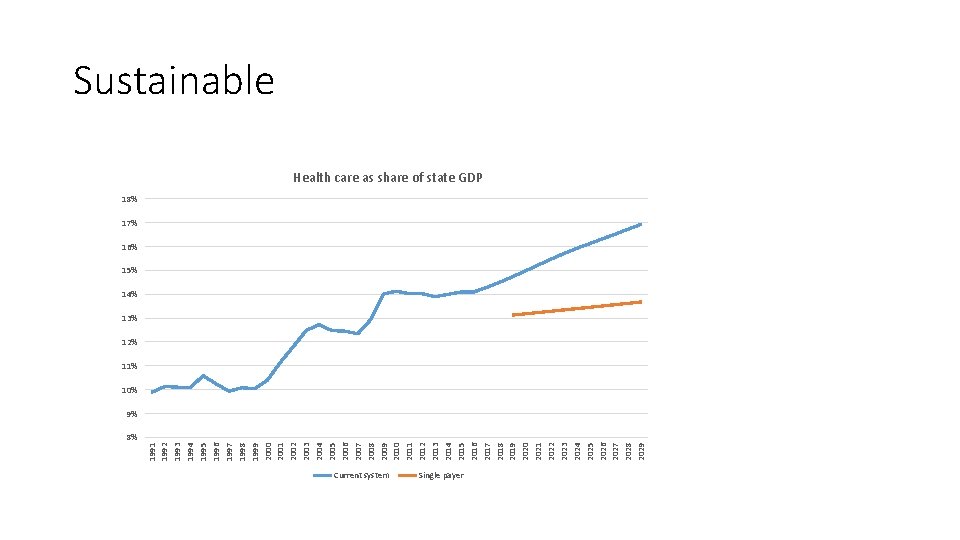
8% 1991 1992 1993 1994 1995 1996 1997 1998 1999 2000 2001 2002 2003 2004 2005 2006 2007 2008 2009 2010 2011 2012 2013 2014 2015 2016 2017 2018 2019 2020 2021 2022 2023 2024 2025 2026 2027 2028 2029 Sustainable Health care as share of state GDP 18% 17% 16% 15% 14% 13% 12% 11% 10% 9% Current system Single payer
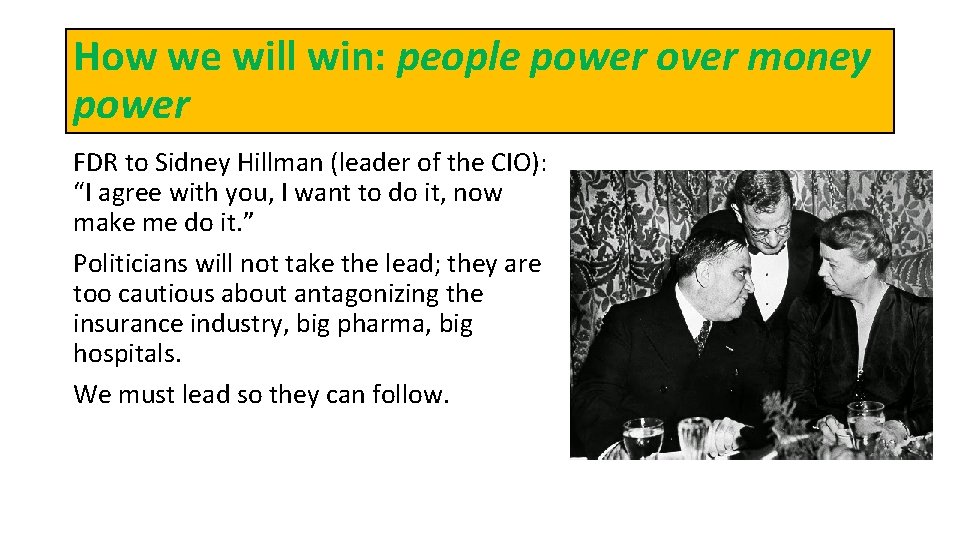
How we will win: people power over money power FDR to Sidney Hillman (leader of the CIO): “I agree with you, I want to do it, now make me do it. ” Politicians will not take the lead; they are too cautious about antagonizing the insurance industry, big pharma, big hospitals. We must lead so they can follow.

All Of Us Have the Right to Health Care. We Can Make It Happen.
- Slides: 30