
WHO WE ARE IN 2004 www 1979 reunionfever


- Slides: 112
WHO WE ARE IN 2004
www. 1979 reunionfever. com – raw survey results – today’s presentation – Do your own crosstabs!
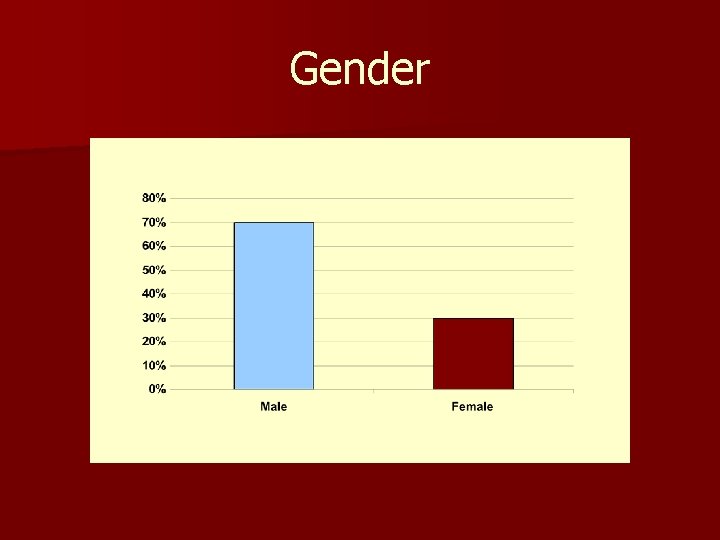
Gender
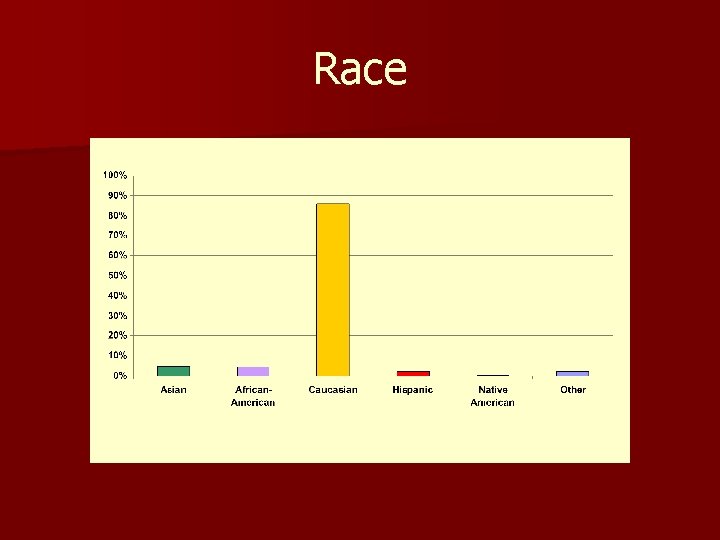
Race
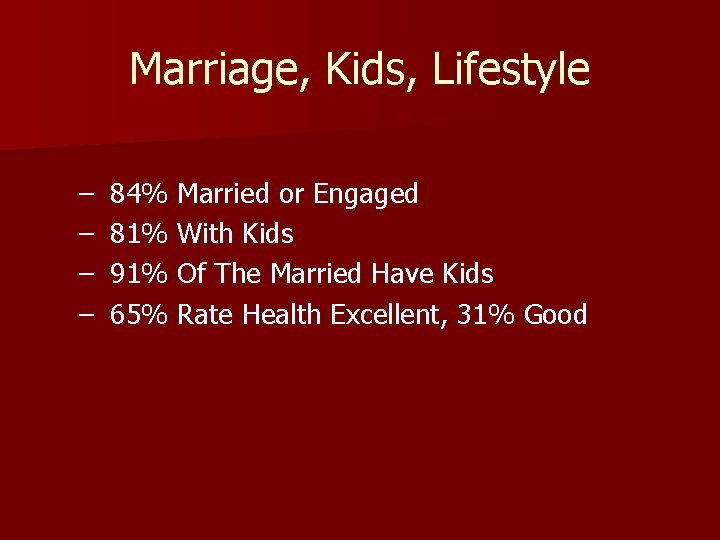
Marriage, Kids, Lifestyle – – 84% Married or Engaged 81% With Kids 91% Of The Married Have Kids 65% Rate Health Excellent, 31% Good
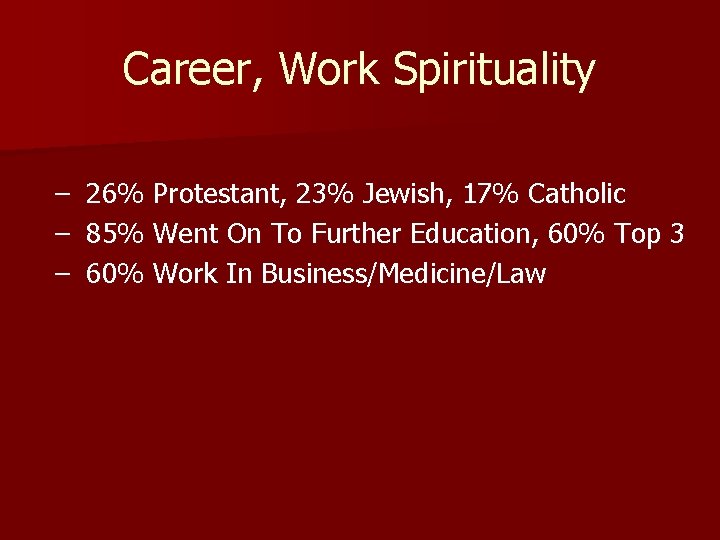
Career, Work Spirituality – – – 26% Protestant, 23% Jewish, 17% Catholic 85% Went On To Further Education, 60% Top 3 60% Work In Business/Medicine/Law
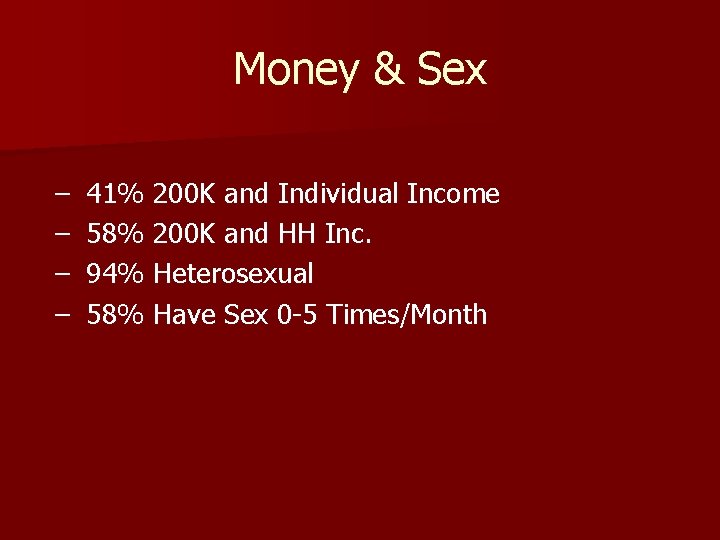
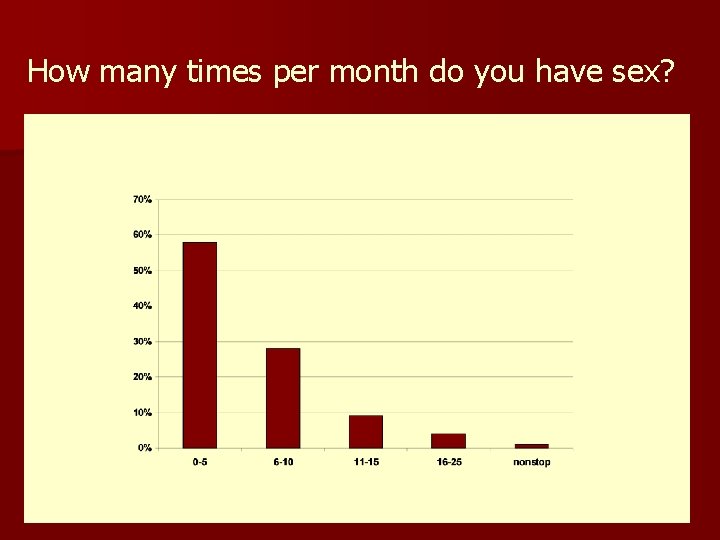
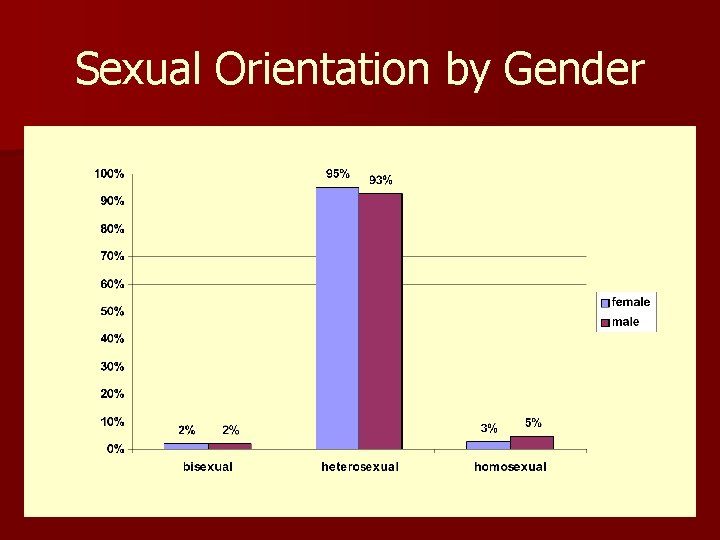
Money & Sex – – 41% 200 K and Individual Income 58% 200 K and HH Inc. 94% Heterosexual 58% Have Sex 0 -5 Times/Month
Harvard-Radcliffe Class of 1979 Survey Report: Marriage, Kids, Lifestyle
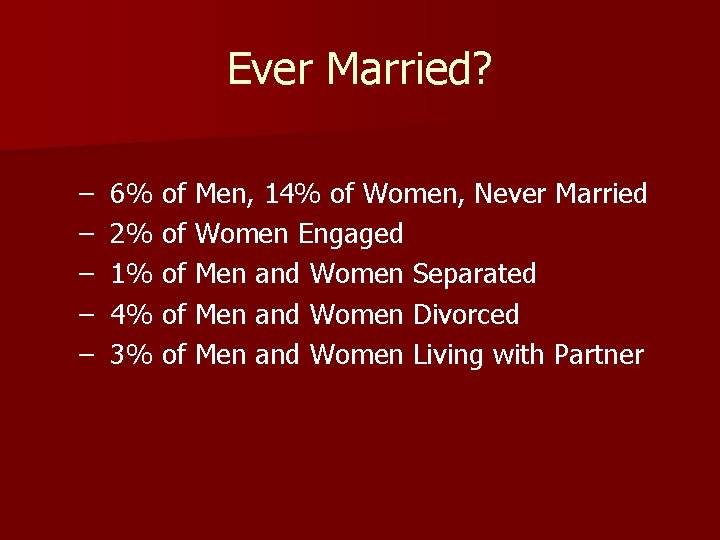
Ever Married? – – – 6% of Men, 14% of Women, Never Married 2% of Women Engaged 1% of Men and Women Separated 4% of Men and Women Divorced 3% of Men and Women Living with Partner
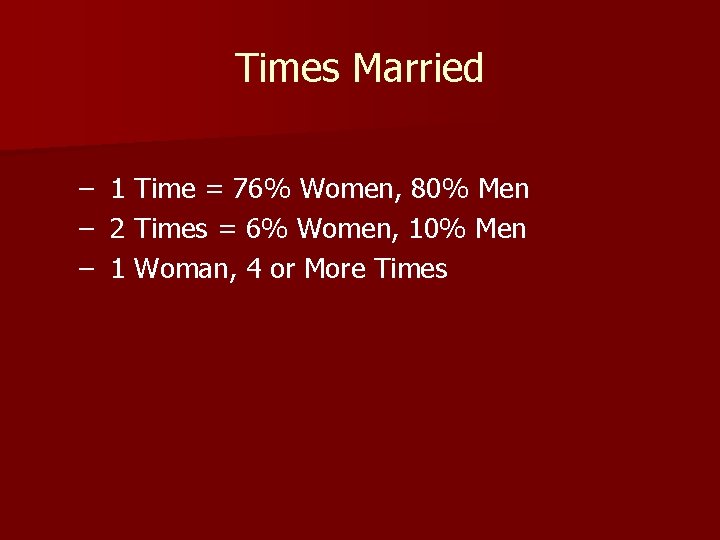
Times Married – 1 Time = 76% Women, 80% Men – 2 Times = 6% Women, 10% Men – 1 Woman, 4 or More Times
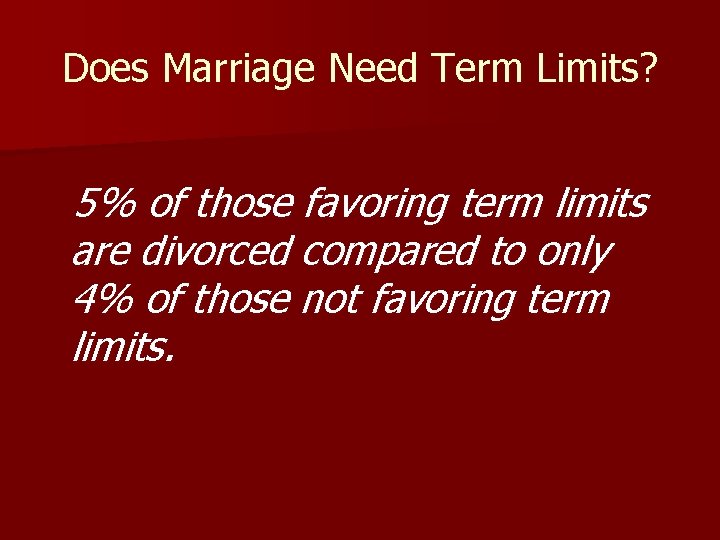
Does Marriage Need Term Limits? 5% of those favoring term limits are divorced compared to only 4% of those not favoring term limits.
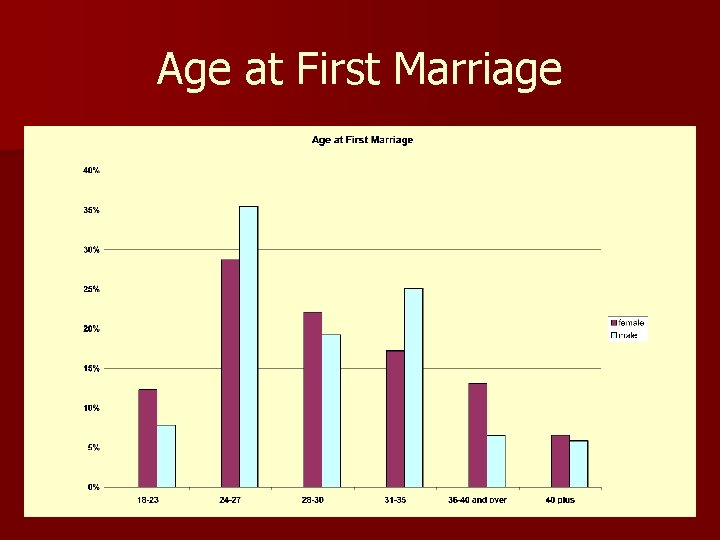
Age at First Marriage
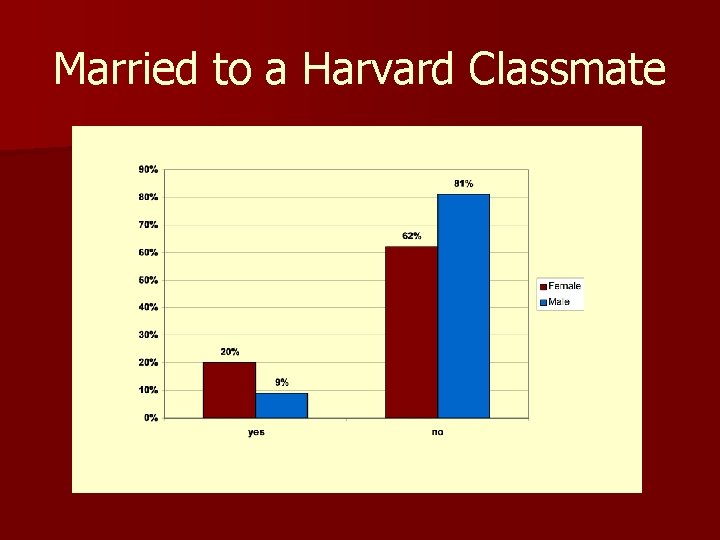
Married to a Harvard Classmate
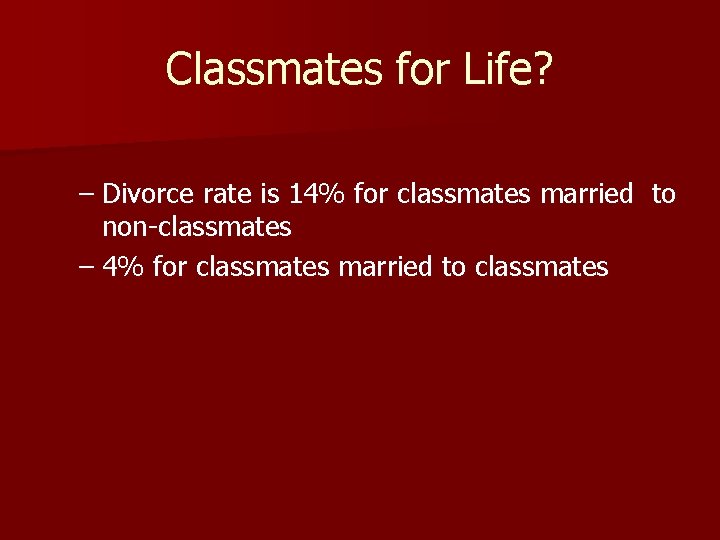
Classmates for Life? – Divorce rate is 14% for classmates married to non-classmates – 4% for classmates married to classmates
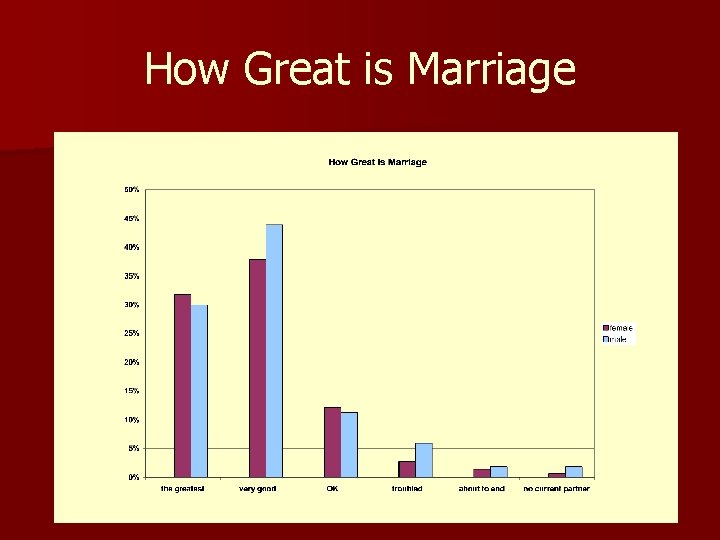
How Great is Marriage
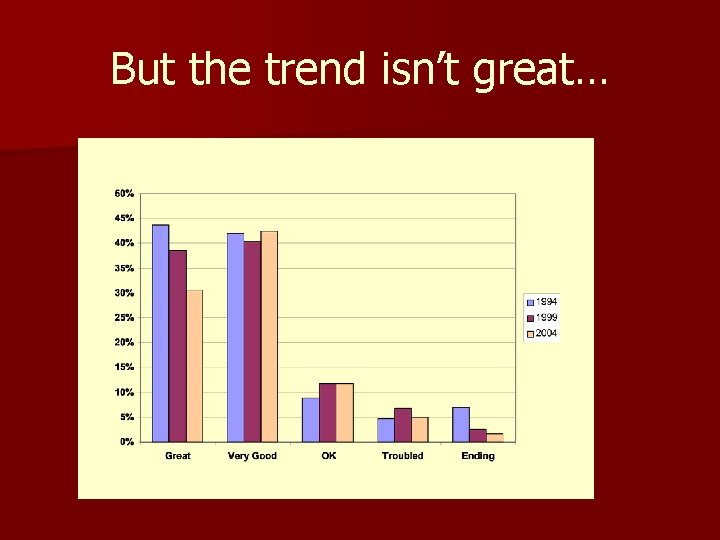
But the trend isn’t great…
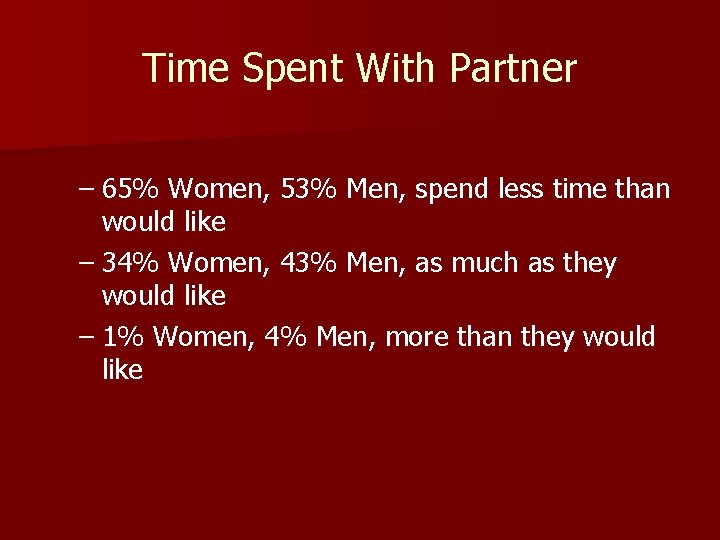
Time Spent With Partner – 65% Women, 53% Men, spend less time than would like – 34% Women, 43% Men, as much as they would like – 1% Women, 4% Men, more than they would like
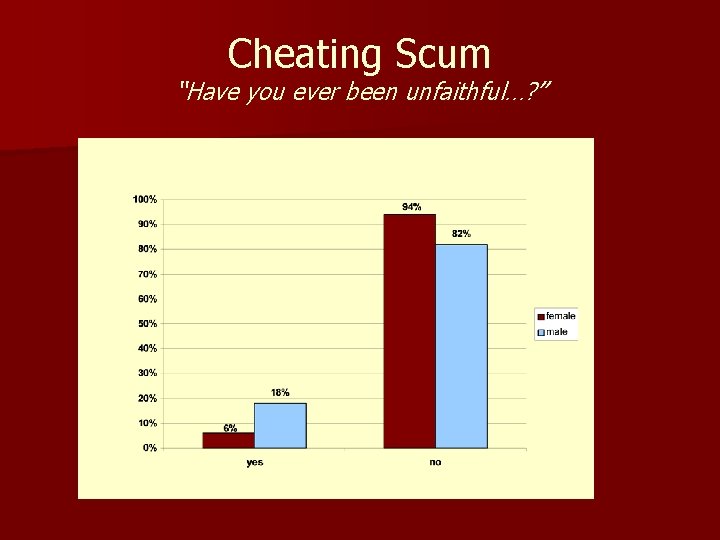
Cheating Scum “Have you ever been unfaithful…? ”
Out of Sight, Out of Mind – 58% of the “faithful” spend less time with partners than they would like, vs. 38% of faithful – 11% of unfaithful spend more time with partners than they would like, vs. 2% for faithful – But 38% of the “unfaithful” would still like to spend more time with spouse
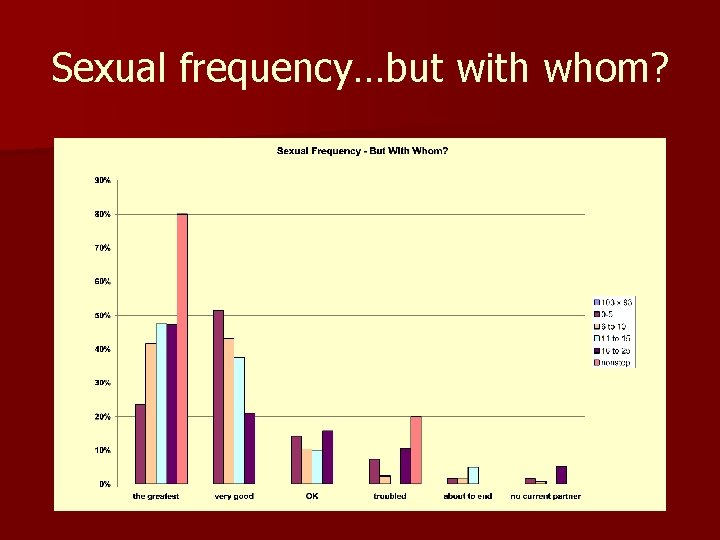
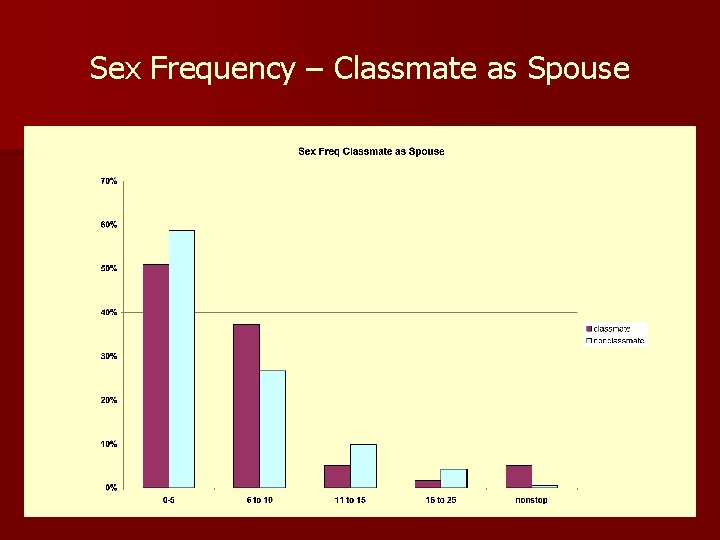
Sexual frequency…but with whom?
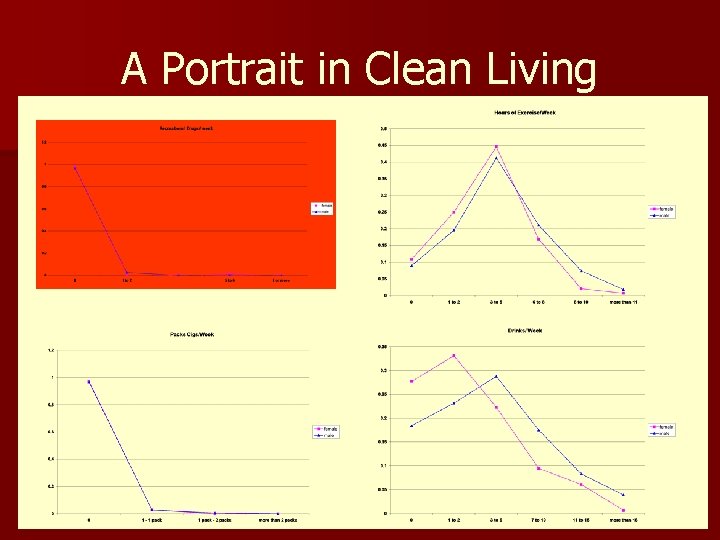
A Portrait in Clean Living
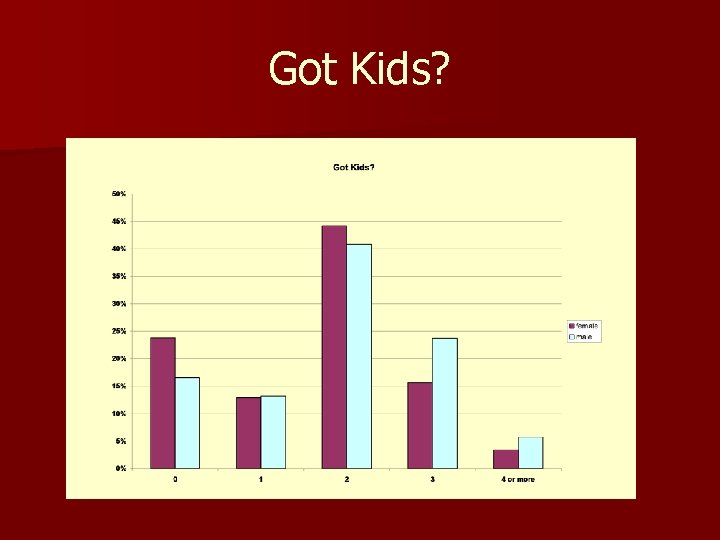
Got Kids?
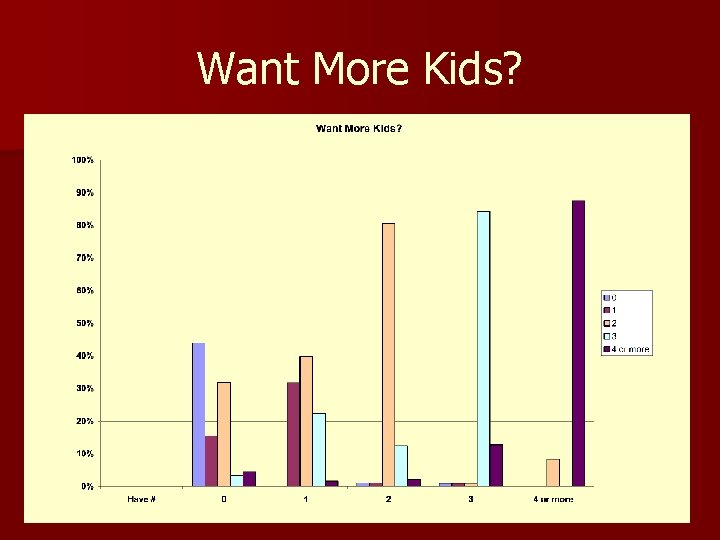
Want More Kids?
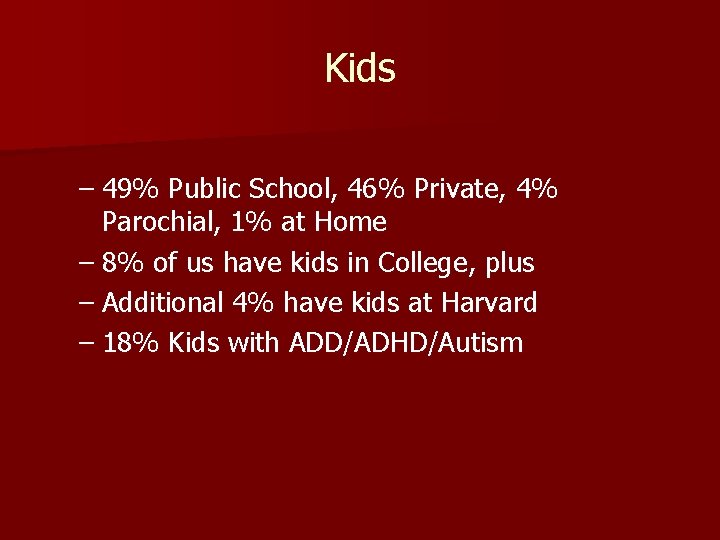
Kids – 49% Public School, 46% Private, 4% Parochial, 1% at Home – 8% of us have kids in College, plus – Additional 4% have kids at Harvard – 18% Kids with ADD/ADHD/Autism
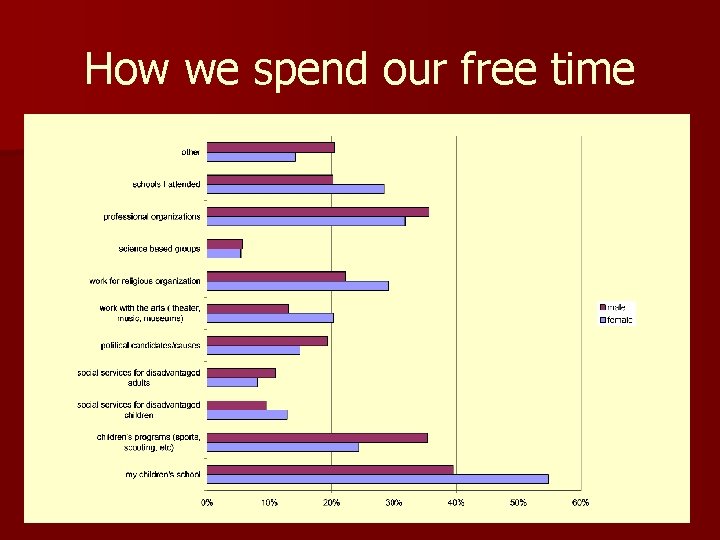
How we spend our free time
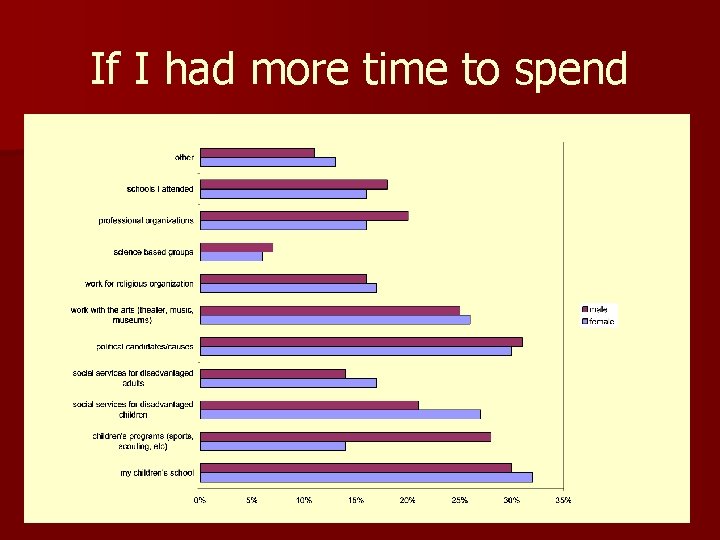
If I had more time to spend
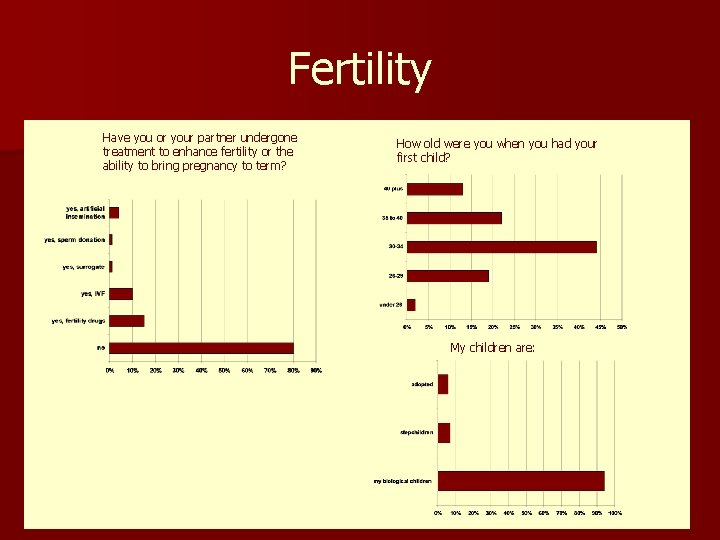
Fertility Have you or your partner undergone treatment to enhance fertility or the ability to bring pregnancy to term? How old were you when you had your first child? My children are:
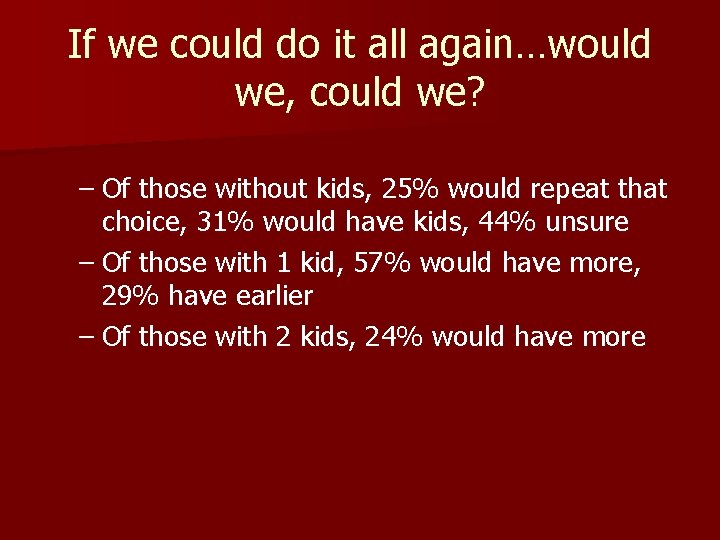
If we could do it all again…would we, could we? – Of those without kids, 25% would repeat that choice, 31% would have kids, 44% unsure – Of those with 1 kid, 57% would have more, 29% have earlier – Of those with 2 kids, 24% would have more
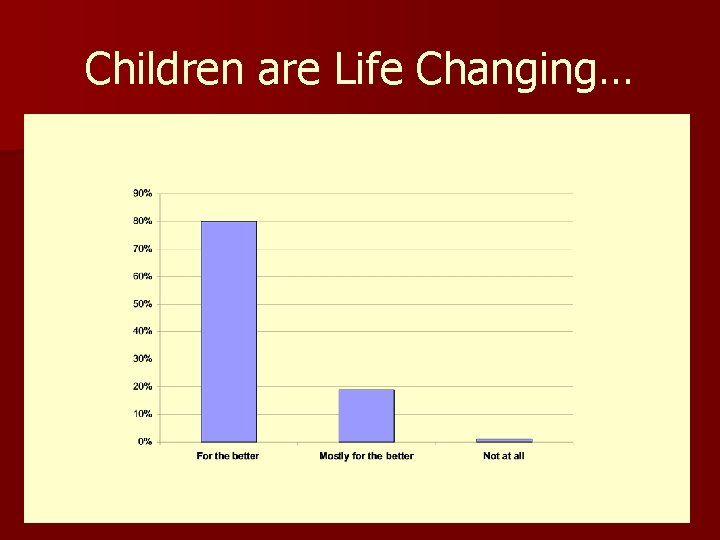
Children are Life Changing…
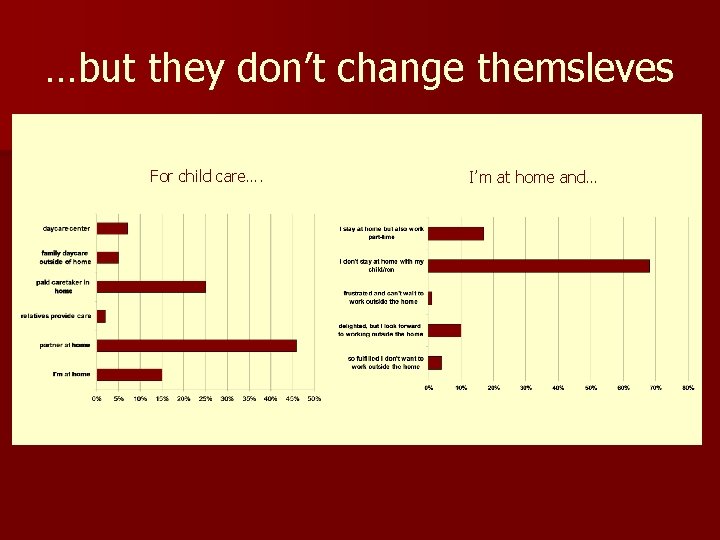
…but they don’t change themsleves For child care…. I’m at home and…
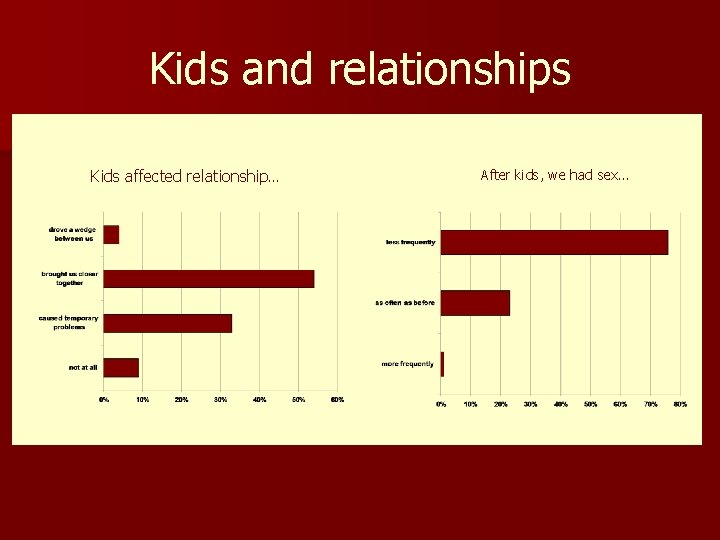
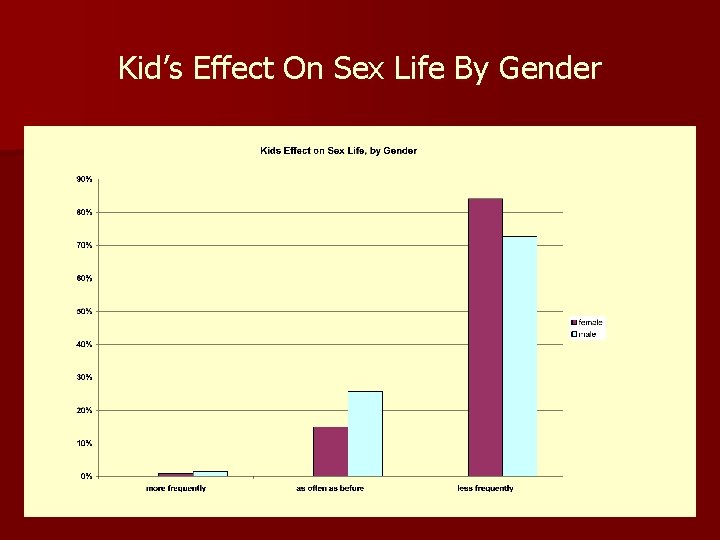
Kids and relationships Kids affected relationship… After kids, we had sex…
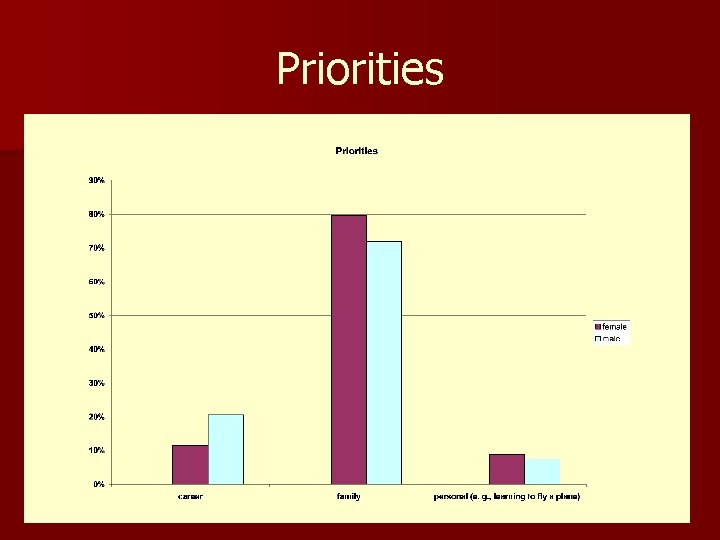
Priorities
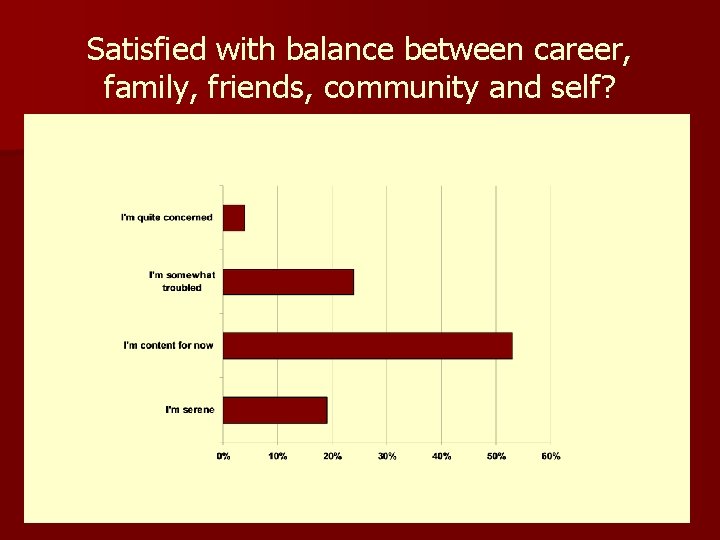
Satisfied with balance between career, family, friends, community and self?
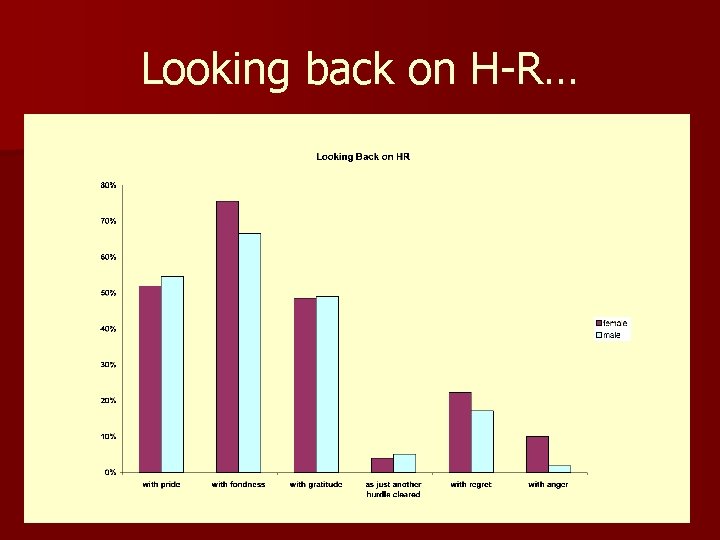
Looking back on H-R…
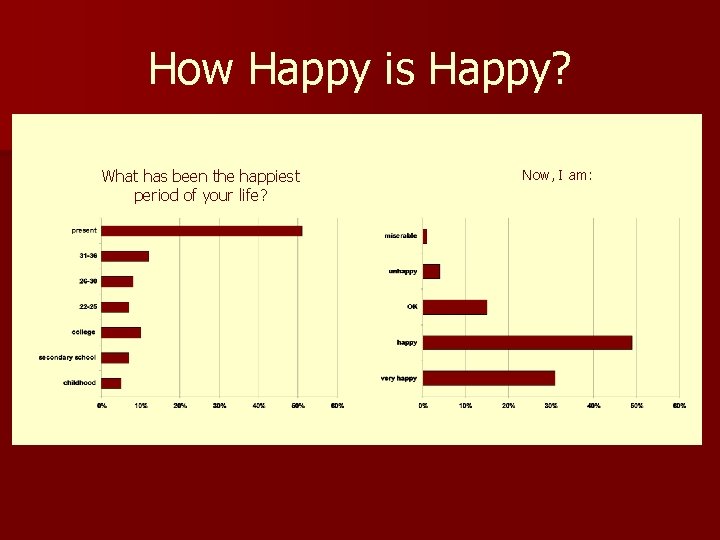
How Happy is Happy? What has been the happiest period of your life? Now, I am:
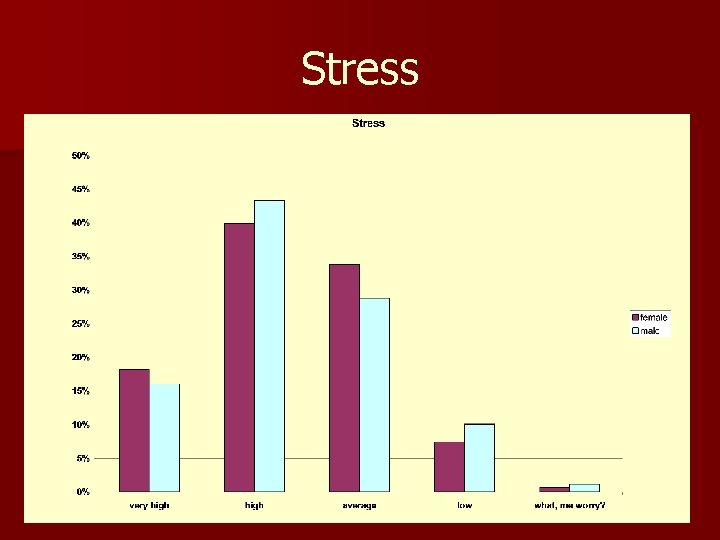
Stress
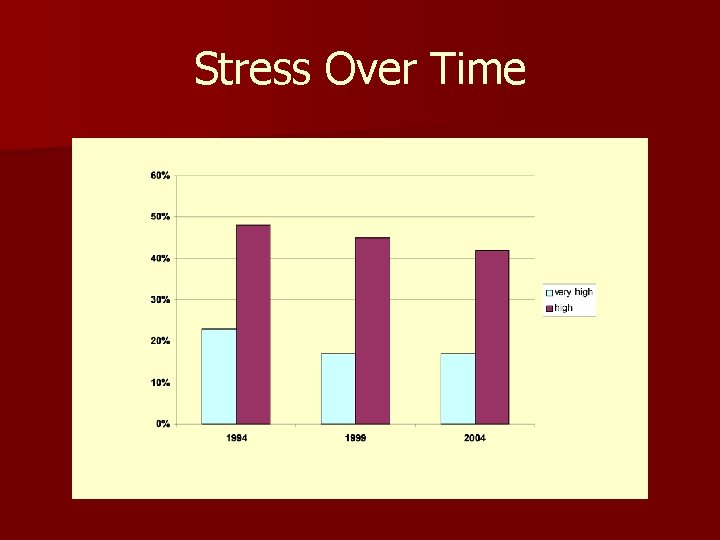
Stress Over Time
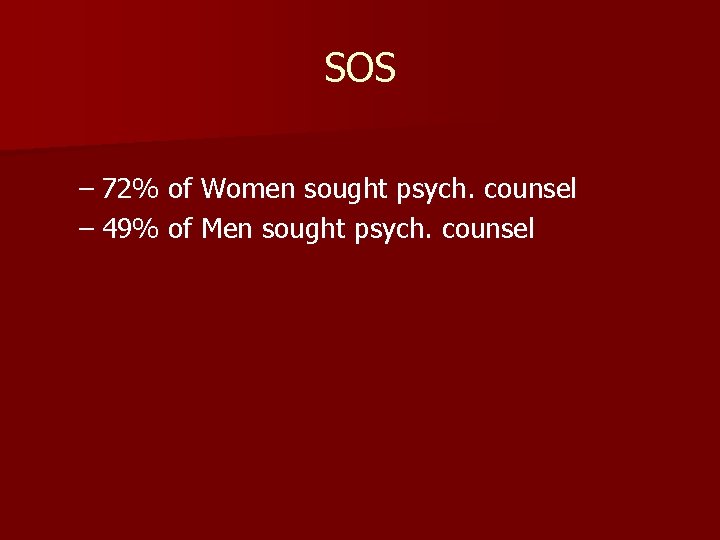
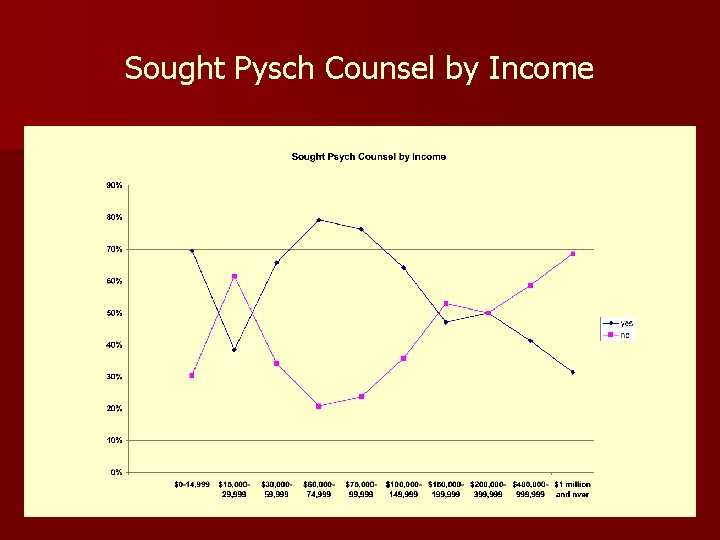
SOS – 72% of Women sought psych. counsel – 49% of Men sought psych. counsel
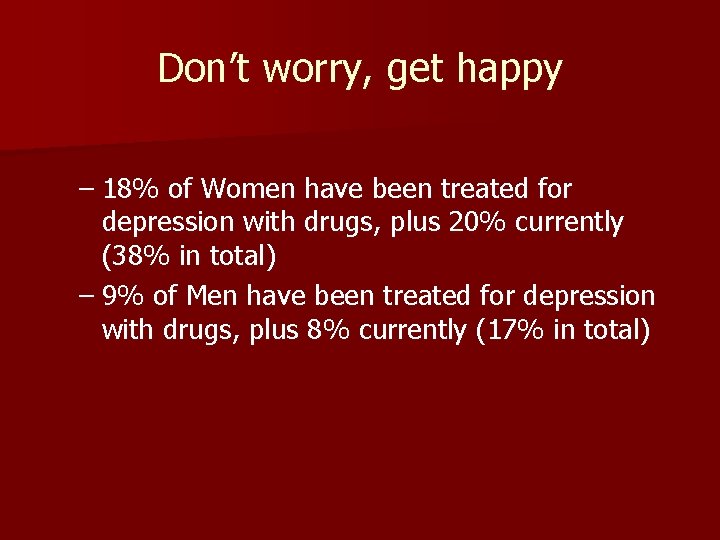
Don’t worry, get happy – 18% of Women have been treated for depression with drugs, plus 20% currently (38% in total) – 9% of Men have been treated for depression with drugs, plus 8% currently (17% in total)
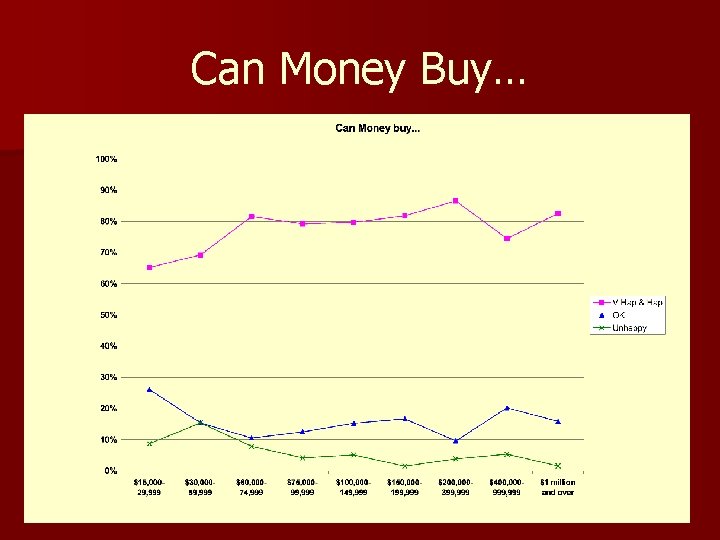
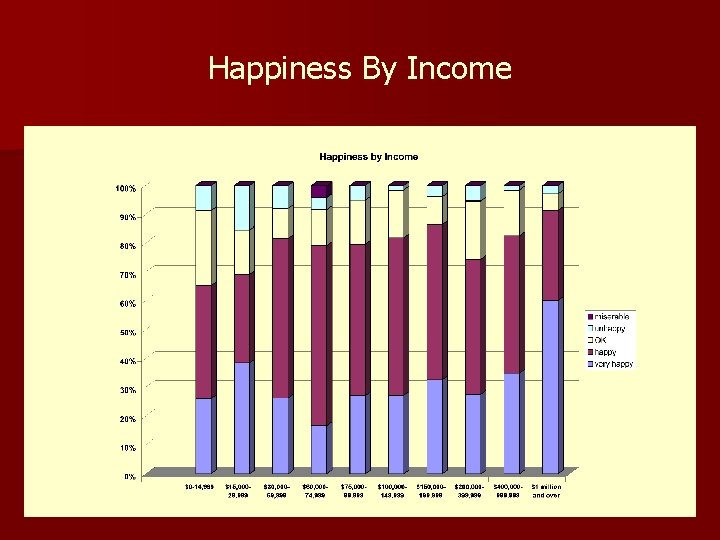
Can Money Buy…
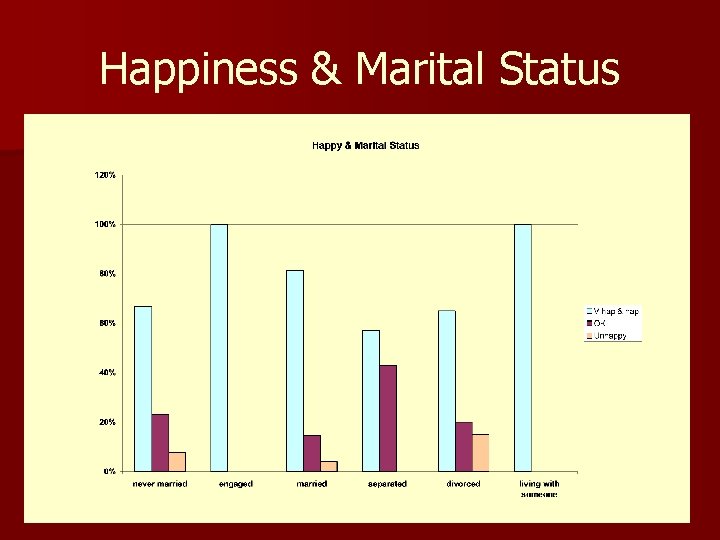
Happiness & Marital Status
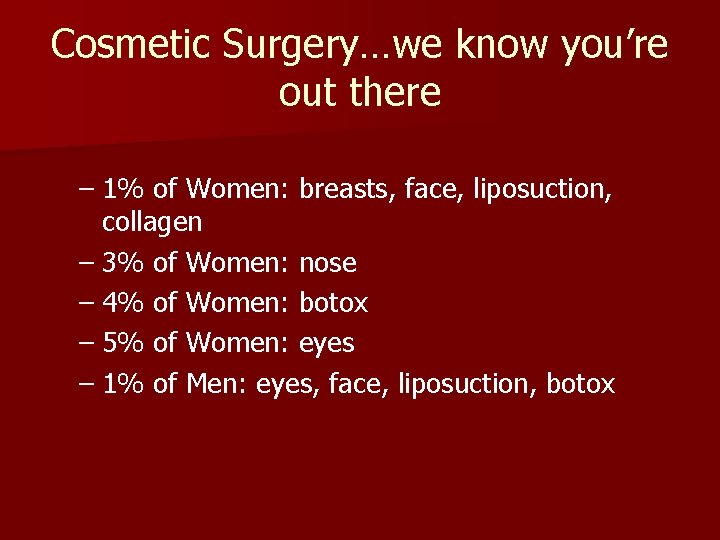
Cosmetic Surgery…we know you’re out there – 1% of Women: breasts, face, liposuction, collagen – 3% of Women: nose – 4% of Women: botox – 5% of Women: eyes – 1% of Men: eyes, face, liposuction, botox
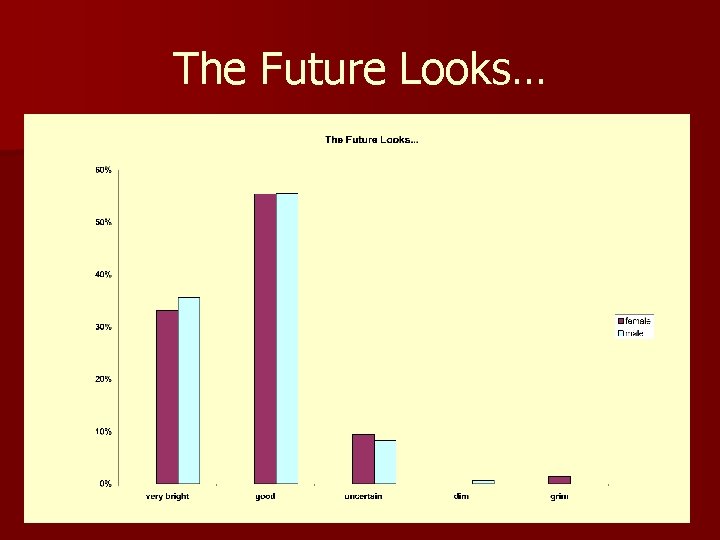
The Future Looks…
Harvard-Radcliffe Class of 1979 Survey Report: Career, Work, Spirituality
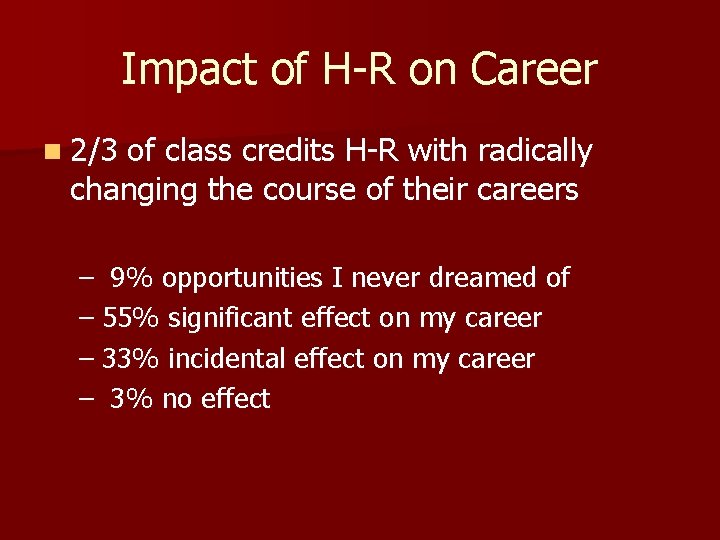
Impact of H-R on Career n 2/3 of class credits H-R with radically changing the course of their careers – 9% opportunities I never dreamed of – 55% significant effect on my career – 33% incidental effect on my career – 3% no effect
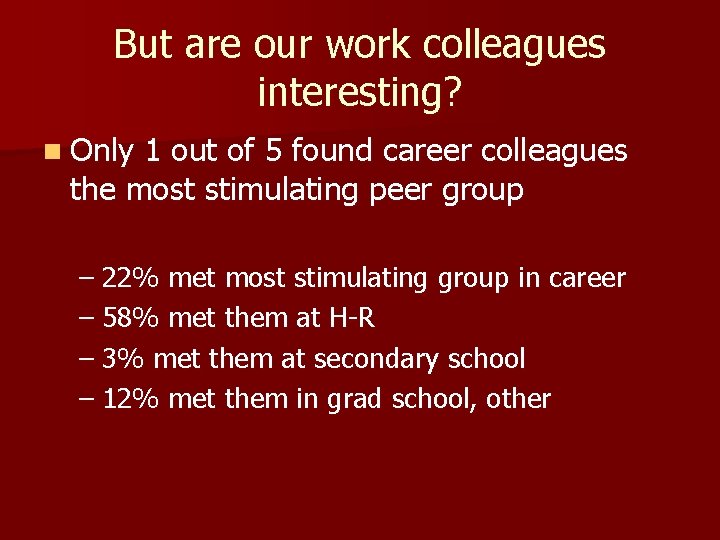
But are our work colleagues interesting? n Only 1 out of 5 found career colleagues the most stimulating peer group – 22% met most stimulating group in career – 58% met them at H-R – 3% met them at secondary school – 12% met them in grad school, other
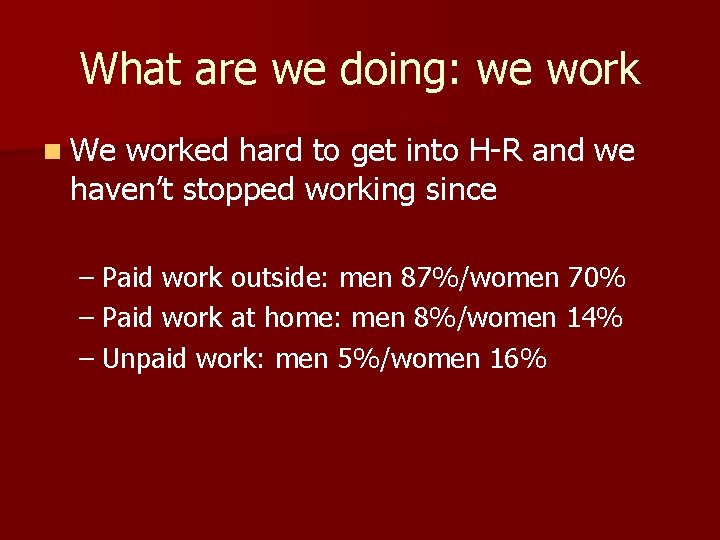
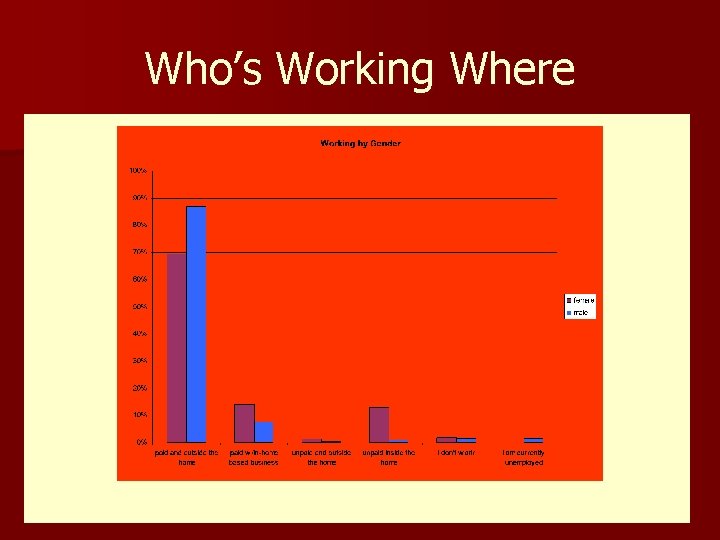
What are we doing: we work n We worked hard to get into H-R and we haven’t stopped working since – Paid work outside: men 87%/women 70% – Paid work at home: men 8%/women 14% – Unpaid work: men 5%/women 16%
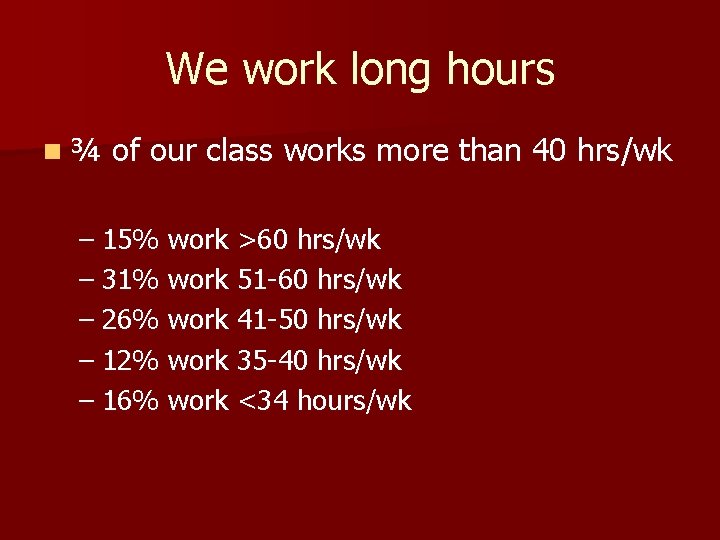
We work long hours n¾ of our class works more than 40 hrs/wk – 15% work >60 hrs/wk – 31% work 51 -60 hrs/wk – 26% work 41 -50 hrs/wk – 12% work 35 -40 hrs/wk – 16% work <34 hours/wk
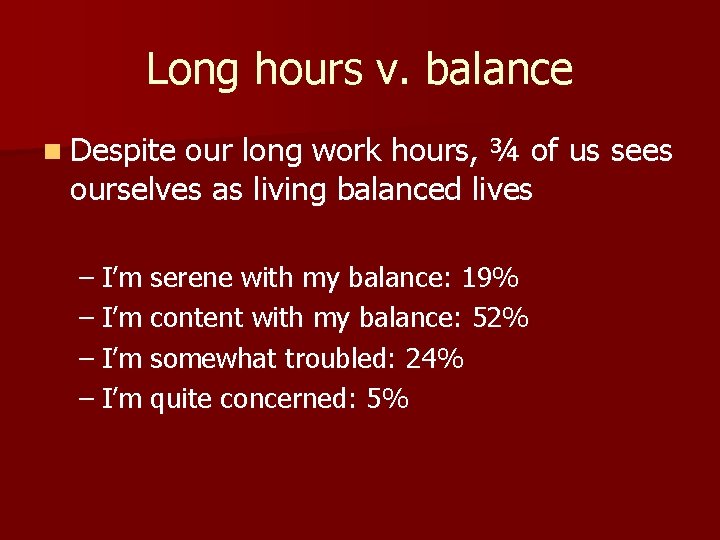
Long hours v. balance n Despite our long work hours, ¾ of us sees ourselves as living balanced lives – I’m serene with my balance: 19% – I’m content with my balance: 52% – I’m somewhat troubled: 24% – I’m quite concerned: 5%
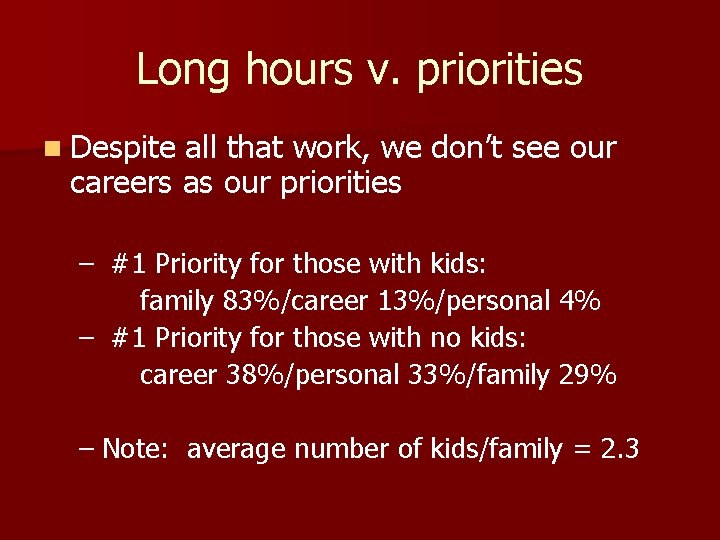
Long hours v. priorities n Despite all that work, we don’t see our careers as our priorities – #1 Priority for those with kids: family 83%/career 13%/personal 4% – #1 Priority for those with no kids: career 38%/personal 33%/family 29% – Note: average number of kids/family = 2. 3
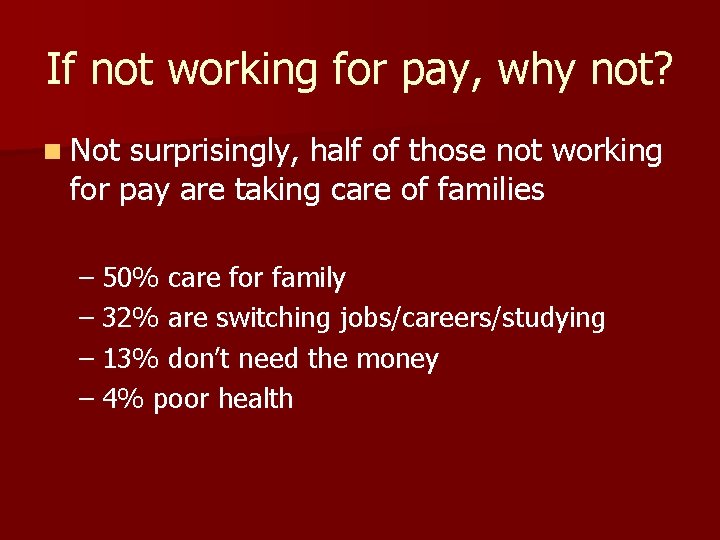
If not working for pay, why not? n Not surprisingly, half of those not working for pay are taking care of families – 50% care for family – 32% are switching jobs/careers/studying – 13% don’t need the money – 4% poor health
Who’s Working Where
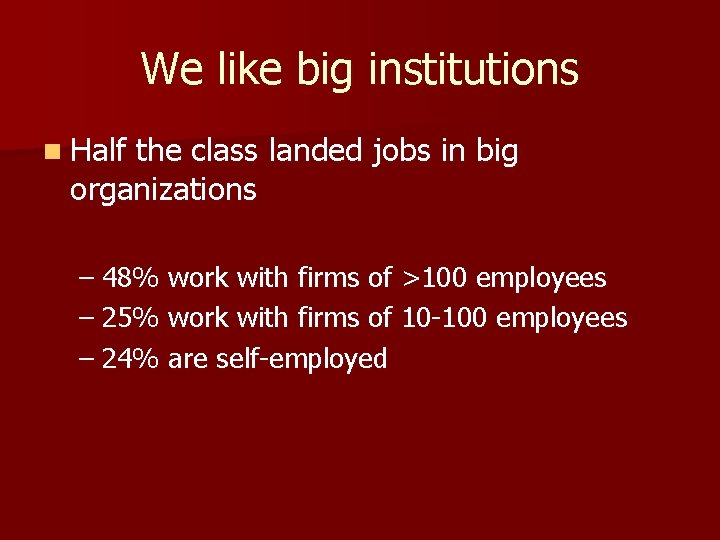
We like big institutions n Half the class landed jobs in big organizations – 48% work with firms of >100 employees – 25% work with firms of 10 -100 employees – 24% are self-employed
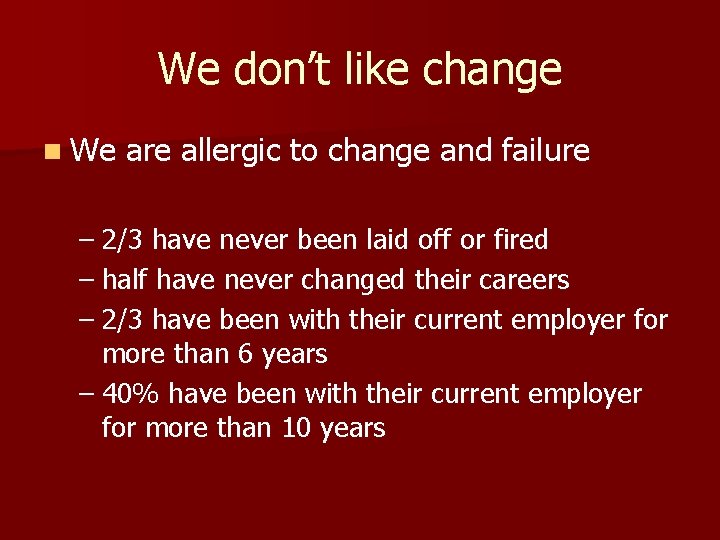
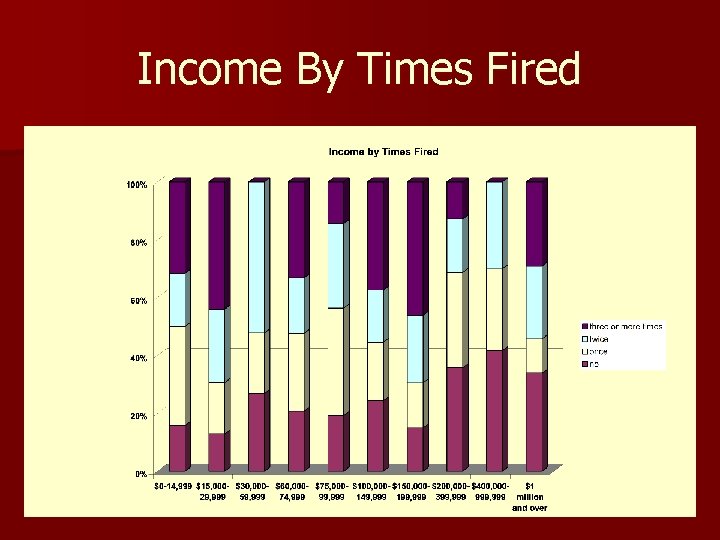
We don’t like change n We are allergic to change and failure – 2/3 have never been laid off or fired – half have never changed their careers – 2/3 have been with their current employer for more than 6 years – 40% have been with their current employer for more than 10 years
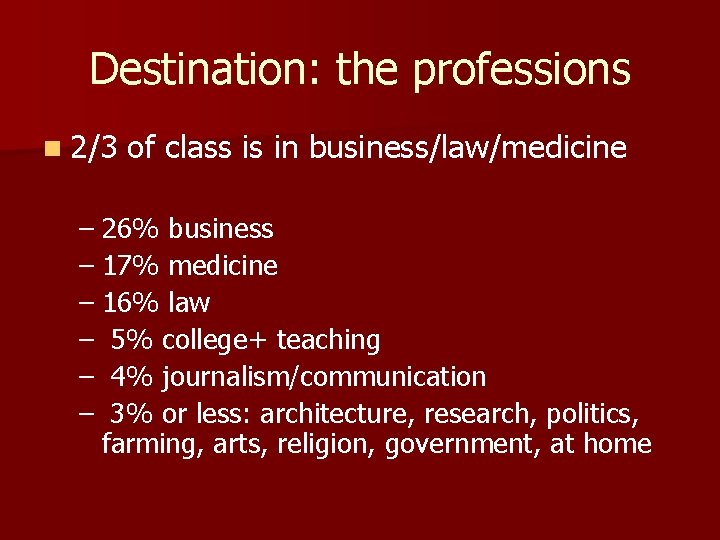
Destination: the professions n 2/3 of class is in business/law/medicine – 26% business – 17% medicine – 16% law – 5% college+ teaching – 4% journalism/communication – 3% or less: architecture, research, politics, farming, arts, religion, government, at home
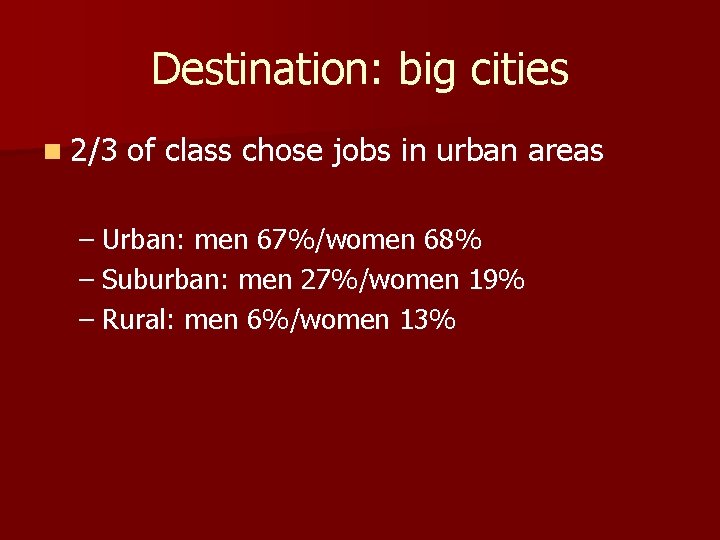
Destination: big cities n 2/3 of class chose jobs in urban areas – Urban: men 67%/women 68% – Suburban: men 27%/women 19% – Rural: men 6%/women 13%
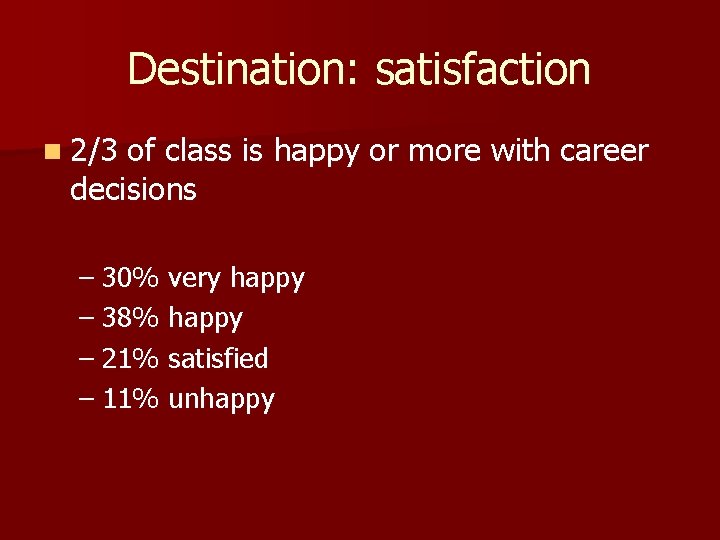
Destination: satisfaction n 2/3 of class is happy or more with career decisions – 30% very happy – 38% happy – 21% satisfied – 11% unhappy
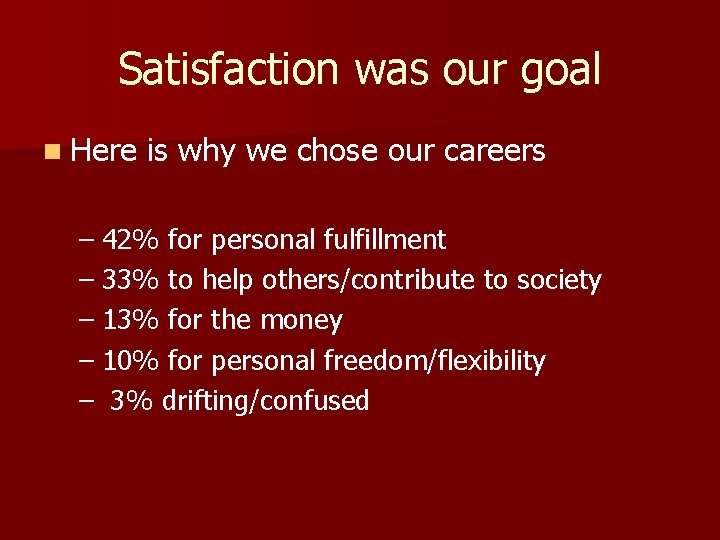
Satisfaction was our goal n Here is why we chose our careers – 42% for personal fulfillment – 33% to help others/contribute to society – 13% for the money – 10% for personal freedom/flexibility – 3% drifting/confused
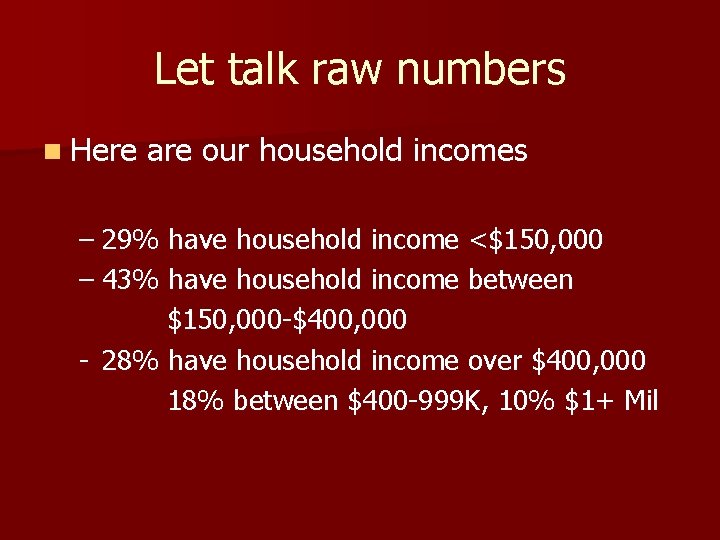
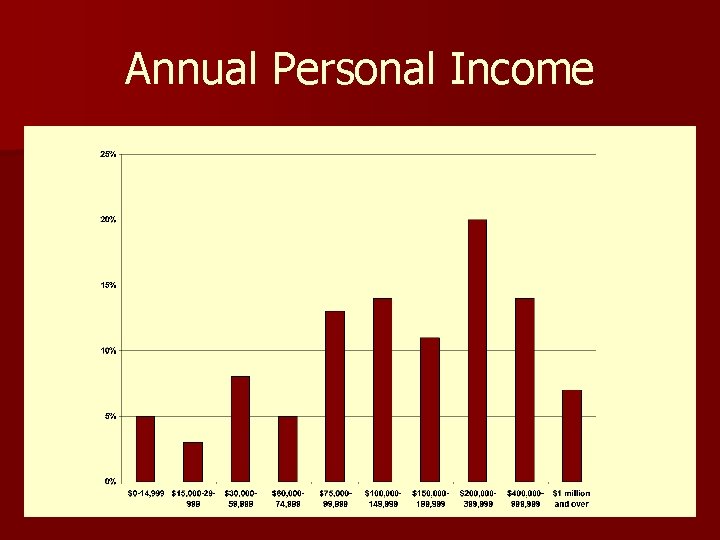
Let talk raw numbers n Here are our household incomes – 29% have household income <$150, 000 – 43% have household income between $150, 000 -$400, 000 - 28% have household income over $400, 000 18% between $400 -999 K, 10% $1+ Mil
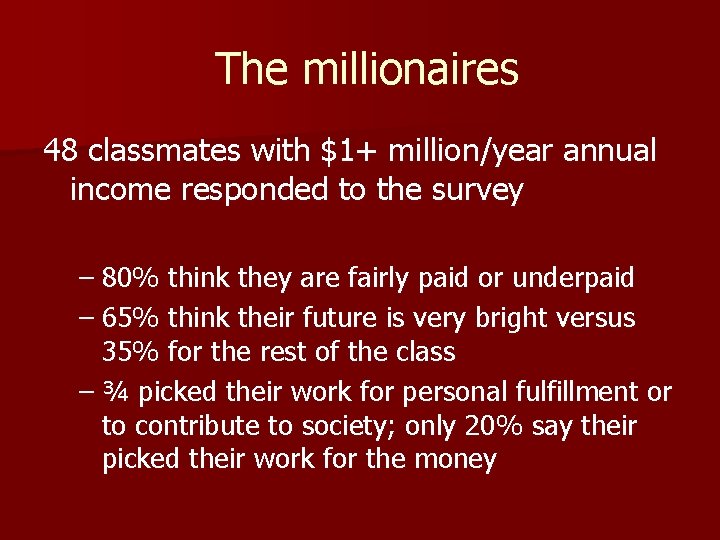
The millionaires 48 classmates with $1+ million/year annual income responded to the survey – 80% think they are fairly paid or underpaid – 65% think their future is very bright versus 35% for the rest of the class – ¾ picked their work for personal fulfillment or to contribute to society; only 20% say their picked their work for the money
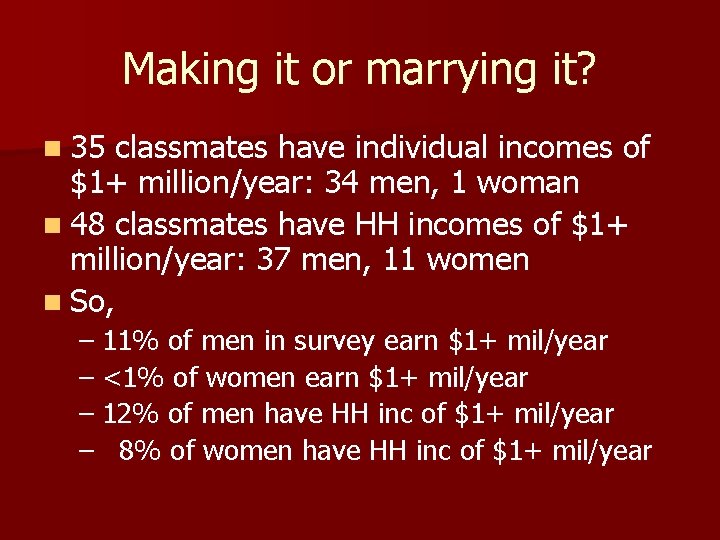
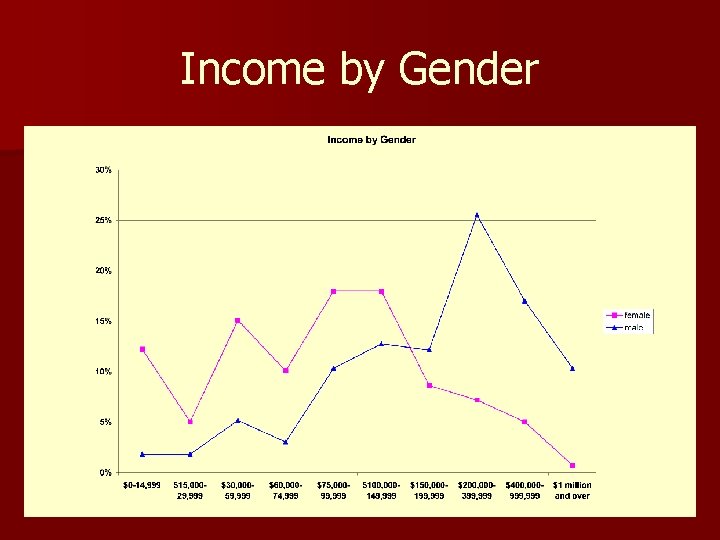
Making it or marrying it? n 35 classmates have individual incomes of $1+ million/year: 34 men, 1 woman n 48 classmates have HH incomes of $1+ million/year: 37 men, 11 women n So, – 11% of men in survey earn $1+ mil/year – <1% of women earn $1+ mil/year – 12% of men have HH inc of $1+ mil/year – 8% of women have HH inc of $1+ mil/year
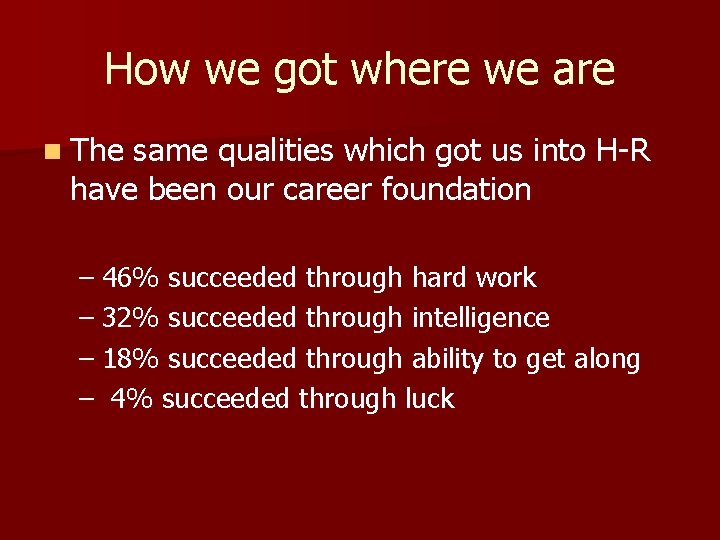
How we got where we are n The same qualities which got us into H-R have been our career foundation – 46% succeeded through hard work – 32% succeeded through intelligence – 18% succeeded through ability to get along – 4% succeeded through luck
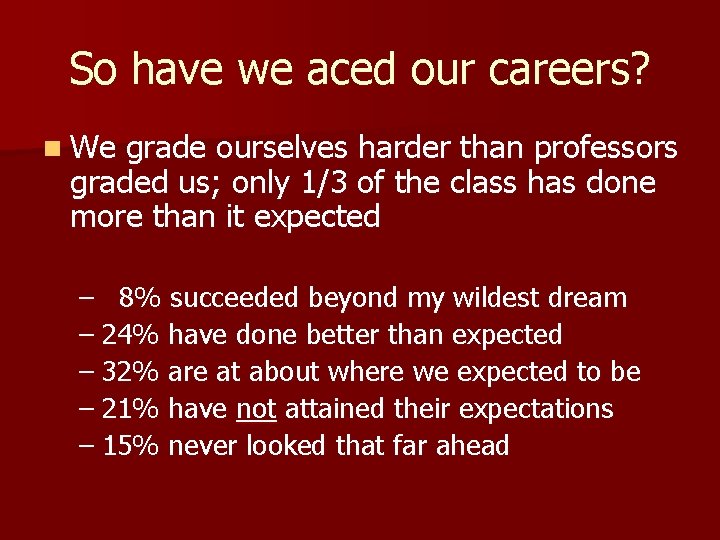
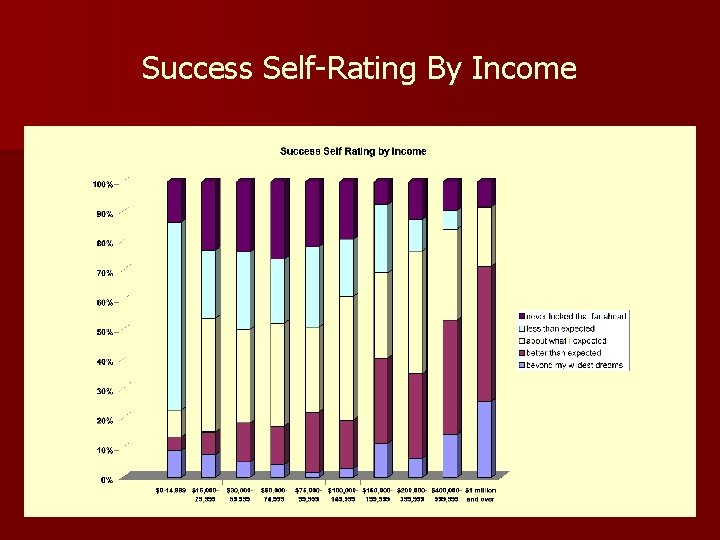
So have we aced our careers? n We grade ourselves harder than professors graded us; only 1/3 of the class has done more than it expected – 8% succeeded beyond my wildest dream – 24% have done better than expected – 32% are at about where we expected to be – 21% have not attained their expectations – 15% never looked that far ahead
Harvard-Radcliffe Class of 1979 Survey Report: Spirituality
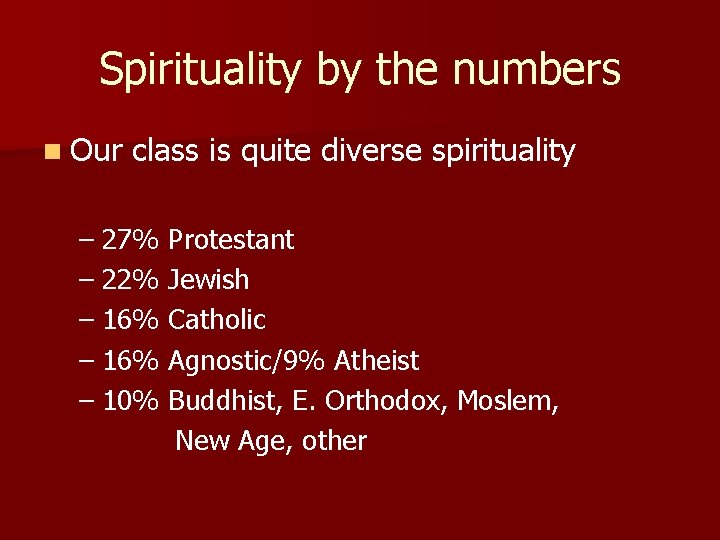
Spirituality by the numbers n Our class is quite diverse spirituality – 27% Protestant – 22% Jewish – 16% Catholic – 16% Agnostic/9% Atheist – 10% Buddhist, E. Orthodox, Moslem, New Age, other
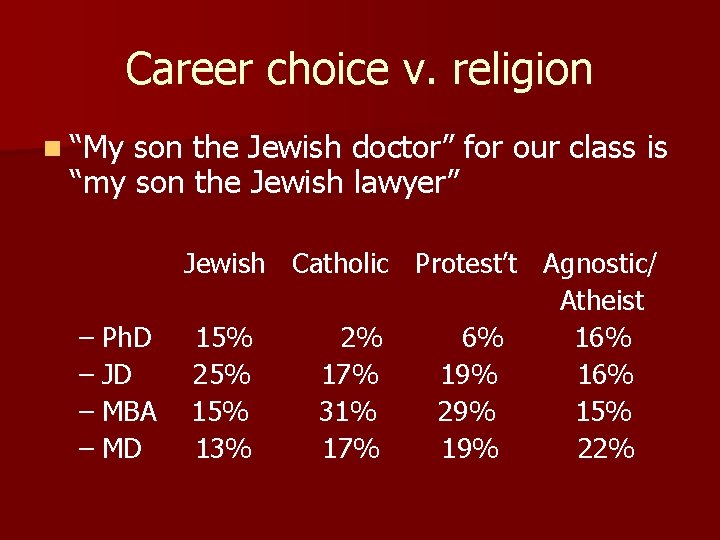
Career choice v. religion n “My son the Jewish doctor” for our class is “my son the Jewish lawyer” Jewish Catholic Protest’t Agnostic/ Atheist – Ph. D 15% 2% 6% 16% – JD 25% 17% 19% 16% – MBA 15% 31% 29% 15% – MD 13% 17% 19% 22%
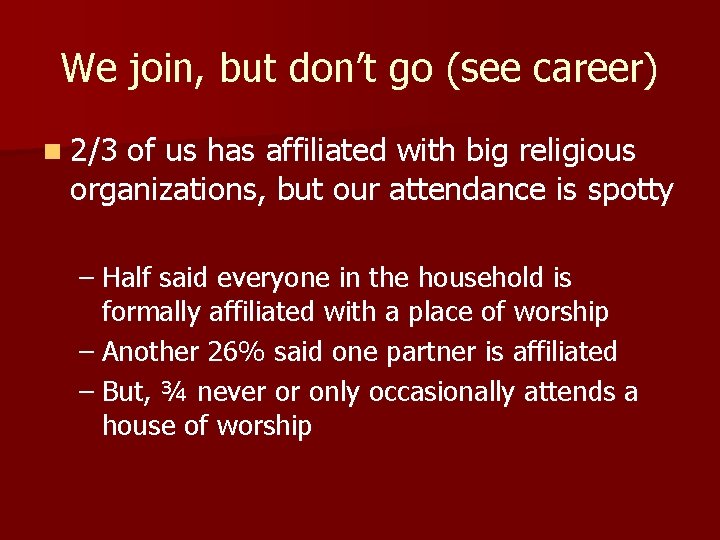
We join, but don’t go (see career) n 2/3 of us has affiliated with big religious organizations, but our attendance is spotty – Half said everyone in the household is formally affiliated with a place of worship – Another 26% said one partner is affiliated – But, ¾ never or only occasionally attends a house of worship
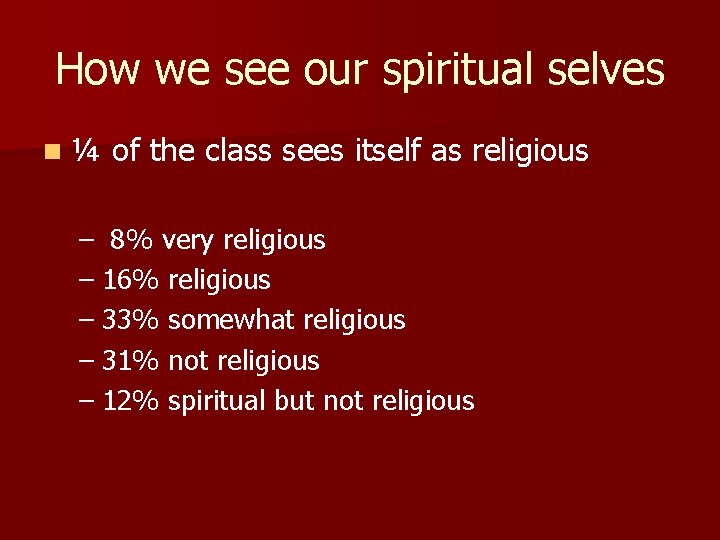
How we see our spiritual selves n¼ of the class sees itself as religious – 8% very religious – 16% religious – 33% somewhat religious – 31% not religious – 12% spiritual but not religious
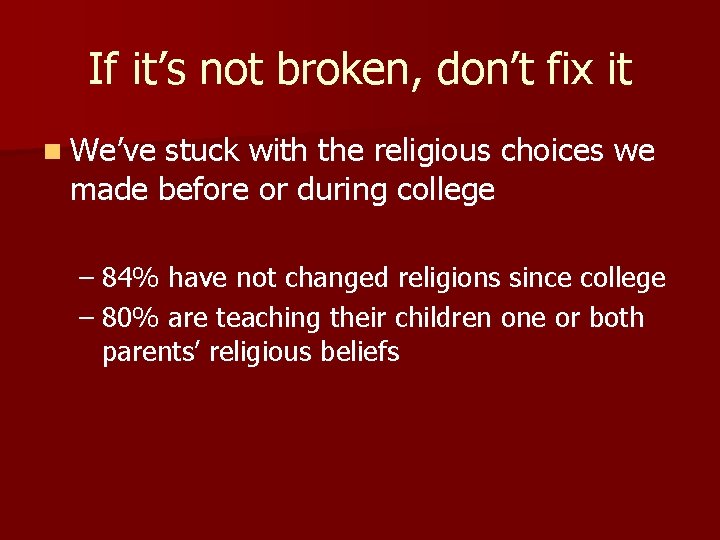
If it’s not broken, don’t fix it n We’ve stuck with the religious choices we made before or during college – 84% have not changed religions since college – 80% are teaching their children one or both parents’ religious beliefs
God and Harvard n 2/3 of us believes in God or Higher Power – 30% believe in God with no doubts – 23% believe in God with some doubts – 15% believe in a Higher Power – 18% don’t believe at all – 14% aren’t sure
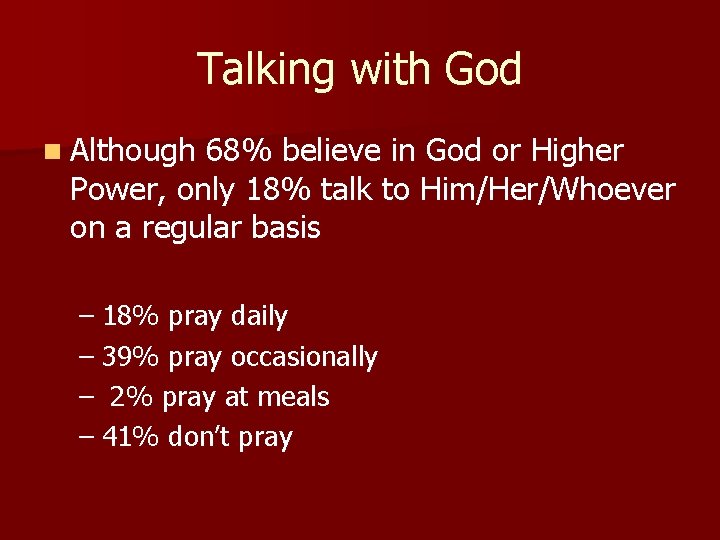
Talking with God n Although 68% believe in God or Higher Power, only 18% talk to Him/Her/Whoever on a regular basis – 18% pray daily – 39% pray occasionally – 2% pray at meals – 41% don’t pray
Harvard-Radcliffe Class of 1979 Survey Report: Money & Sex (not necessarily in that order)
Annual Personal Income
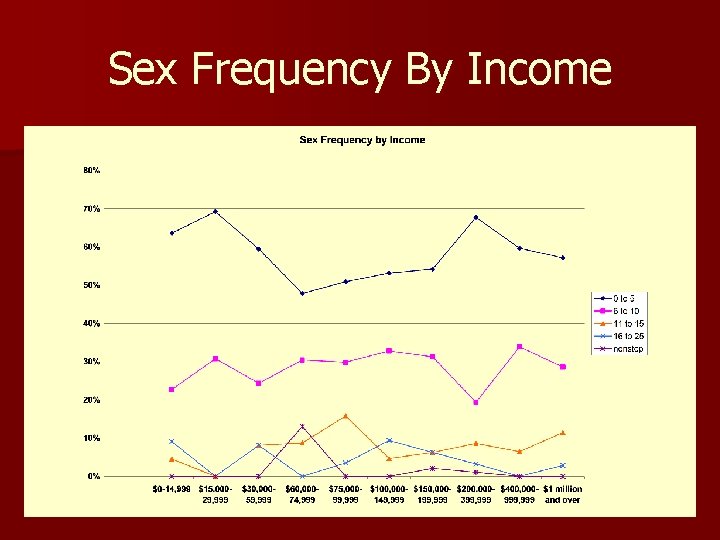
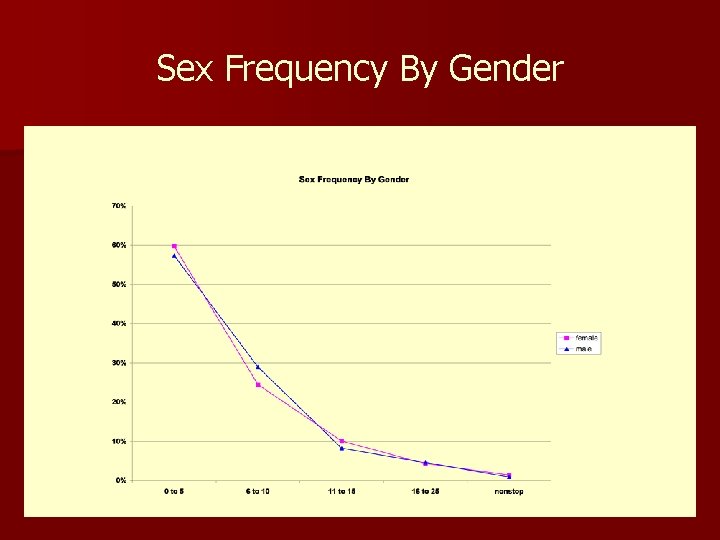
How many times per month do you have sex?
Sex Frequency By Income
Income by Gender
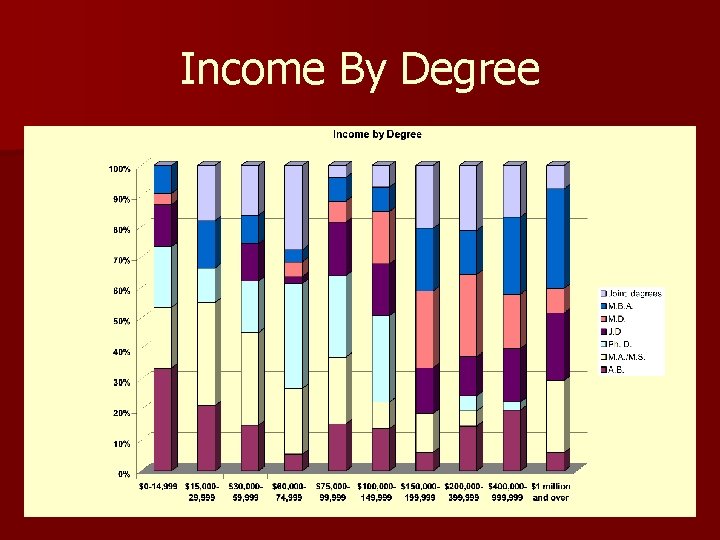
Income By Degree
Income By Times Fired
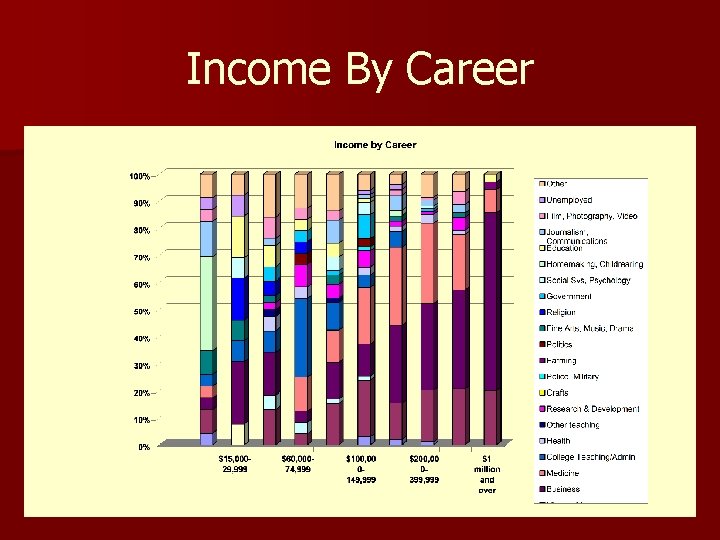
Income By Career
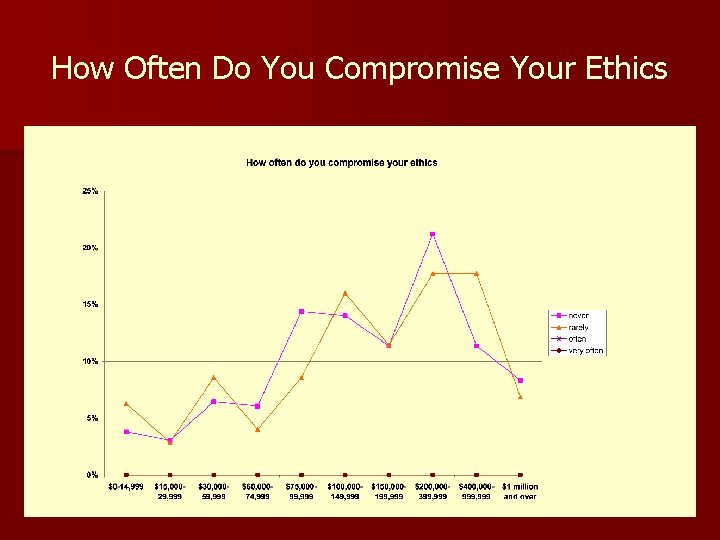
How Often Do You Compromise Your Ethics
Success Self-Rating By Income
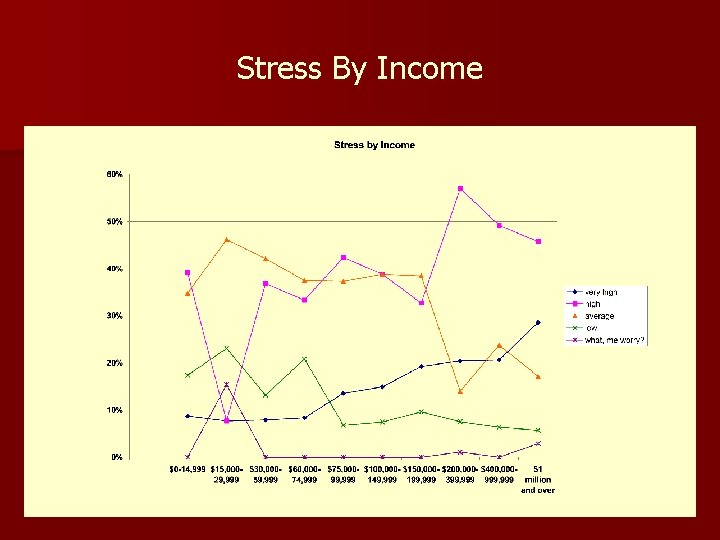
Stress By Income
Sought Pysch Counsel by Income
Happiness By Income
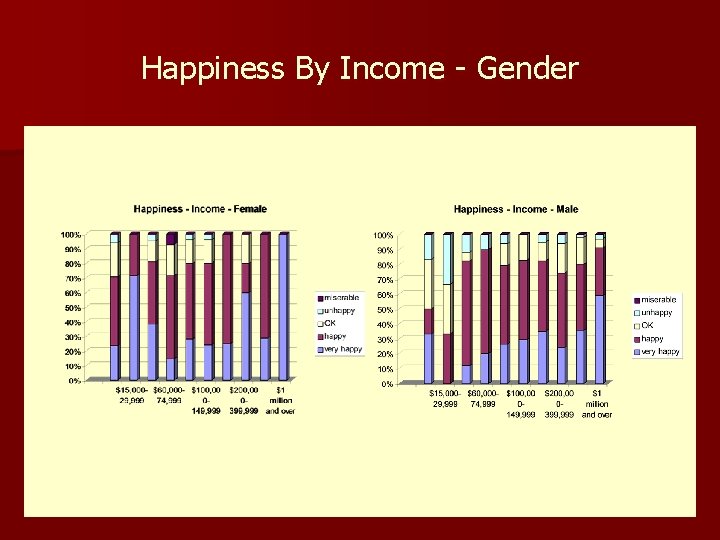
Happiness By Income - Gender
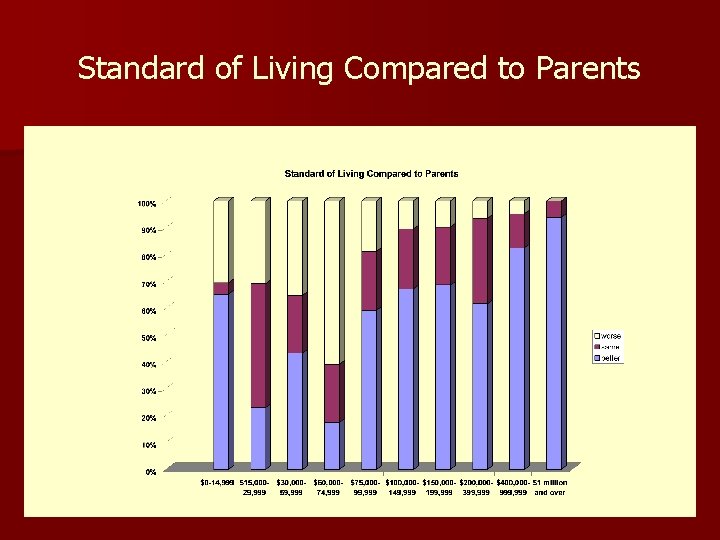
Standard of Living Compared to Parents
Sexual Orientation by Gender
Sex Frequency By Gender
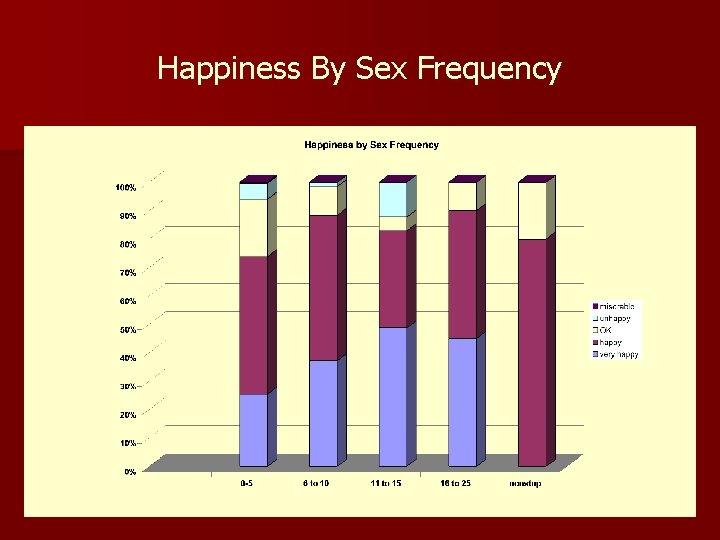
Happiness By Sex Frequency
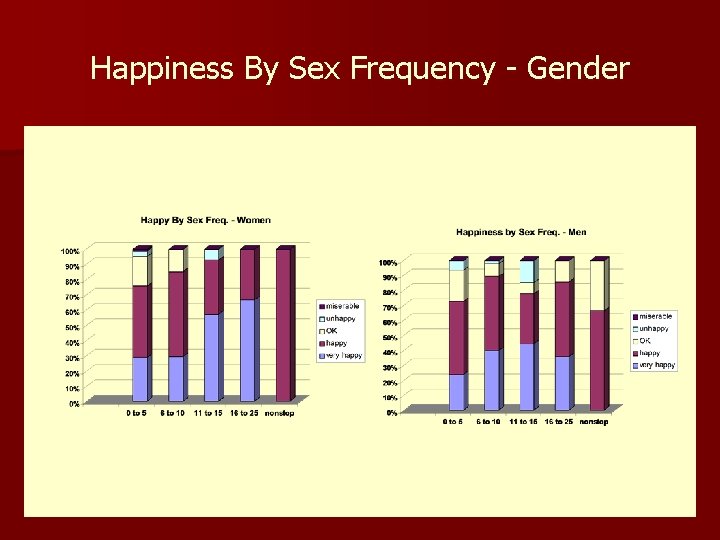
Happiness By Sex Frequency - Gender
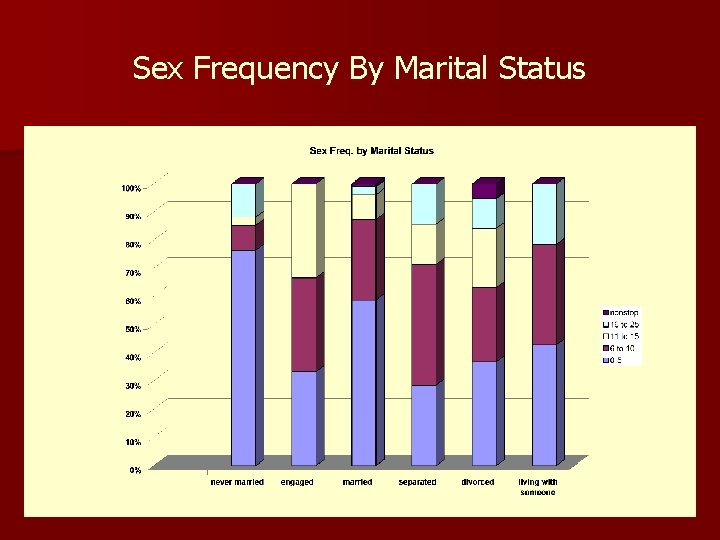
Sex Frequency By Marital Status
Kid’s Effect On Sex Life By Gender
Sex Frequency – Classmate as Spouse
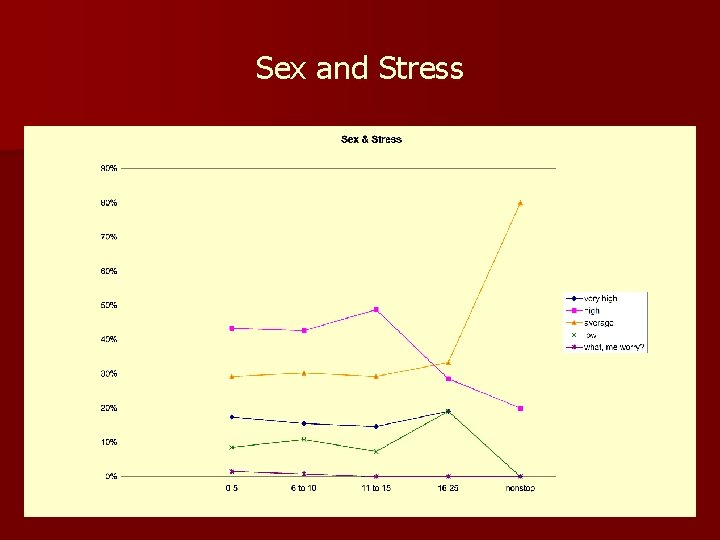
Sex and Stress
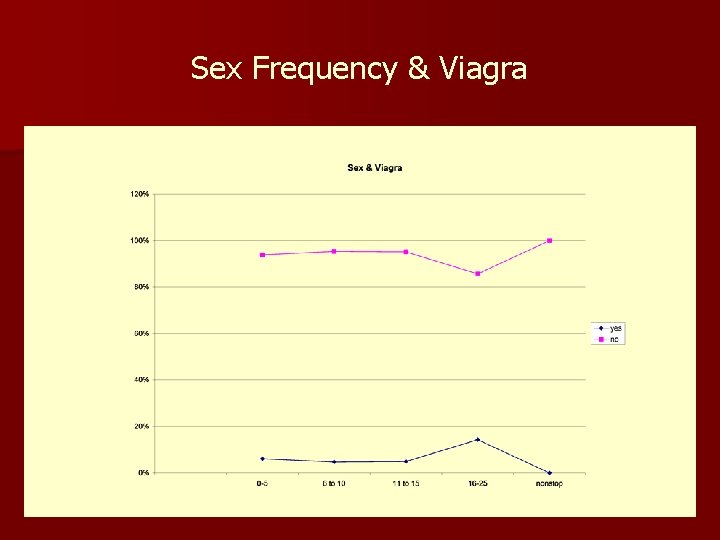
Sex Frequency & Viagra
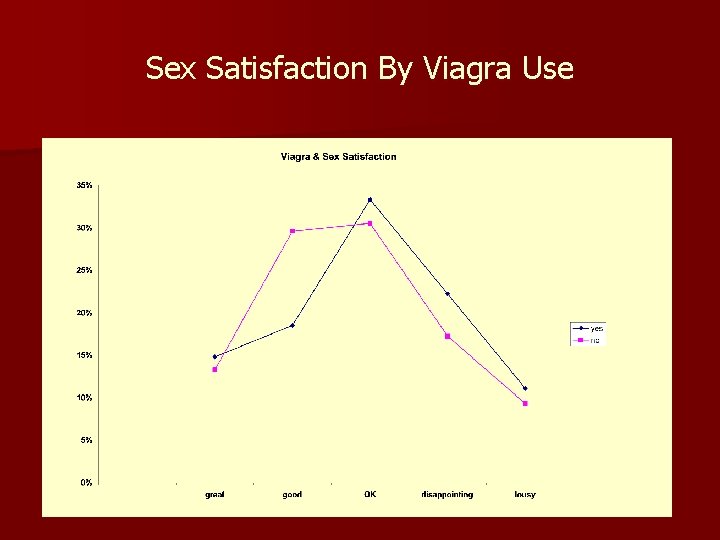
Sex Satisfaction By Viagra Use
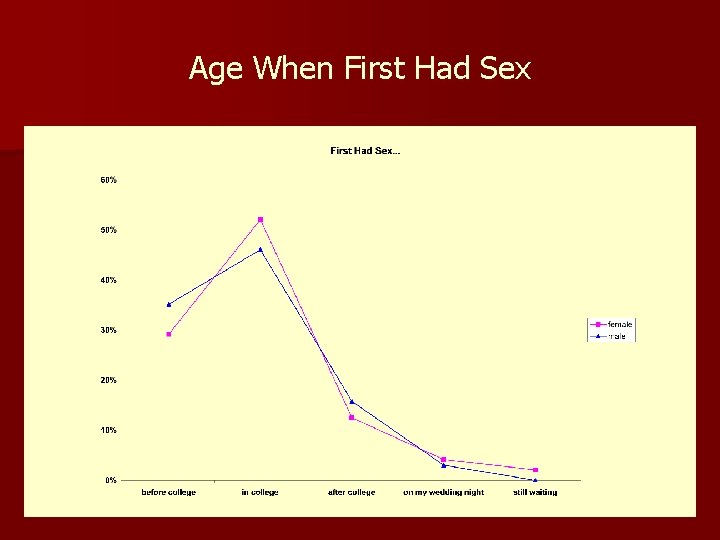
Age When First Had Sex
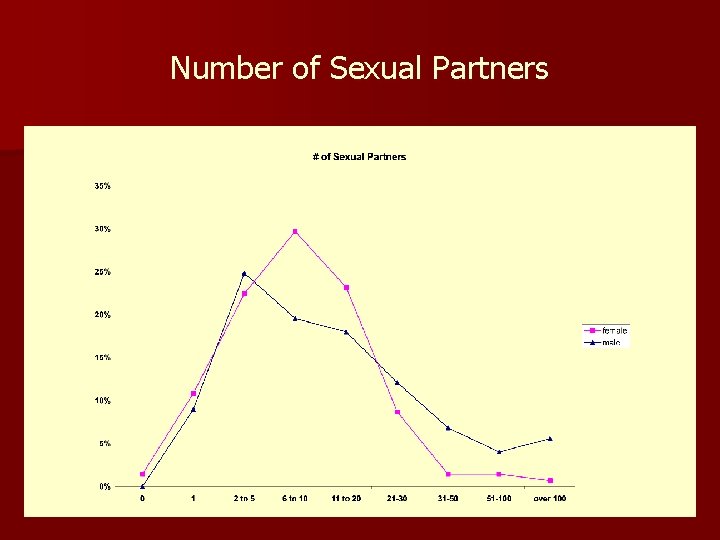
Number of Sexual Partners
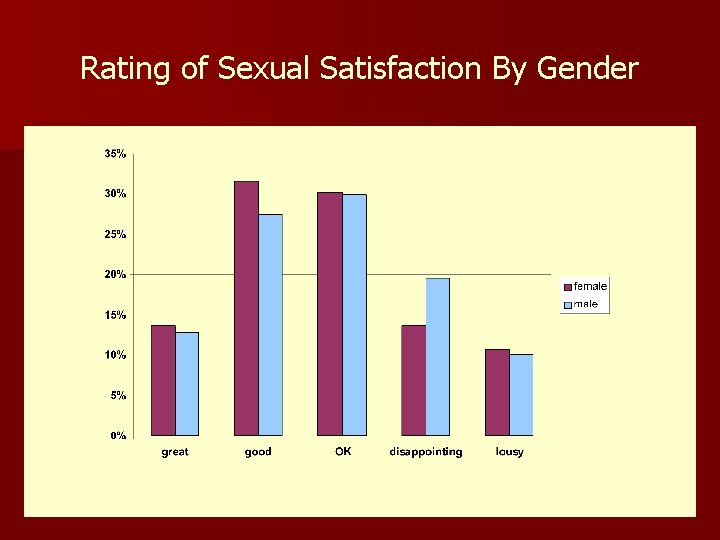
Rating of Sexual Satisfaction By Gender
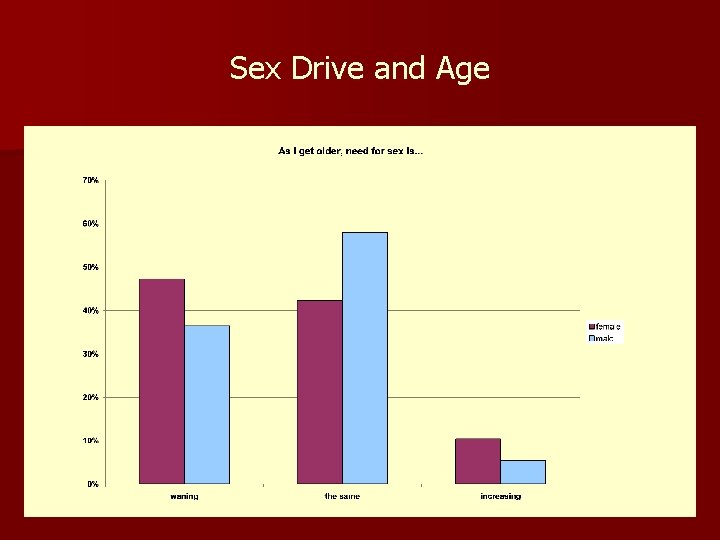
Sex Drive and Age
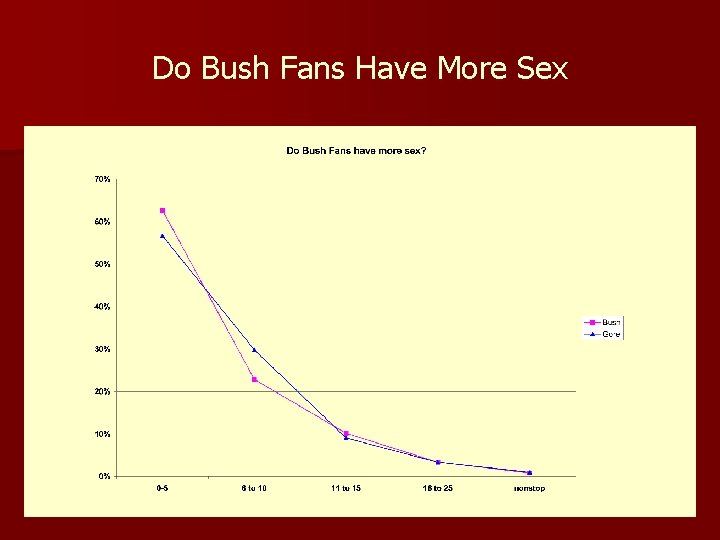
Do Bush Fans Have More Sex
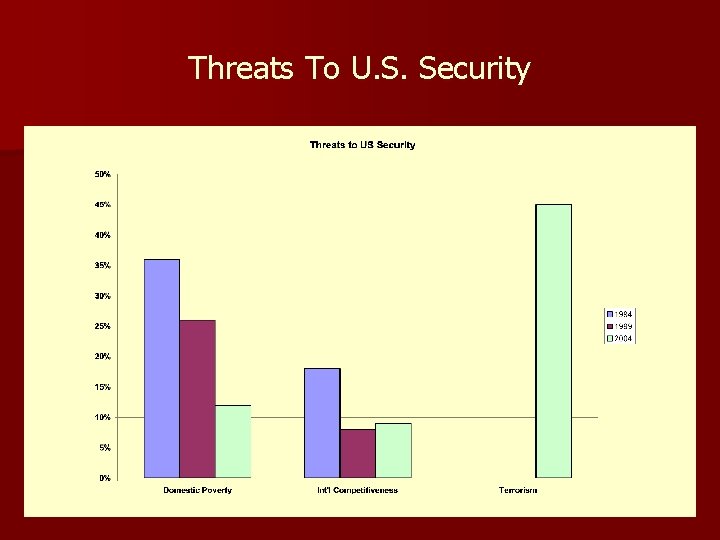
Threats To U. S. Security
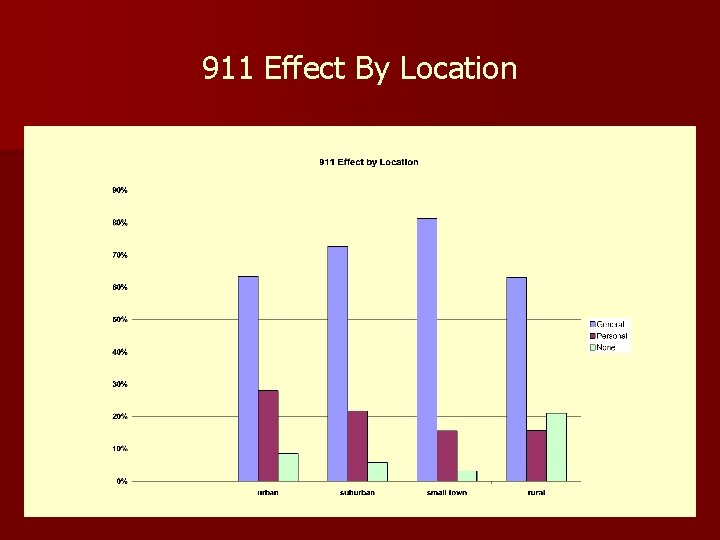
911 Effect By Location
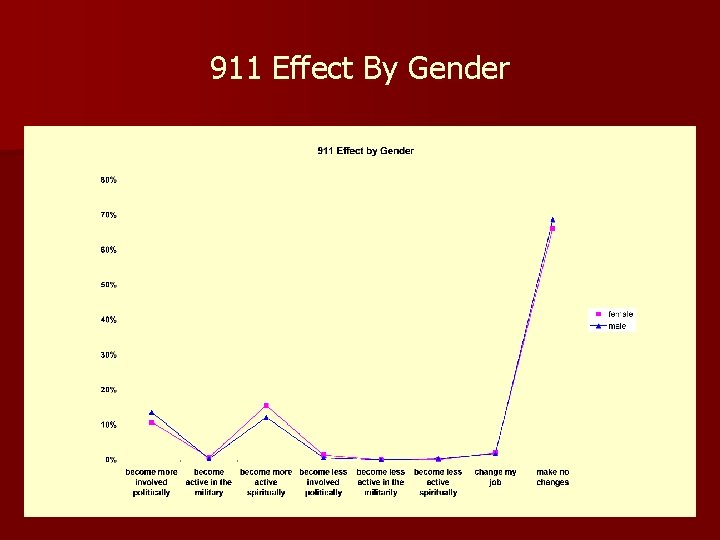
911 Effect By Gender
Harvard-Radcliffe Class of 1979 Survey Report: Politics
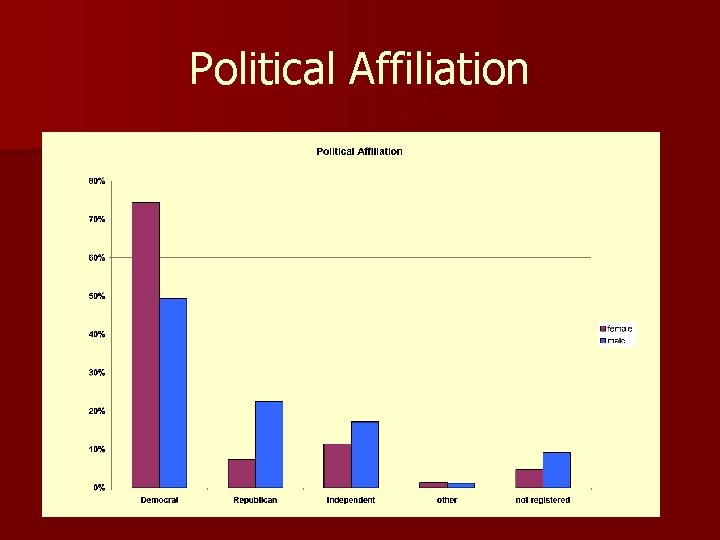
Political Affiliation
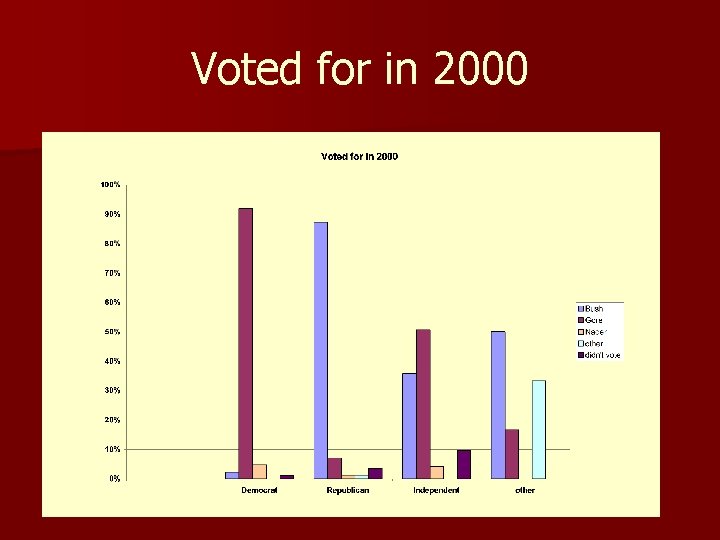
Voted for in 2000
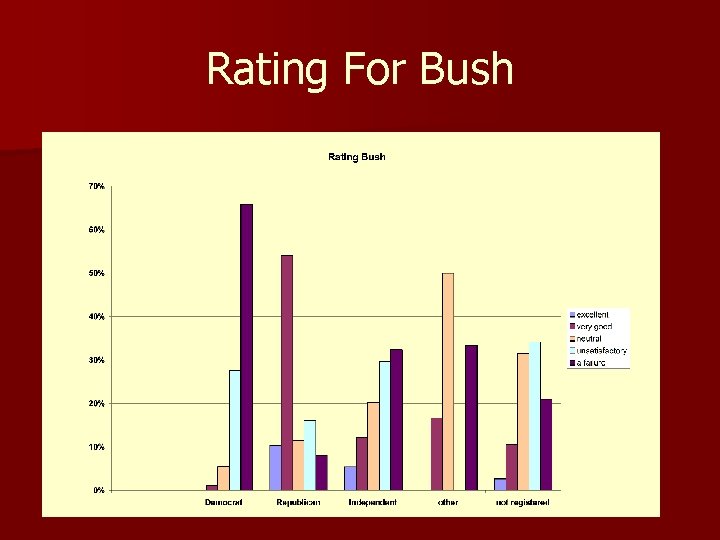
Rating For Bush
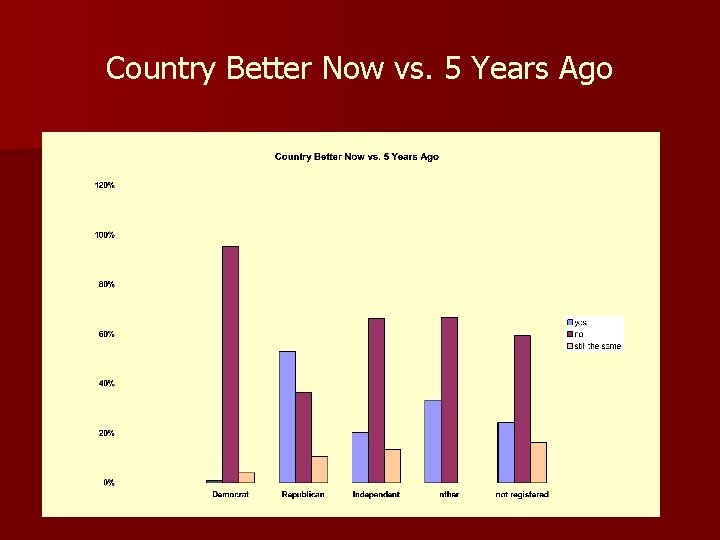
Country Better Now vs. 5 Years Ago
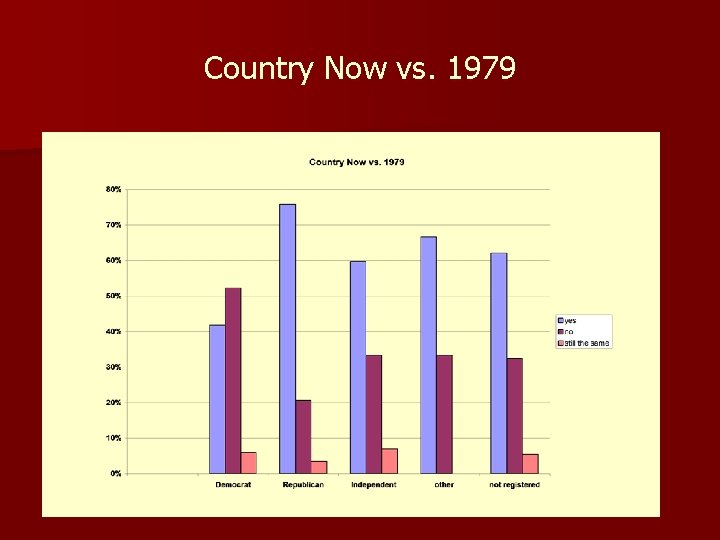
Country Now vs. 1979
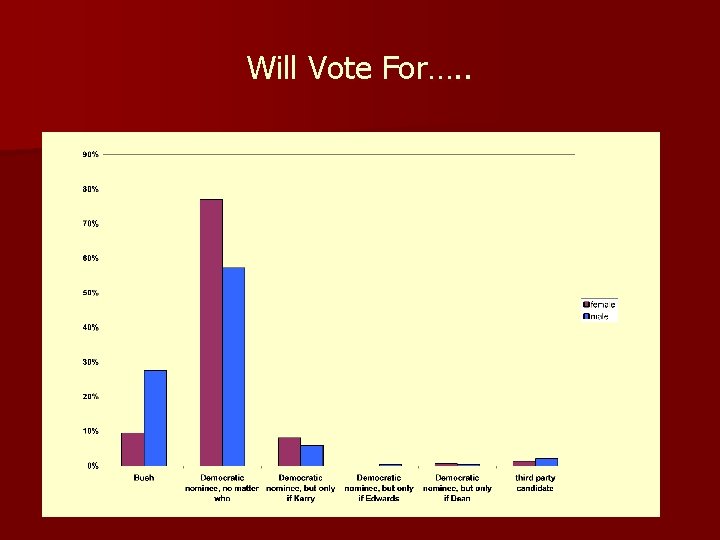
Will Vote For…. .
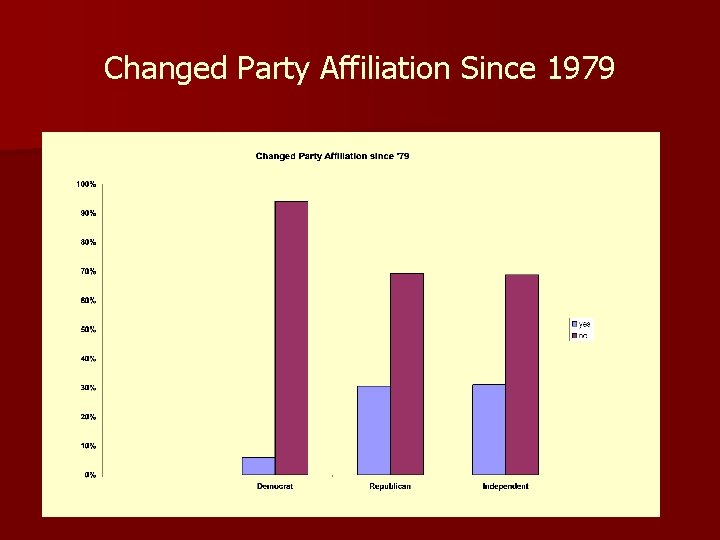
Changed Party Affiliation Since 1979