When We Say ValueBased Care or ValueBased Payment
")
When We Say Value-Based Care or Value-Based Payment…… What is Value? (September 21, 2019) Timothy W. Attebery, DSc, MBA, FACHE Chief Executive Officer American College of Cardiology and Med. Axiom

Disclosures • Nothing to disclose

Presentation Outline: 5 Parts 1. ACC Update 2. Background: U. S. Healthcare Problem 3. What is Value? 4. Avoidable Costs 5. Value-Based Reimbursement

The 2019 -2023 Strategic Plan describes the College’s Destination. HOW do we get there? Explore the Frontier, Protect the Core Explore the Frontier Protect the Core CONFIDENTIAL FOR ACC/ ACCF USE ONLY As we Explore the Frontier to build new, innovative, and diverse means of serving members & customers, improving patient outcomes, and securing our financial future, we must Protect the Core of our enterprise—our brand, our relationships, plus a suite of successful, impactful, market-valued solutions/services built and maintained by a team nurtured by a culture of wellbeing. 5

“ 4 X 4” ACC Matrix for Strategic Execution 4 Strategic Goals What We Must Accomplish by 2023 Health System Strategy Urgency Agility Innovation 4 C Or ultu ga niz ral Emerging Markets s e v i t a r ght e p t Ri m I e G c i t g Mus e t a We r t t S Digital Transformation Att r al Pe ibu rso t na es lity 4 ati on CONFIDENTIAL FOR ACC/ ACCF USE ONLY Collaboration Member of the Future a Wh 6

The Problem

eff y ec uit tive eq ne ss Iron Triangle: created by William Kissick, 1994. Increasing or emphasizing one factor could create or cause a decrease in one or both of the remaining factors. Example: efforts to cut costs could reduce quality and/or access efficiency

9 U. S. Health Care and the Federal Budget

PER CAPITA HEALTHCARE SPENDING FOR 2018
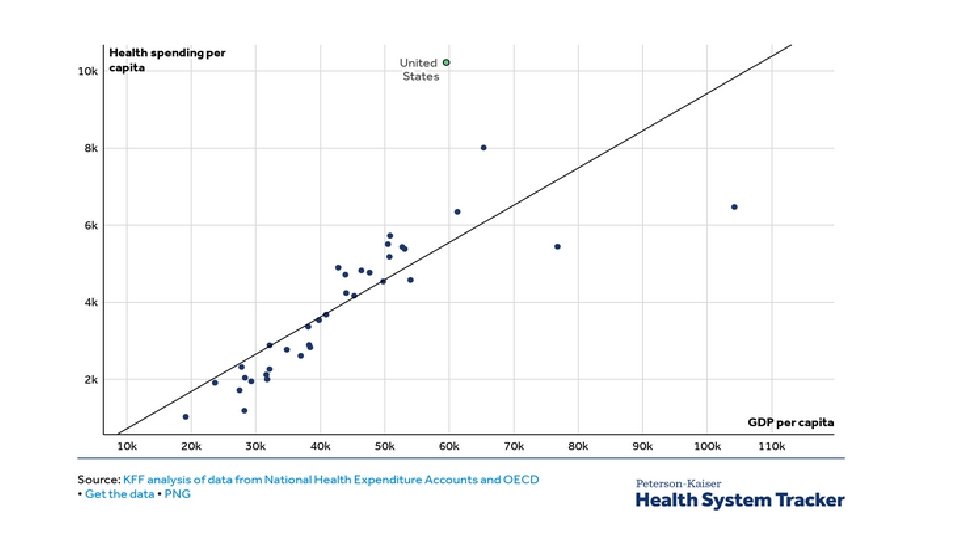


Why? Utilization? Price? Both?

Why Overall Spending is Higher

State of CVD Services in the U. S.

• Cardiology accounts for nearly 20% of spending throughout the entire health care system • Cardiology accounts for 30% of Medicare spending Ojeifo O and Berkowitz SA Circ Qual Outcomes 2015

CVD Environment • • • 17 120+ million Americans; #1 disease state and COD #1 cost (20%+ of overall healthcare spending) Top profit generator for most health systems Largest payer (Medicare) is seven years away from insolvency Significant disparities/inequities in care delivery; under-represented groups in CVD $500 B annual economic impact from CVD (direct and indirect costs to society); projected to exceed $1 trillion in 15 -18 years 30% “avoidable” costs (waste, duplication, coordination, etc. ) Who will lead? How to remove some of the avoidable costs? How to develop a more efficient system of CVD care?

Fragmentation Of Care Primary Care In-patient & Out-patient Hospital Specialty Care Home Health Lack of Communication and Appropriate Follow-up Diagnostic Errors Hospice Post-acute Care Hospital Readmission Adverse Drug Events

Michael Chernew, Ph. D – What will slow spending growth? • • • Payment reform Benefit design (and other consumer oriented strategies) Competition and managed care Organization of medical practice Wellness, prevention, nutrition, etc.

What is Value?

Value Definitions & Equations “Price is what you pay, value is what you get. ” –Warren Buffet “Health outcomes achieved per dollar spent. ” –Michael Porter, Ph. D
: the external value or overall outcome (utility)")
Two Value Perspectives • Value Generated (VG): the external value or overall outcome (utility) created for patients, purchasers/payers, and society by the services rendered or work performed. This can be stated in economic and non-economic terms. Sometimes referred to as “Consumer Welfare”. • Value Captured (VC): the internal value received, in the form of direct or indirect monetary compensation, for the VG generated. • Customers want VG>VC. • Service providers want VC>VG. • Currently, what do patients, purchasers/payers, and the public perceive about healthcare value?
 VC")
Variables • • VG = Value Generated (created for external stakeholders & society) VC = Value Captured (captured for the organization & yourself) O Q = Quality (EBM, AUC, and clinical outcome) U S = Safety (avoidable complications, infections, falls, etc. ) T C PRO = Patient reported outcomes including perception of service delivery O (HCAHPS) M E A/E = Access & Equity Ce = External Cost (a/k/a “price paid” or “P”) Ce = P Ci = Internal Cost (what it costs the HC organization to deliver a service)
 • In general, VC is a derivative of VG (to increase")
VC = ƒ(VG) • In general, VC is a derivative of VG (to increase VC, you need to increase VG) • An individual’s economic VC (their compensation) is a function of their VG and their personal efforts to help their organization increase VC • An organization’s VC (reimbursement, total revenue) is primarily a function of VG by that organization

For Healthcare Providers • VG is recognized in accounting terms as Revenue (for NFPs, add Community Benefit) • Gross Revenue = the total value of services rendered using the gross charge for each service • Net Revenue = the expected payments from the Gross Revenue
 = Outcomes divided by")
Healthcare Value Equation VG = O/P Value Generated (for society) = Outcomes divided by the Payment for the service rendered

What About the Time Element? • Is VG measured only at one point in time? • Increasingly, healthcare providers are being evaluated by their ability to manage a patient or condition over time (30 day readmission, 90 -day bundle) • OUTCOME involves a time window

Think of P in Broader Terms • P for a certain episode (e. g. , one admission or procedure): DRG, CPT, APC, etc. • P for the “total expenditures incurred” in connection with one episode (e. g. , 90 -day period following a CABG or PCI) • P for the “total cost of managing a certain population of patients”
 is a value generator •")
But Wait, What About Risks • Taking risk (indemnification) is a value generator • Economic utility of managing and reducing uncertainty (probability of having a loss) • “Risk Premium” – amount above the “expected loss” that someone is willing to pay to have insurance • Who takes the risk for the efficiency of CV care with a health system? • Who takes the risk for the total cost of CV care in the U. S. ? • What’s the economic value of taking risks?

The Value of Taking Risk • Offloading risk requires $$ • “I don’t want to assume the risk that the CVSL will achieve a certain operating margin this year” • “I don’t want to assume the risk that the total cost of an episode of CV care will be less than the bundled payment” • When you don’t take economic risk, then you’re “paying” someone else to do so • Fear of loss is a greater motivator than the hope for gain
 * R R = Risk Assumed, a")
Value Generated with Risk VG = (O/P) * R R = Risk Assumed, a Risk Premium $ is paid in exchange for taking the risk
 • • SR = Service Rendered GR = SR X")
VC Equation (pure FFS) • • SR = Service Rendered GR = SR X Gross Charge for that service NR = GR X CR (Collection Rate) Profit = NR – OE (Operating Expenses) OE = ƒ((SR) X EF (Efficiency Factor)) Personal Comp (personal VC) = ƒ(w. RVUs) (prevailing measure) Since the per w. RVU Conversation Factor is not adjusted based upon NR/CR/OE/Profit, there is no Risk Premium value included

Personal Compensation • Production-based: w. RVUs X Conversion Factor • Performance-based: some % of comp pool withheld or set-aside to be “earned” by performance (quality/safety, projects, efficiency, etc. ) • Who is paying the compensation? • They assume the risk for billing & collection, capital expenditures, managed care contracting, management, operating expenses, etc.
 • SR = Service Rendered (in connection with the episode) •")
VC Equation (Risk-Based) • SR = Service Rendered (in connection with the episode) • NR = Fixed Payment for the Episode (Risk Premium loaded within the NR) • Profit = NR – OE (all costs incurred associated with the episode and time window) • OE = ƒ((SR) X EF (Efficiency Factor)) • Personal VC = ƒ(Excess Revenue over OE)
 Fixed expenses/resources Throughput")
Efficiency Factor • • Input pricing Resources consumed Variable expenses/resources (consumption/utilization) Fixed expenses/resources Throughput (productivity) Rework Amount of “waste” in the system Avoidable variation (standardization)
 • DECREASE P")
Basic Ways to Increase VG • DECREASE UTILIZATION: (decrease overall payments) • DECREASE P (Ce): charge or accept a lower price (NOTE: requires a reduction in Ci; otherwise margins decline) • IMPROVE OUTCOMES (quality, safety, patient reported outcomes, access, equity) • TAKE MORE RISKS

Increase Internal VC • Decrease Ci (decrease OE; variable costs, fixed costs, indirect costs, etc. ); this involves efforts to increase efficiency (workflows, process improvement, etc. ) • Increase SR (more productivity, better coding & documentation) • Optimize capacity (division of labor, new workflows, move lower margin or negative margin episodes/services out of the hospital or ambulatory facility and replace with higher margin services) • Increase NR and CR (documentation, coding, and optimize capacity) • Lead and support efforts to improve OUTCOMES • Take accountability and share the risk • Any combination of these options

Avoidable Costs: Waste and Inefficiencies in Healthcare
 • New England Health Institute (NEHI): “healthcare spending that can be")
Avoidable Costs (“waste”) • New England Health Institute (NEHI): “healthcare spending that can be eliminated without reducing quality of care. ” • Misuse, overuse, underuse • Unwarranted or unexplained variation in care
 Thomson Reuters")
It’s the Cost, Stupid – Avoidable NHE • • • NEHI (2008) Thomson Reuters (2009) Berwick & Hackbarth (2011) Avoidable inpatient admissions Center for Health Info. & Analysis IMS Institute (2013) (a) Limited to avoidable readmissions (b) Limited to prescription drugs; hypercholesterolemia & diabetes have the biggest impact $680 B $700 B $500 B-$1 T $140 B $17 Ba $213 Bb

Eight Categories of Waste & Avoidable Costs 1. 2. 3. 4. 5. 6. 7. 8. Administrative system inefficiencies Provider inefficiencies and errors (including unnecessary variations in care delivery) Lack of care coordination Unwarranted use Preventable conditions and avoidable care Fraud & abuse Increased disease due to modifiable behaviors High prices

Value-Based Care & Value-Based Payment a/k/a risk-based reimbursement, outcomes-based reimbursement, pay-for-value, pay-for-performance, fee-forvalue

Definitions • A care delivery model in which clinicians and hospitals are paid based upon outcomes. • Rewards clinicians for helping patients improve their health, reduce the effects and incidence of chronic disease, and live healthier lives. • Rewards clinicians for reducing costs (i. e. , increase efficiency, remove the avoidable costs). • Linking payments to improved performance; holding providers accountable for both the cost and outcomes of the care provided. New England Journal of Medicine Health Catalyst, January, 2017; Healthcare. gov definition of value-based purchasing

U. S. Value-based Payment Model Framework Category 1 Category 2 Category 3 Category 4 Fee for Service – No Link to Quality & Value Fee for Service – Link to Quality & Value Alternative Payment Models Built on Fee-for-Service Architecture Population-Based Payment A A A Foundational Payments for Infrastructure & Operations Alternative Payment Models with Upside Only Gainsharing Condition-Specific Population-Based Payment Pay for Reporting B C Alternative Payment Models with Upside Gainsharing and Downside Risk Comprehensive Population-Based Payment B Rewards for Performance B D Rewards and Penalties for Performance 44

Hospital Bundles/Episodes of Care Episodes: • Acute myocardial infarction • • Congestive heart failure • • Cardiac arrhythmia • • Cardiac defibrillator • • Cardiac valve • • Pacemaker • Percutaneous coronary intervention • Coronary artery bypass graft surgery • Transcatheter Aortic Valve Replacement (TAVR) 90 -day episodes Total cost of care Risk-adjusted target price Quality performance measures Shared savings with clinicians

Global Progress to Outcome-based Payment Although payment systems differ, the pressure to lower costs and improve outcomes is universal. 0 = No efforts toward bundled payments (mainly FFS) 1= Capitation system is used by one or more major payers 2 = National/regional initiative to develop bundled payment system 3 = Bundled payment system implemented by one or more major payers Value-based Healthcare: A Global Assessment, Commissioned by Medtronic. The Economist, 2016. http: //vbhcglobalassessment. eiu. com/

The International Move to Value Counte MA, Howard SW, Chang L, Aaronson W. Global Advances in Value-Based Payment and Their Implications for Global Health Management Education, Development, and Practice. Front Public Health. 2019; 6: 379. Published 2019 Jan 18. doi: 10. 3389/fpubh. 2018. 00379
 clinician and clinical manager (quality/safety, risk manager, care coordination),")
Physician Roles • Primary: (a) clinician and clinical manager (quality/safety, risk manager, care coordination), and (b) resource/cost manager (money manager) • Secondary: (a) patient experience manager (relationship, quality of life, intangibles), and (b) information/data manager • Tertiary: (a) team leader (getting the most from the other team members), (b) quality improvement and operations manager (performance & process improvement), and (c) organizational leader and change agent • Value generator: for patients, for the organization, for society • Value capturer: individually and for the organization

THANKS!
- Slides: 49