
Whats Happening Out There Greater New Orleans Business

What’s Happening “Out There? ” Greater New Orleans Business Roundtable March 2015 Vincent Di. Vita
Agenda 1 Objectives and Ground Rules 2 A Recap – until October 2014 3 And What Does it Mean? - Methane - Ethane - Propane - Refining 4 slide 2 Impact of Oil Price Drop
Objectives and Ground Rules • Objectives – To provide background regarding the “building boom” in petrochemicals (prices, demands, market & global forces) – To discuss some trends and actual projects that we see in the market – To discuss $50 -60/B Oil impact • Ground Rules – Public Information Only slide 3
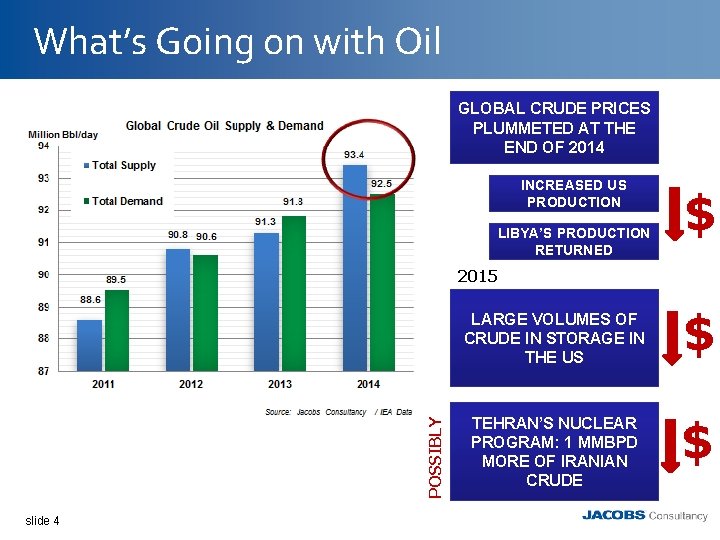
What’s Going on with Oil GLOBAL CRUDE PRICES PLUMMETED AT THE END OF 2014 INCREASED US PRODUCTION LIBYA’S PRODUCTION RETURNED $ 2015 POSSIBLY LARGE VOLUMES OF CRUDE IN STORAGE IN THE US slide 4 TEHRAN’S NUCLEAR PROGRAM: 1 MMBPD MORE OF IRANIAN CRUDE $ $
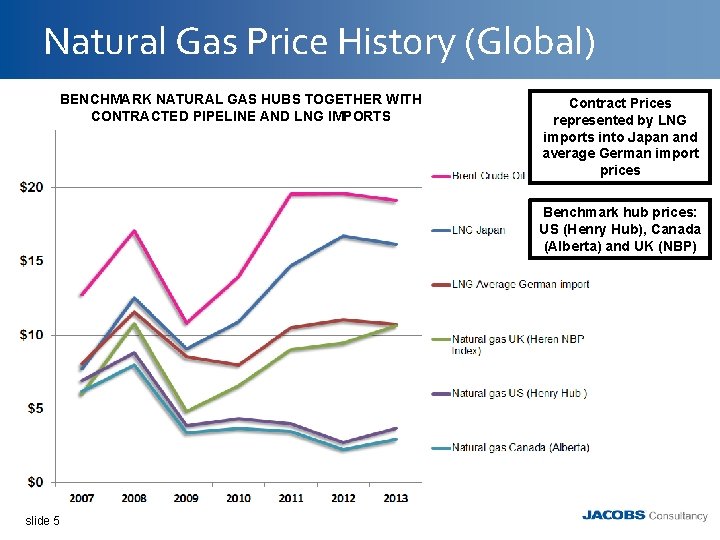
Natural Gas Price History (Global) BENCHMARK NATURAL GAS HUBS TOGETHER WITH CONTRACTED PIPELINE AND LNG IMPORTS Contract Prices represented by LNG imports into Japan and average German import prices Benchmark hub prices: US (Henry Hub), Canada (Alberta) and UK (NBP) slide 5
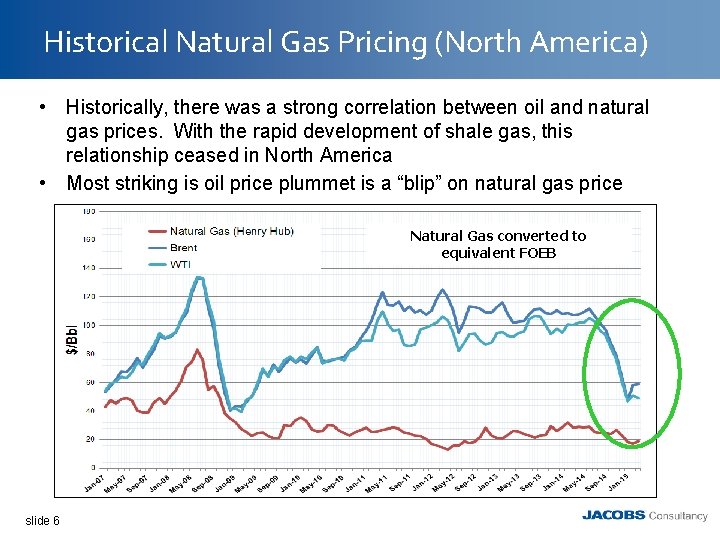
Historical Natural Gas Pricing (North America) • Historically, there was a strong correlation between oil and natural gas prices. With the rapid development of shale gas, this relationship ceased in North America • Most striking is oil price plummet is a “blip” on natural gas price Natural Gas converted to equivalent FOEB slide 6
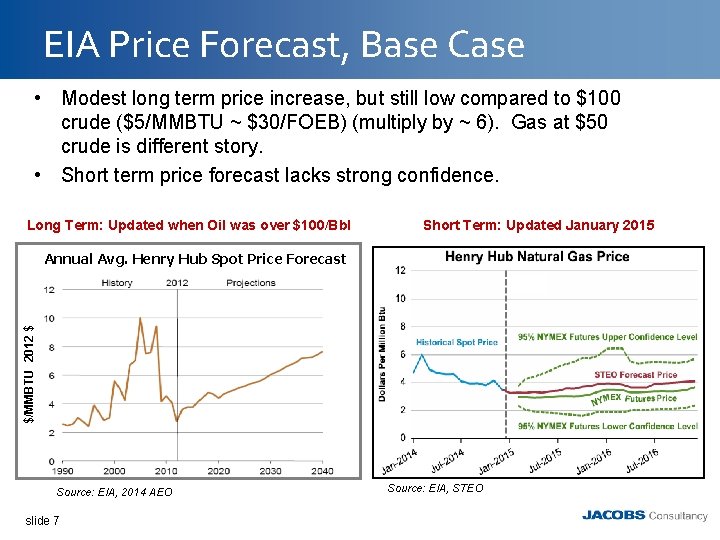
EIA Price Forecast, Base Case • Modest long term price increase, but still low compared to $100 crude ($5/MMBTU ~ $30/FOEB) (multiply by ~ 6). Gas at $50 crude is different story. • Short term price forecast lacks strong confidence. Long Term: Updated when Oil was over $100/Bbl Short Term: Updated January 2015 $/MMBTU 2012 $ Annual Avg. Henry Hub Spot Price Forecast Source: EIA, 2014 AEO slide 7 Source: EIA, STEO
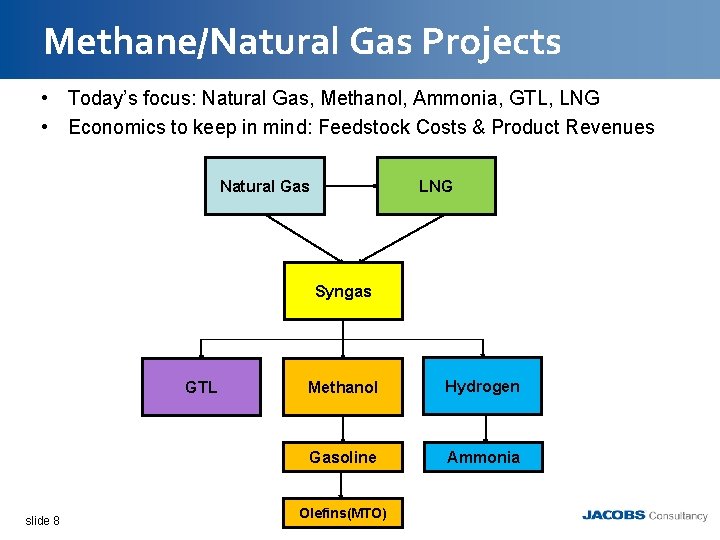
Methane/Natural Gas Projects • Today’s focus: Natural Gas, Methanol, Ammonia, GTL, LNG • Economics to keep in mind: Feedstock Costs & Product Revenues Natural Gas LNG Syngas GTL slide 8 Methanol Hydrogen Gasoline Ammonia Olefins(MTO)
US Market - Methanol • US Demand in 2013 was about 7 MMTPA. • About 5 MMTPA was imported. • The plants that are clearly underway (Celanese, Methanex relocations and expansions) will replace much of the import. • Room for one more before we become net exporter. slide 9
Methanol Market Situation Global • Global Market Demand is about 60 MMTPA. • Global Capacity is about 100 MMTPA, but about 40 MMTPA is coal based in China, mostly shut down. China • Chinese strategy is diversification of supply & weaning off coal • The Chinese plants are to export methanol to China to make plastic and fuel. Some have “issues”, but one or two may get built. slide 10
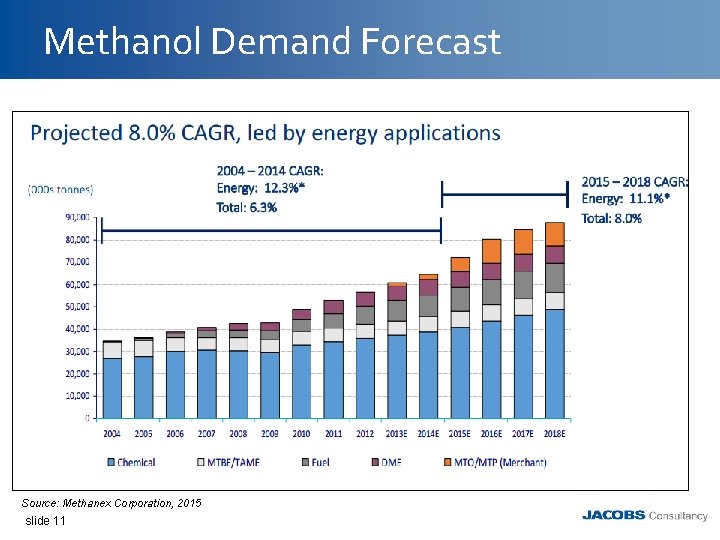
Methanol Demand Forecast Source: Methanex Corporation, 2015 slide 11
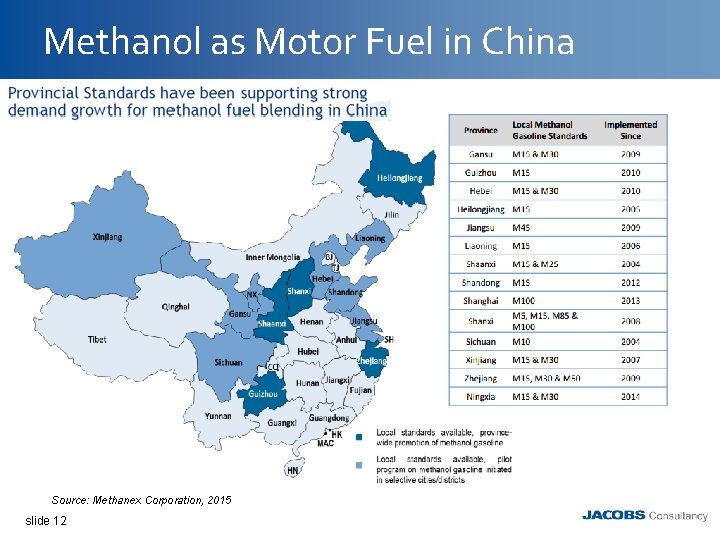
Methanol as Motor Fuel in China Source: Methanex Corporation, 2015 slide 12
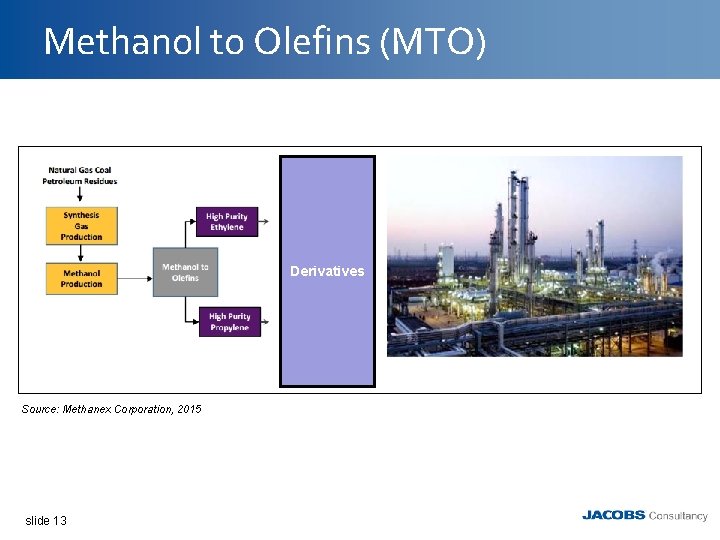
Methanol to Olefins (MTO) Derivatives Source: Methanex Corporation, 2015 slide 13
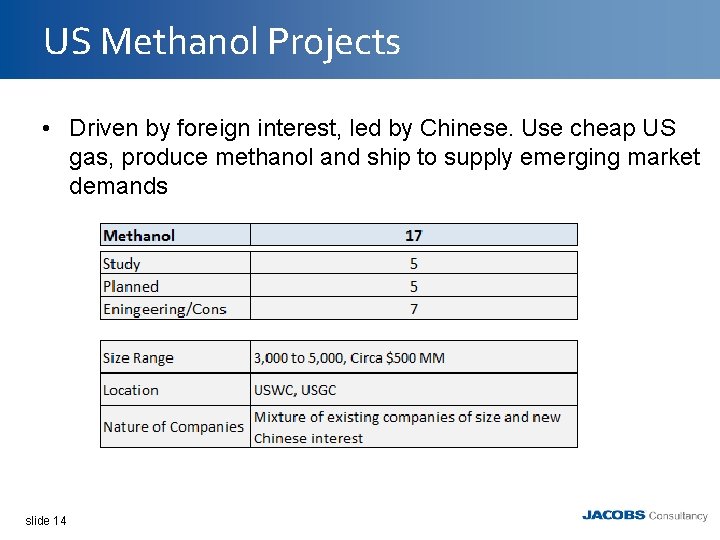
US Methanol Projects • Driven by foreign interest, led by Chinese. Use cheap US gas, produce methanol and ship to supply emerging market demands slide 14
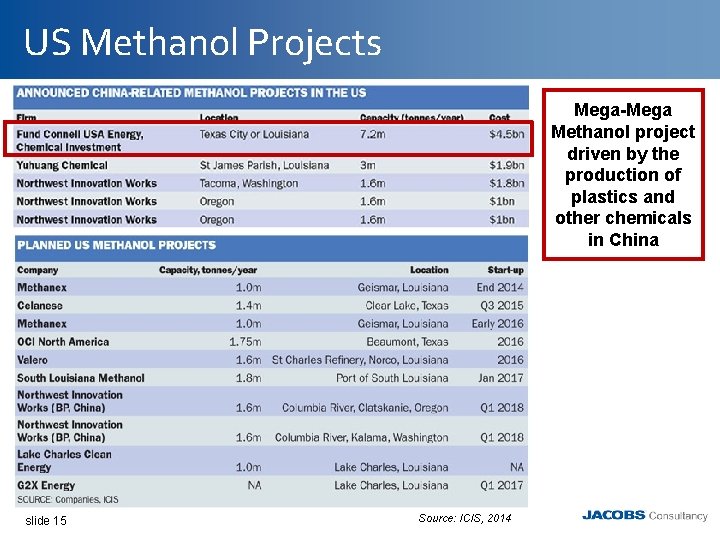
US Methanol Projects Mega-Mega Methanol project driven by the production of plastics and other chemicals in China slide 15 Source: ICIS, 2014
Ammonia Market • US Demand is 21 MMTPA • Import (2013) was about 6 MM – 6 to 8 new plants equivalent • These projects are more fundamentally based (local demand centers) • There are several real projects underway, but some of the announced projects probably lack capital. slide 16
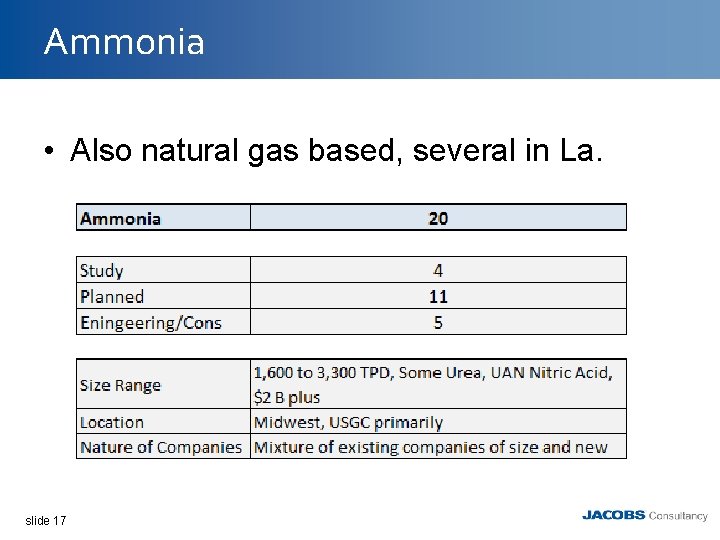
Ammonia • Also natural gas based, several in La. slide 17
GTL Projects • • Shell/Sasol These are in excess of 100, 000 BPD of product A host of other small/new technology announcements The “bet” is on a high oil/natural gas price differential. This has collapsed. • If 150, 000 B cost $20 B, I need $60 difference to get 15% ROI, not including op costs • On Jan. 28, 2015, Sasol announced that it was “delaying final investment decision on its proposed large-scale, US gas-to-liquids project to conserve cash in response to lower international oil prices”. • Shell ? slide 18
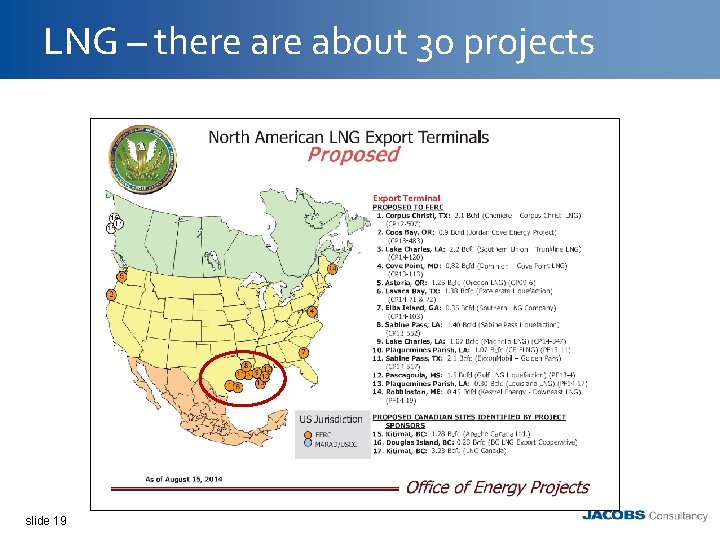
LNG – there about 30 projects slide 19
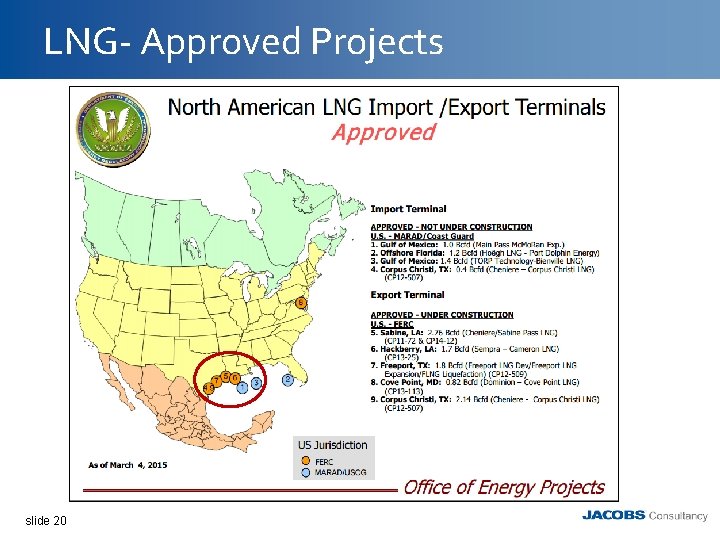
LNG- Approved Projects slide 20
LNG Export Issues • A 1. 0 BCFD liquefaction plant will cost about $4 billion. • A spread of about $5/MMBTU is about the minimum differential between buying price and average selling price is required for a period of about 10 years. • The selling price in premium markets is tied to oil (diesel) • Long-term buy/sell contracts needed for financing • There is some political risk • Import terminals cost about $1 billion for 1 BCFD • Very long – 4 yr plus -- permit period • Deep pockets and strong is required slide 21
Ethane and Ethylene slide 22
How does the world make ethylene? • Saudi – Mostly ethane, but now mostly committed • Kuwait – Ethane, but not much left • Qatar -- Ethane • Europe – Naphtha and Gas Oil • South America, Mexico – Naphtha • FSU – Mostly Naphtha • India and China – Naphtha • And in the US – Dominated by ethane ~70%, but also propane, butane naphtha slide 23
Ethane Value on $/MM Btu Basis Has Dropped $/MM BTU of Marker Crude, Natural Gas & Ethane Brent & Ethane Purity converted to $/MM BTU basis Source: Jacobs Consultancy slide 24
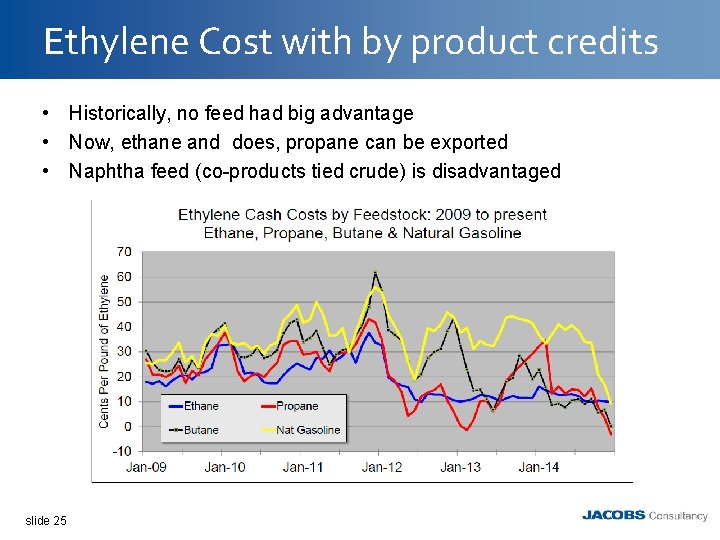
Ethylene Cost with by product credits • Historically, no feed had big advantage • Now, ethane and does, propane can be exported • Naphtha feed (co-products tied crude) is disadvantaged slide 25
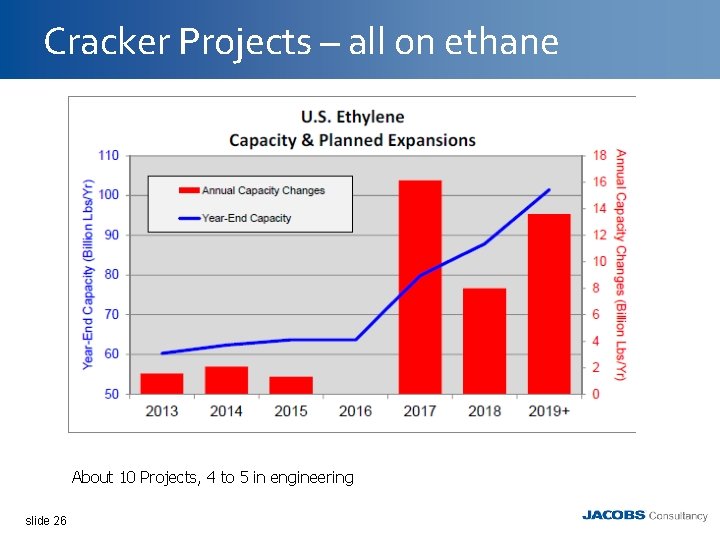
Cracker Projects – all on ethane About 10 Projects, 4 to 5 in engineering slide 26
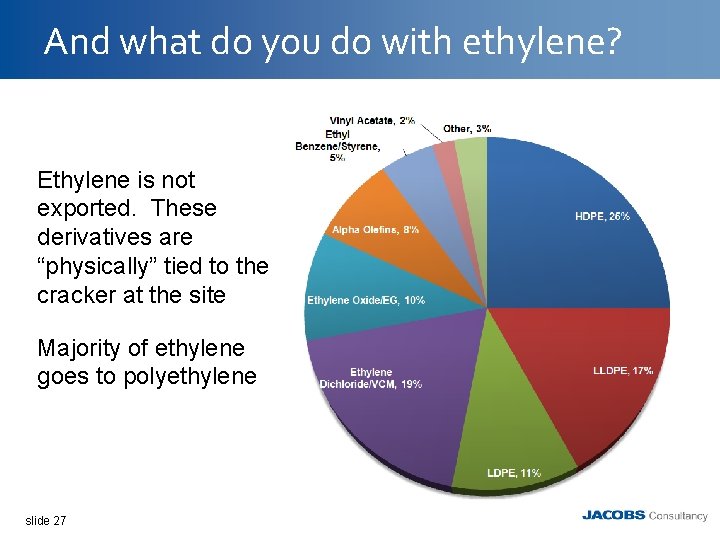
And what do you do with ethylene? Ethylene is not exported. These derivatives are “physically” tied to the cracker at the site Majority of ethylene goes to polyethylene slide 27
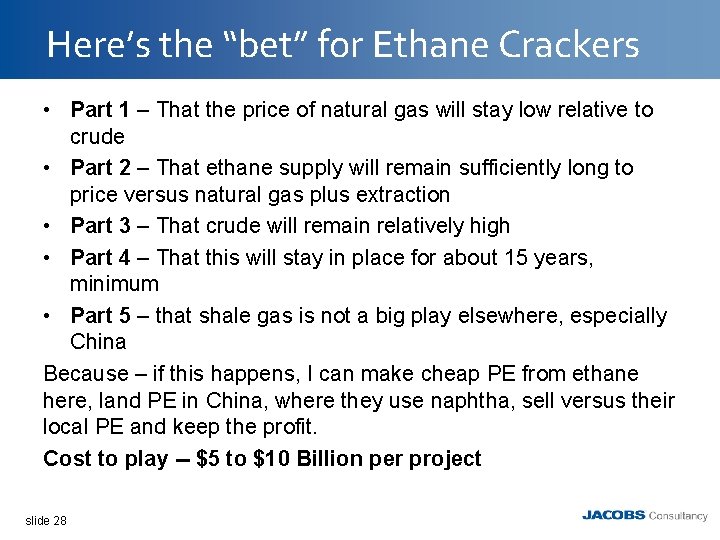
Here’s the “bet” for Ethane Crackers • Part 1 – That the price of natural gas will stay low relative to crude • Part 2 – That ethane supply will remain sufficiently long to price versus natural gas plus extraction • Part 3 – That crude will remain relatively high • Part 4 – That this will stay in place for about 15 years, minimum • Part 5 – that shale gas is not a big play elsewhere, especially China Because – if this happens, I can make cheap PE from ethane here, land PE in China, where they use naphtha, sell versus their local PE and keep the profit. Cost to play -- $5 to $10 Billion per project slide 28
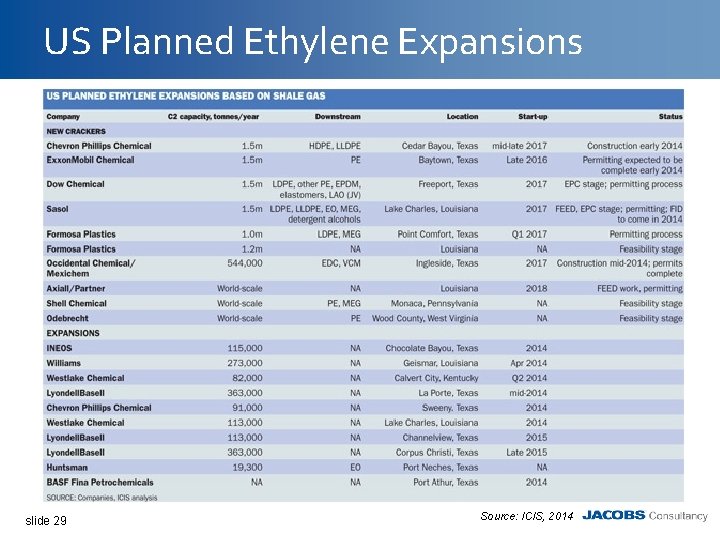
US Planned Ethylene Expansions slide 29 Source: ICIS, 2014
The Challenges • Construction Resources are being “pulled” by oil and gas production projects at $100 oil. With price drop, maybe less; with sustained price drop likely to see movements from E&P to chemicals. • The workforce is aging • It has been a long time since we needed this many specialized people – where are they? • High interest in module or skid mounted construction – Need more commercial demonstrations – Lower economies of scale, but potentially lower feedstock can be attractively sourced slide 30 3
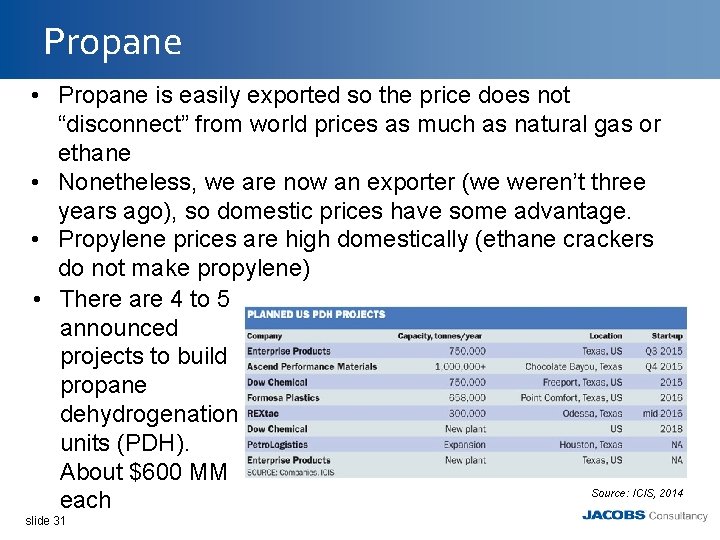
Propane • Propane is easily exported so the price does not “disconnect” from world prices as much as natural gas or ethane • Nonetheless, we are now an exporter (we weren’t three years ago), so domestic prices have some advantage. • Propylene prices are high domestically (ethane crackers do not make propylene) • There are 4 to 5 announced projects to build propane dehydrogenation units (PDH). About $600 MM Source: ICIS, 2014 each slide 31
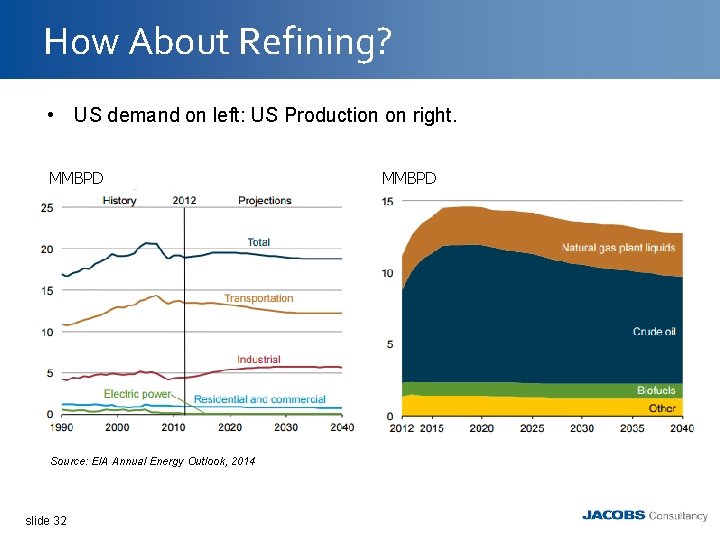
How About Refining? • US demand on left: US Production on right. MMBPD Source: EIA Annual Energy Outlook, 2014 slide 32 MMBPD
Refining Projects • Little to negative domestic demand growth for refined products • Product can be exported, crude (by law) is more difficult. • A number of “refining light” projects underway and or planned to minimally process the light crude and export it • Reduced capital spending for nonessential projects • Regulatory projects • Niche projects in “insulated” areas (not USGC) • It is not the boom as in ethylene slide 33
On Oil Price Forecasting • Questions being asked: 1) Did crude price bottom, 2) What is the forecast? • The accurate answer is “We don’t know” – in fact no one can accurately predict short term oil price. The reasons are: – Short term demand for refined product is very inelastic. On supply side, a 2% increase in gasoline supply will drop price by 20%. – Prior to 1973, it was the Texas Railroad Commission prior to 1973, OPEC supposedly after – Saudi and Kuwait have taken most of the production swing, but they are now interested in holding market share. – At this point, high priced production (primarily US and Canada, but includes Brazil, Colombia) needs to erode and/or demand needs to grow to rebalance. Both will take time. No one really know how long. – There are numerous other variables and uncertainties that can, arguably, push prices either way slide 34
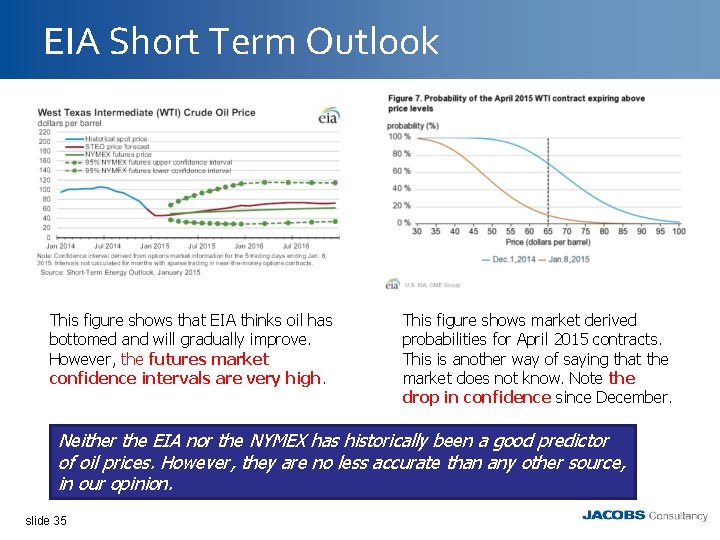
EIA Short Term Outlook This figure shows that EIA thinks oil has bottomed and will gradually improve. However, the futures market confidence intervals are very high. This figure shows market derived probabilities for April 2015 contracts. This is another way of saying that the market does not know. Note the drop in confidence since December. Neither the EIA nor the NYMEX has historically been a good predictor of oil prices. However, they are no less accurate than any other source, in our opinion. slide 35
Other Energy Industries • Canada – Canadian heavy oil production will stay relatively constant, but new projects are unlikely – Look for cuts in all non essential spending • Biofuels – Low oil prices hurt biofuels, especially ethanol and biodiesel • Natural Gas. – On one side, natural gas and midstream activity could slow since the economics of many gas fields depend on co-produced light oil. – However, less shale gas lowers overall supply and supports prices slide 36

Thanks for Your Attention Questions? slide 37
Contacts United States Offices: 5995 Rogerdale Road Houston, Texas 77072 832. 351. 7800 (phone) 832. 351. 7887 (fax) slide 38 United Kingdom Office: Tower Bridge Court 226 Tower Bridge Road London SE 1 2 UP United Kingdom +44 (0)20 7403 3330 (phone) +44 (0)20 7089 7750 (fax) 525 West Monroe Suite 1350 Chicago, Illinois 60661 312. 655. 9207 (phone) 312. 655. 9706 (fax) China Office: 6 F South Tower B, China Diamond Exchange Center 1701 Century Avenue, Pudong New District Shanghai 200122 P. R. China Tel; +86 21 5081 8811 * 607 Fax: +86 21 5081 6006 Canada Office: 205 Quarry Park Boulevard SE Calgary, Alberta T 2 C 3 E 7 Canada 403. 258. 6896 (phone) 403. 385. 1543 (fax) Netherlands Office: Plesmanlaan 100, 2332 CB Leiden P. O. Box 141, 2300 AC Leiden The Netherlands +31. 71. 582. 7111 (phone) +31. 71. 582. 7050 (fax) 38
- Slides: 38