What We Know About Climate Change Kerry Emanuel

What We Know About Climate Change Kerry Emanuel Lorenz Center Department of Earth, Atmospheric, and Planetary Sciences, MIT

Important Points about Climate and Climate Science Earth’s climate is stable within certain limits, but sensitive to change in forcing within those limits. Climate science has a long and illustrious history The idea that we are altering climate is based on simple physics, simple models, and complex models Human activities can and do have a strong effect on climate There is a definite risk of catastrophic climate change Where there is risk there is also opportunity

Last 450 Thousand Years

~ 20, 000 years before present
")
Polar radiative forcing: 10 W/m 2 (4 W/m 2 for 2 x CO 2) Global mean temperature fluctuation: ~5 C
 Milutin Milanković, 1879 -1958")
Climate Forcing by Orbital Variations (1912) Milutin Milanković, 1879 -1958

Strong Correlation between High Latitude Summer Insolation and Ice Volume Black: Time rate of change of ice volume Red: Summer high latitude sunlight P. Huybers, Science, 2006
")
John Tyndall (1820 -1893)
, nitrogen (N 2), and argon (Ar), though")
Tyndall’s Essential Results: Oxygen (O 2 ), nitrogen (N 2), and argon (Ar), though they make up ~99% of the atmosphere, are almost entirely transparent to solar and terrestrial radiation Water vapor (H 2 O), carbon dioxide (CO 2), nitrous oxide (N 2 O), and a handful of other trace gases make the lower atmosphere nearly opaque to infrared radiation, though still largely transparent to solar radiation (but clouds have strong effects on radiation at all wavelengths). Together they increase the Earth’s surface temperature from about 0 o. F to around 60 o. F.
 makes the difference between")
Atmospheric Composition The orange sliver (can you see it? ) makes the difference between a mean surface temperature of 0 o. F and of 60 o. F.
, about 0. 25% of the mass of the atmosphere,")
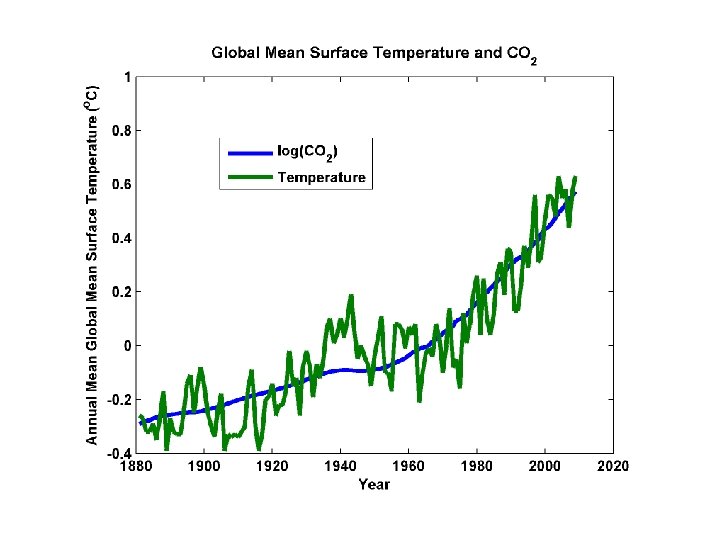
Water Vapor (H 2 O), about 0. 25% of the mass of the atmosphere, is the most important greenhouse gas, but responds to atmospheric temperature change on a time scale of about 2 weeks Climate is therefore strongly influenced by long-lived greenhouse gases (e. g. CO 2, CH 4, N 2 O) that together comprise about 0. 04% of the mass of the atmosphere. Concentration of CO 2 has increased by 43% since the dawn of the industrial revolution

Svante Arrhenius, 1859 -1927 “Any doubling of the percentage of carbon dioxide in the air would raise the temperature of the earth's surface by 4°; and if the carbon dioxide were increased fourfold, the temperature would rise by 8°. ” – Världarnas utveckling (Worlds in the Making), 1906

Today

Today Variation in carbon dioxide and methane over the past 20, 000 years, based on ice core and other records
, observed (red) The long-term cooling trend in the")
Arctic air temperature change reconstructed (blue), observed (red) The long-term cooling trend in the Arctic was reversed during recent decades. The blue line shows the estimated Arctic average summer temperature over the last 2000 years, based on proxy records from lake sediments, ice cores, and tree rings. The shaded area represents variability among the 23 sites use for the reconstruction. The red line shows the recent warming based on instrumental temperatures. From Kaufman et al. (2009).

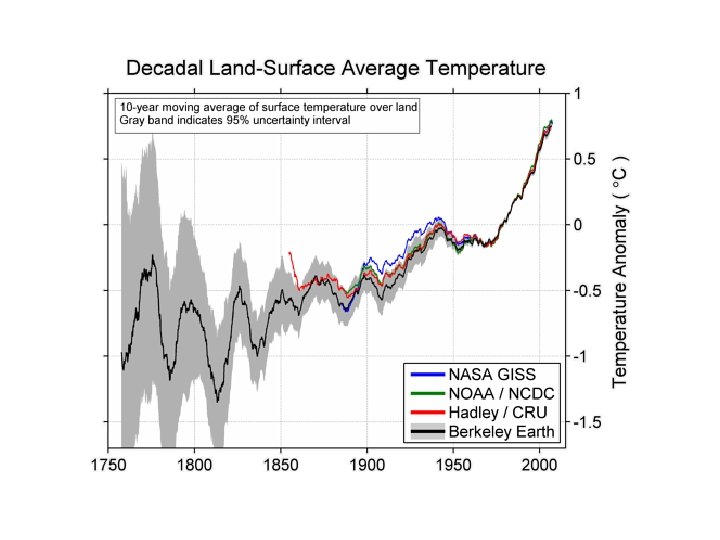
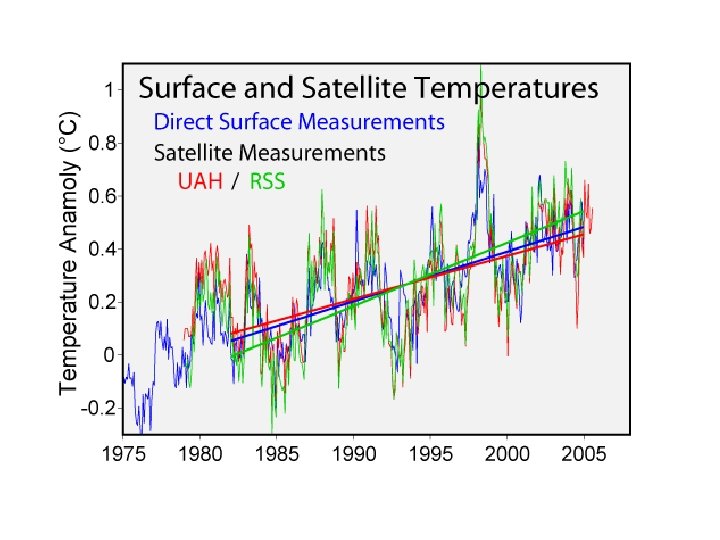
The Instrumental Record
 Top of the")
Tropospheric temperature trend from 1979 -2012 based on satellite measurements (RSS) Top of the stratosphere (TTS) 1979 -2006 temperature trend.

Total amount of heat from global warming that has accumulated in Earth's climate system since 1961, from Church et al. (2011) (many thanks to Neil White from the CSIRO for sharing their data).

September Arctic Sea Ice Extent
 and Sea Surface Temperature (Blue)")
Atlantic Hurricane Power (Green) and Sea Surface Temperature (Blue)
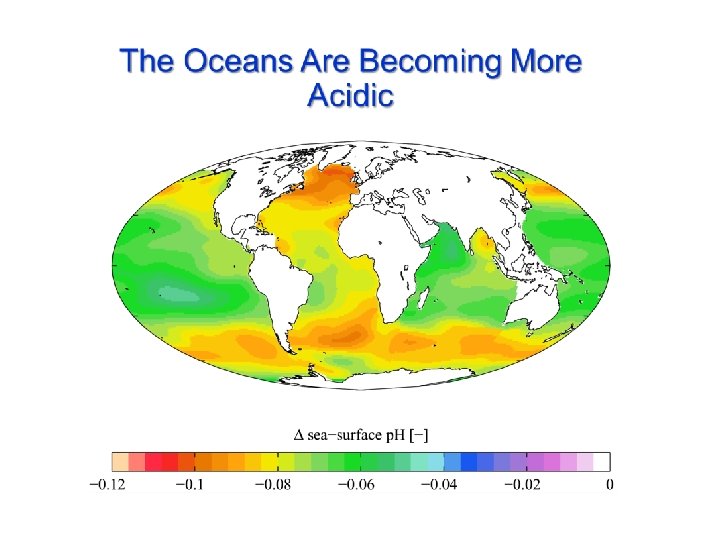

p Acidification through CO 2 threatens marine life Plankton Coral Reefs 25

Simple Models

MIT Single Column Model IPCC Estimate: 2 -4. 5 o. C

Global Climate Models

20 th Century With and Without Human Influences Based on 4 -member PCM ensembles, Meehl et al. , J. Climate, 2004

Sources of Uncertainty Cloud Feedback Water Vapor Feedback Ocean Response Aerosols

Known Risks Increasing sea level Increasing hydrological events… droughts and floods Increasing incidence of high category hurricanes and associated storm surges and freshwater flooding More heat stress

“Climate change could have significant geopolitical impacts around the world, contributing to poverty, environmental degradation, and the further weakening of fragile governments. Climate change will contribute to food and water scarcity, will increase the spread of disease, and may spur or exacerbate mass migration. ” -- Quadrennial Defense Review, U. S. Department of Defense, February, 2010

The Future

Estimate of how much global climate will warm as a result of doubling CO 2: a probability distribution Source: 100000 PAGE 09 runs Chris Hope, U. Cambridge courtesy Tim Palmer

CO 2 Will Go Well Beyond Doubling Double Pre -Industrial

IPCC 2007: Doubling CO 2 will lead to an increase in mean global surface temperature of 2 to 4. 5 o. C. Atmospheric CO 2 assuming that emissions stop altogether after peak concentrations Global mean surface temperature corresponding to atmospheric CO 2 above Courtesy Susan Solomon
 Might provide up to 30% of current")
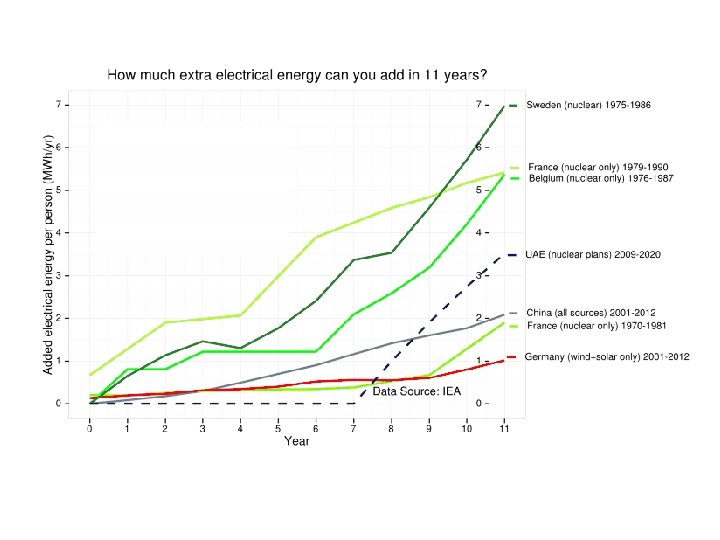
Solutions and Opportunities Renewables (solar and wind) Might provide up to 30% of current power needs Carbon Capture and Sequestration Currently would add ~$200/ton to energy costs Reasonable prospects for reducing this to ~$100/ton Currently little incentive to develop this Next Generation Fission Reactors

~13, 000 premature deaths annually in the U. S. from coal production and combustion • Nuclear power, by replacing fossil fuels, has prevented an estimated 1. 84 million air-pollution related deaths worldwide (includes Chernobyl, Fukushima)

• However, up-front capital costs of Gen I nuclear are large

Offshore floating nuclear power plant + Floating rig = Nuclear reactor OFNP Reduced capital cost (>90% cut in reinforced concrete) - Reduced construction/decommissioning schedule - Flexible siting + minimal local infrastructure (‘plug and play’) - Reliable passive cooling; no land/ocean contamination - Profs. J. Buongiorno, M. Golay, N. Todreas
 Fission Reactors One Example: Molten")
We Can Do Even Better: Next Generation (Gen IV) Fission Reactors One Example: Molten Salt Reactors Passively safe Can run on nuclear waste from Light Water Reactors Operate at ambient pressure Can run on thorium; unsuitable for weapons Estimated plant lifetime > 80 years
 Developed by U. S.")
Turning Electricity into Liquid Fuels E-CEM (Electrolytic Cation Exchange Module) Developed by U. S. Navy Uses electricity to synthesize liquid fuel from CO 2 in seawater and electrolysis to get H 2, then combined into hydrocarbons Carbon-neutral Can be done for $3 -6 per gallon.

Summary of Main Points Several aspects of climate science are well established Earth’s climate is strongly bounded but shows strong sensitivity within the bounds Climate science dates back well into the 19 th century and is well established

Summary of Main Points Earth’s greenhouse effect triples the amount of radiation absorbed by the surface though it is regulated by trace gases comprising no more than 0. 04% of the mass of the atmosphere. The concentration of CO 2 has increased by ~45% since the dawn of the industrial revolution Beginning with the calculations of Arrhenius more than 100 years ago, simple models predict an increase in global mean surface temperature of around 3 o. C for each doubling of CO 2. These are consistent with the results of global climate models Long atmospheric lifetime (~1000 years) of CO 2 limits window of time in which serious risks could be curtailed

Summary of Main Points Solar, wind, and especially next-gen fission can replace existing power generation infrastructure in 10 -20 years We will eventually need to do this anyway. Why not start now? Real economics: 20 years from now, will we be selling clean energy technology to China and India, or buying it from them?

Spare Slides
 Coal – global average 170, 000 (50% global")
Energy Source Mortality Rate (deaths/trillionk. Whr) Coal – global average 170, 000 (50% global electricity) Coal – China 280, 000 (75% China’s electricity) Coal – U. S. 15, 000 (44% U. S. electricity) Oil (electricity) 36, 000 (36% of energy, 8% of Natural Gas 4, 000 (20% global electricity) Biofuel/Biomass 24, 000 (21% global energy) Solar (rooftop) 440 (< 1% global electricity) Wind 150 (~ 1% global electricity) Hydro – global average 1, 400 (15% global electricity) Nuclear – global average 90 (17% global electricity w/Chern&Fukush)
 in the data from NASA GISS (orange) and from Cowtan")
Global temperature (annual values) in the data from NASA GISS (orange) and from Cowtan & Way (blue), i. e. Had. CRUT 4 with interpolated data gaps.
 data Image credit: NOAA")
Based on bathythermograph and ARGO (post-2004) data Image credit: NOAA

The GISS data, with El Niño and La Niña conditions highlighted. Neutral years like 2013 are gray.

Adjusted annual average temperature data with the estimated impact of El Niño, volcanic eruptions, solar variation, and the residual annual cycle removed.
 and")
Figure 1: Average global temperature surface anomaly multi-model mean from CMIP 5 (green) and as measured by the NASA Goddard Institute for Space Studies (GISS black). Most of this figure is a hindcast of models fitting past temperature data.
 and 95% individual model run")
Figure 2: 2007 IPCC report model ensemble mean (black) and 95% individual model run envelope (grey) vs. surface temperature anomaly from GISS (blue), NOAA (yellow), and Had. CRUT 3 (red).

Figure 5: 1970 -1990 aerosol loading of the atmosphere over the lower 48 United States and estimated associated surface air temperature change. Figure 6: Observed total surface temperature change over the lower 48 United States from 1930 to 1990.
")
Past and Projected Sea Level vs. Temperature (Source: WBGU after David Archer 2006)

Paleo reconstructions of temperature change over the last 2000 years “Hockey Stick” Instrumental Record Year

Renewables Require Baseload

Can be deployed on 15 -25 year time scale

Carbon Dioxide and Climate: A Scientific Assessment Report to the National Academy of Sciences Jule G. Charney and co-authors 1979 When it is assumed that the CO 2 content of the atmosphere is doubled and statistical thermal equilibrium is achieved, the more realistic of the modeling efforts predict a global surface warming of between 2°C and 3. 5 °C, with greater increases at high latitudes.
- Slides: 60