
What Matters in College for Retaining Aspiring Scientists
- Slides: 13
What Matters in College for Retaining Aspiring Scientists and Engineers? Mitchell Chang Jessica Sharkness Christopher Newman Sylvia Hurtado Higher Education Research Institute, UCLA 2010 AERA Annual Meeting Friday, April 30 – Tuesday, May 4 Denver, Colorado
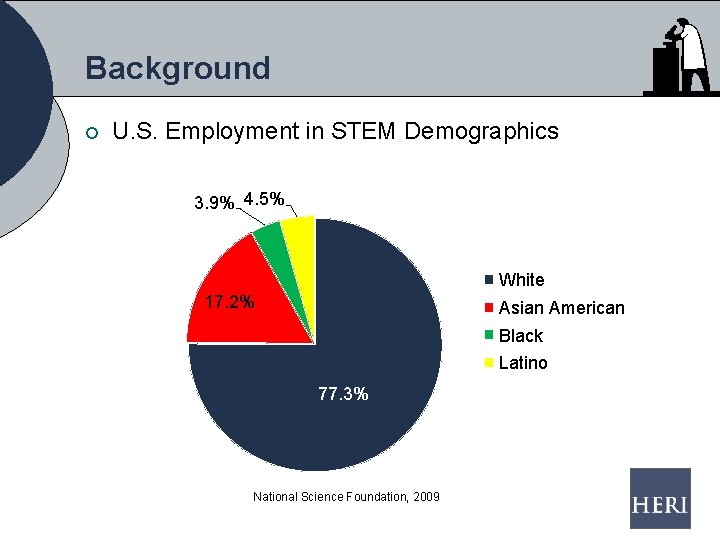
Background ¡ U. S. Employment in STEM Demographics 3. 9% 4. 5% White 17. 2% Asian American Black Latino 77. 3% National Science Foundation, 2009
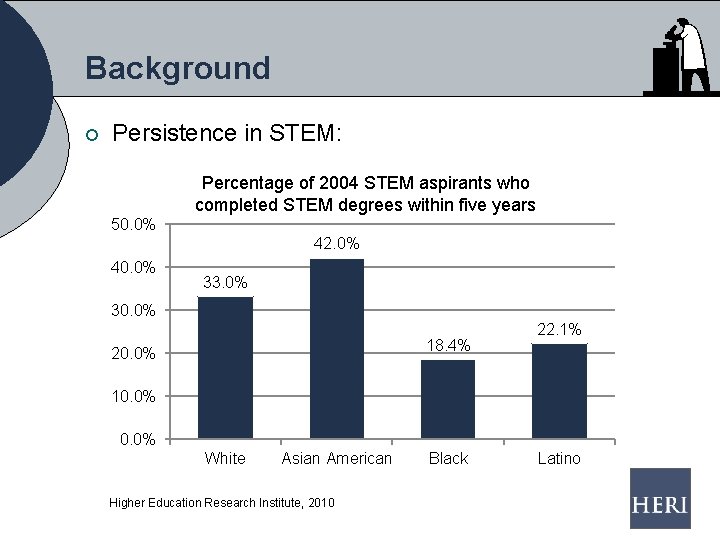
Background ¡ Persistence in STEM: Percentage of 2004 STEM aspirants who completed STEM degrees within five years 50. 0% 42. 0% 40. 0% 33. 0% 30. 0% 18. 4% 20. 0% 22. 1% 10. 0% White Asian American Higher Education Research Institute, 2010 Black Latino
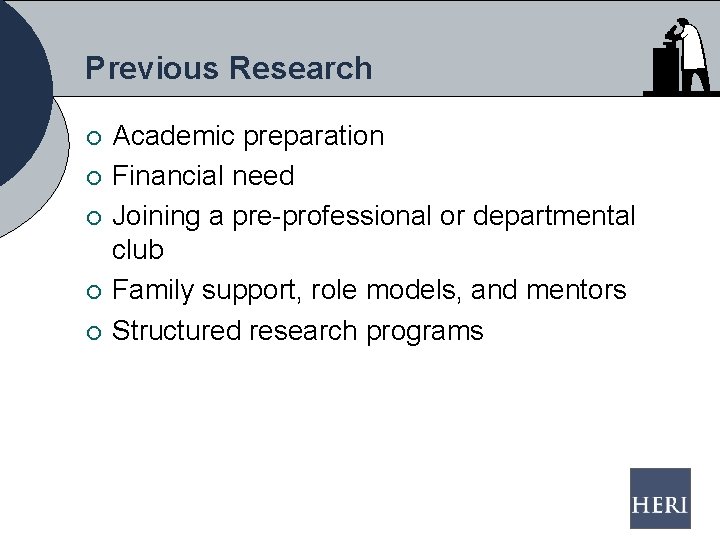
Previous Research ¡ ¡ ¡ Academic preparation Financial need Joining a pre-professional or departmental club Family support, role models, and mentors Structured research programs
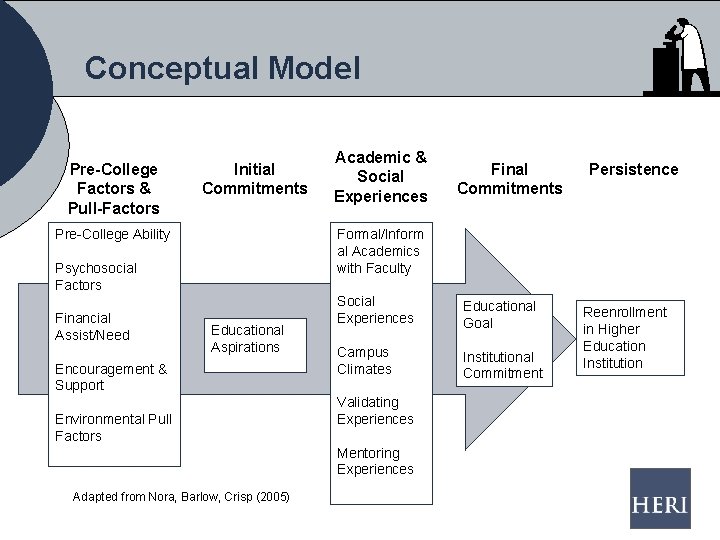
Conceptual Model Pre-College Factors & Pull-Factors Initial Commitments Pre-College Ability Final Commitments Persistence Formal/Inform al Academics with Faculty Psychosocial Factors Financial Assist/Need Academic & Social Experiences Educational Aspirations Encouragement & Support Environmental Pull Factors Social Experiences Educational Goal Campus Climates Institutional Commitment Validating Experiences Mentoring Experiences Adapted from Nora, Barlow, Crisp (2005) Reenrollment in Higher Education Institution
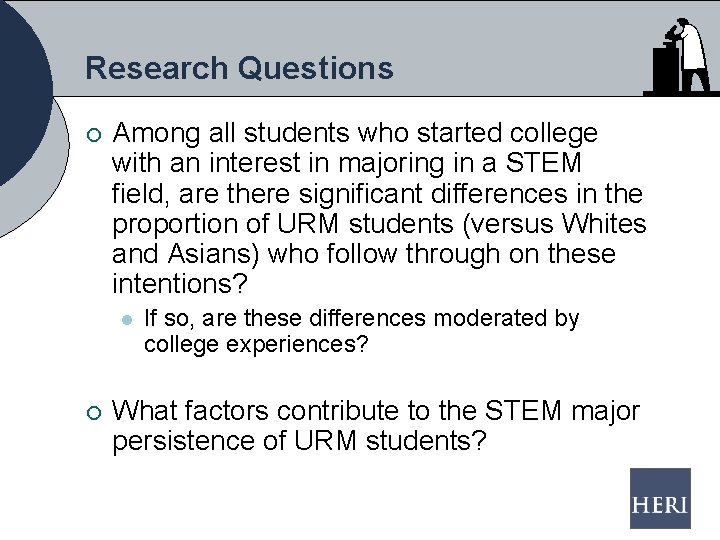
Research Questions ¡ Among all students who started college with an interest in majoring in a STEM field, are there significant differences in the proportion of URM students (versus Whites and Asians) who follow through on these intentions? l ¡ If so, are these differences moderated by college experiences? What factors contribute to the STEM major persistence of URM students?
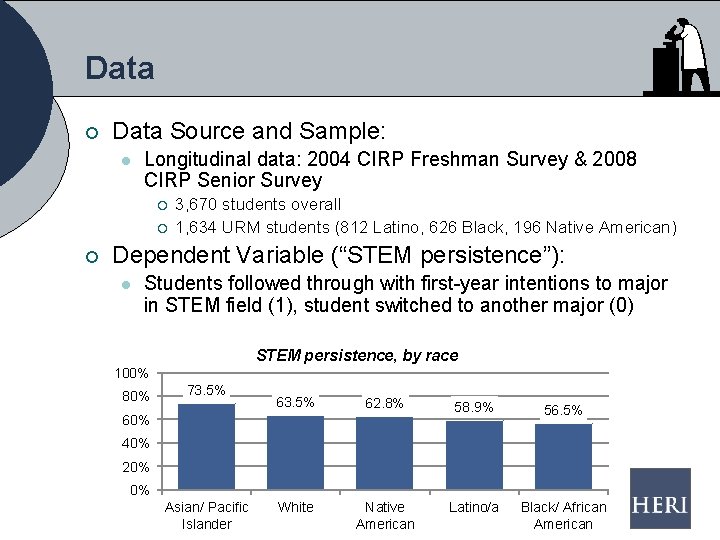
Data ¡ Data Source and Sample: l Longitudinal data: 2004 CIRP Freshman Survey & 2008 CIRP Senior Survey ¡ ¡ ¡ 3, 670 students overall 1, 634 URM students (812 Latino, 626 Black, 196 Native American) Dependent Variable (“STEM persistence”): l Students followed through with first-year intentions to major in STEM field (1), student switched to another major (0) STEM persistence, by race 100% 80% 73. 5% 62. 8% 58. 9% 56. 5% White Native American Latino/a Black/ African American 60% 40% 20% 0% Asian/ Pacific Islander
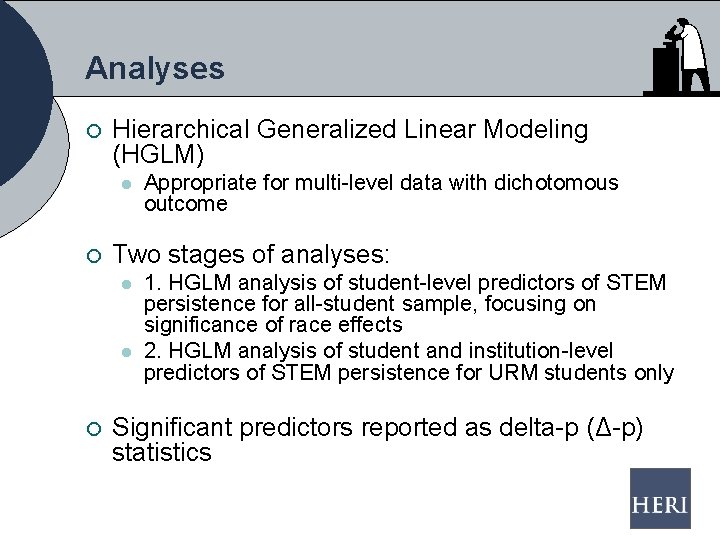
Analyses ¡ Hierarchical Generalized Linear Modeling (HGLM) l ¡ Two stages of analyses: l l ¡ Appropriate for multi-level data with dichotomous outcome 1. HGLM analysis of student-level predictors of STEM persistence for all-student sample, focusing on significance of race effects 2. HGLM analysis of student and institution-level predictors of STEM persistence for URM students only Significant predictors reported as delta-p (Δ-p) statistics
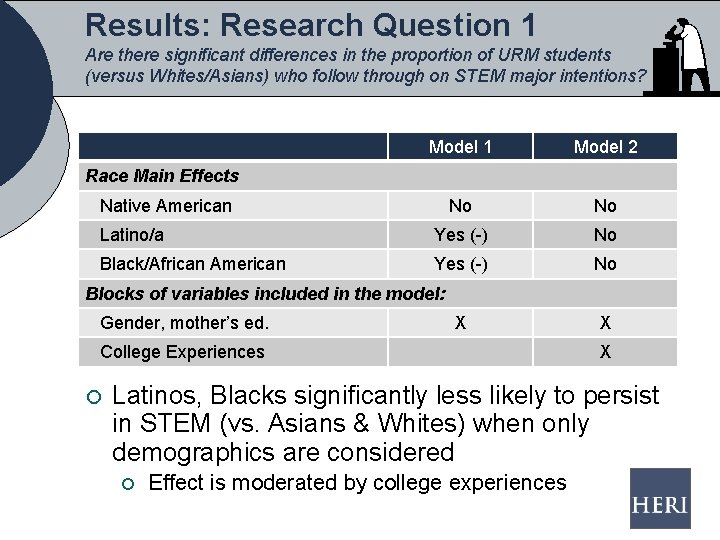
Results: Research Question 1 Are there significant differences in the proportion of URM students (versus Whites/Asians) who follow through on STEM major intentions? Model 1 Model 2 No No Latino/a Yes (-) No Black/African American Yes (-) No Race Main Effects Native American Blocks of variables included in the model: Gender, mother’s ed. X College Experiences ¡ X X Latinos, Blacks significantly less likely to persist in STEM (vs. Asians & Whites) when only demographics are considered ¡ Effect is moderated by college experiences
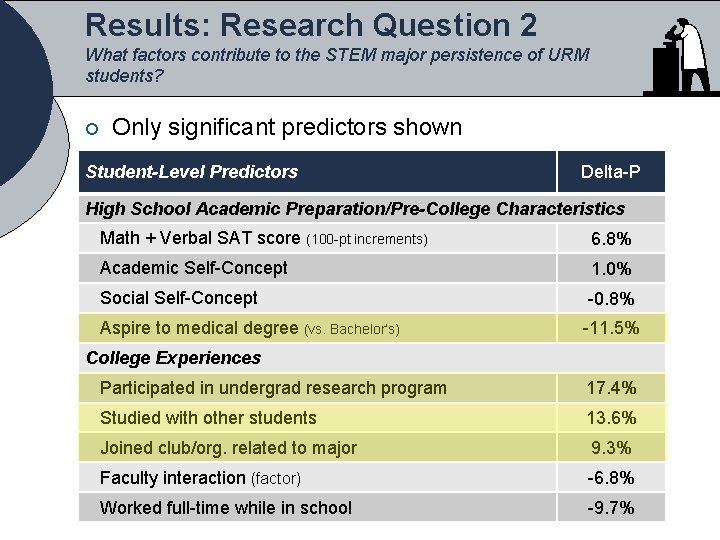
Results: Research Question 2 What factors contribute to the STEM major persistence of URM students? ¡ Only significant predictors shown Student-Level Predictors Delta-P High School Academic Preparation/Pre-College Characteristics Math + Verbal SAT score (100 -pt increments) 6. 8% Academic Self-Concept 1. 0% Social Self-Concept -0. 8% Aspire to medical degree (vs. Bachelor’s) -11. 5% College Experiences Participated in undergrad research program 17. 4% Studied with other students 13. 6% Joined club/org. related to major 9. 3% Faculty interaction (factor) -6. 8% Worked full-time while in school -9. 7%
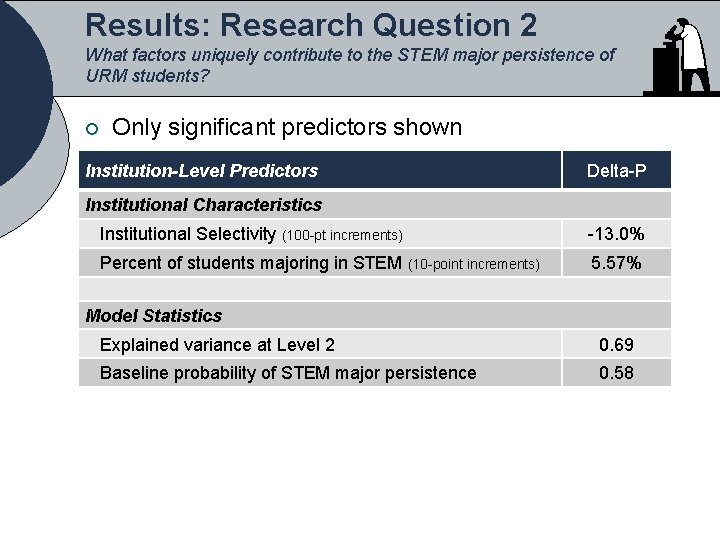
Results: Research Question 2 What factors uniquely contribute to the STEM major persistence of URM students? ¡ Only significant predictors shown Institution-Level Predictors Delta-P Institutional Characteristics Institutional Selectivity (100 -pt increments) -13. 0% Percent of students majoring in STEM (10 -point increments) 5. 57% Model Statistics Explained variance at Level 2 0. 69 Baseline probability of STEM major persistence 0. 58
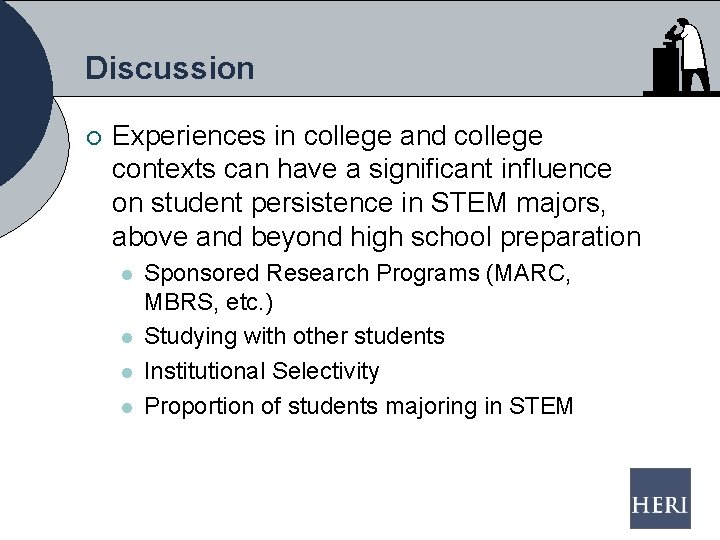
Discussion ¡ Experiences in college and college contexts can have a significant influence on student persistence in STEM majors, above and beyond high school preparation l l Sponsored Research Programs (MARC, MBRS, etc. ) Studying with other students Institutional Selectivity Proportion of students majoring in STEM
Contact Information Faculty and Co-PIs: Sylvia Hurtado Mitchell Chang Postdoctoral Scholars: Kevin Eagan Josephine Gasiewski Administrative Staff: Aaron Pearl Graduate Research Assistants: Monica Lin Cindy Mosqueda Christopher Newman Juan Garibay Gina Garcia Minh Tran Felisha Herrera Jessica Sharkness Papers and reports are available for download from project website: http: //heri. ucla. edu/nih Project e-mail: herinih@ucla. edu Acknowledgments: This study was made possible by the support of the National Institute of General Medical Sciences, NIH Grant Numbers 1 R 01 GMO 71968 -01 and R 01 GMO 71968 -05 as well as the National Science Foundation, NSF Grant Number 0757076. This independent research and the views expressed here do not indicate endorsement by the sponsors.