
What limiting factors influence carrying capacity Agenda Do


- Slides: 15
What limiting factors influence carrying capacity?
Agenda • Do Now Hand Out • Mini Lesson and Regents Practice • Start Carrying Capacity Lab • Exit Ticket
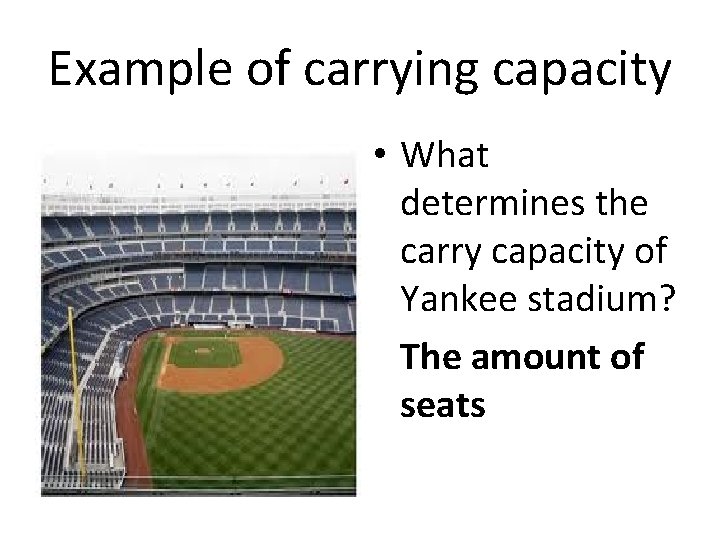
Example of carrying capacity • What determines the carry capacity of Yankee stadium? The amount of seats
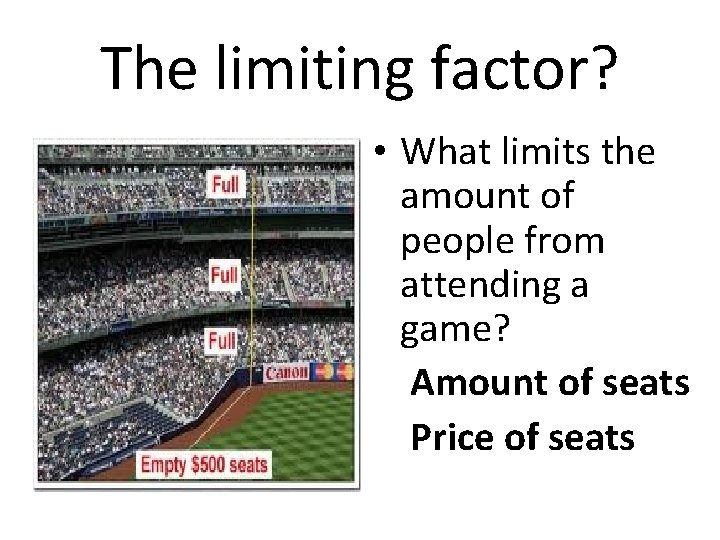
The limiting factor? • What limits the amount of people from attending a game? Amount of seats Price of seats
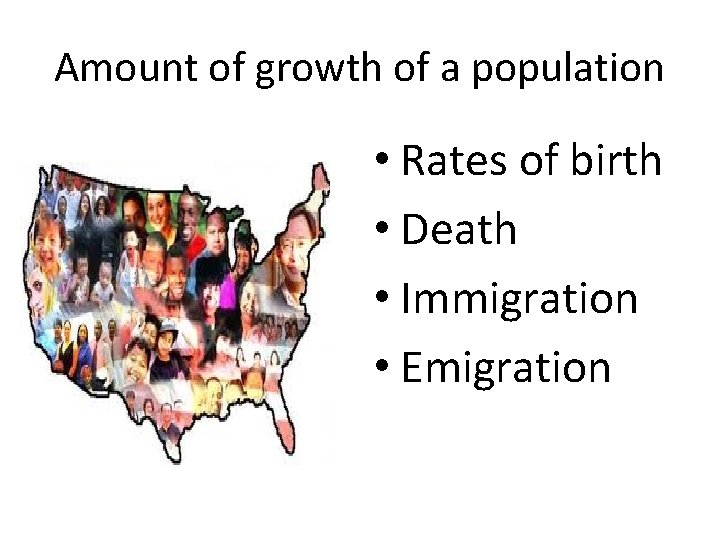
Amount of growth of a population • Rates of birth • Death • Immigration • Emigration
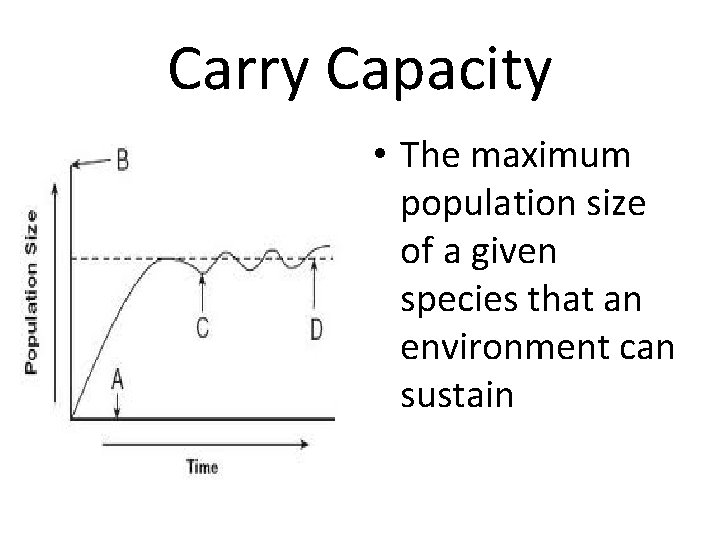
Carry Capacity • The maximum population size of a given species that an environment can sustain
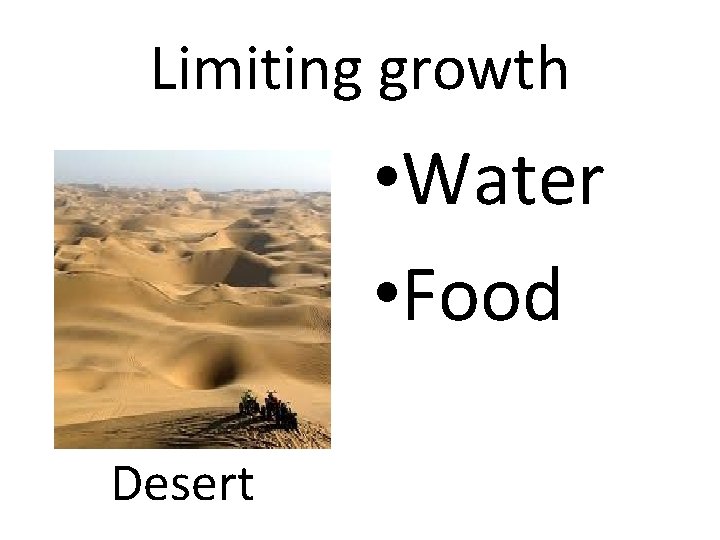
Limiting growth • Water • Food Desert
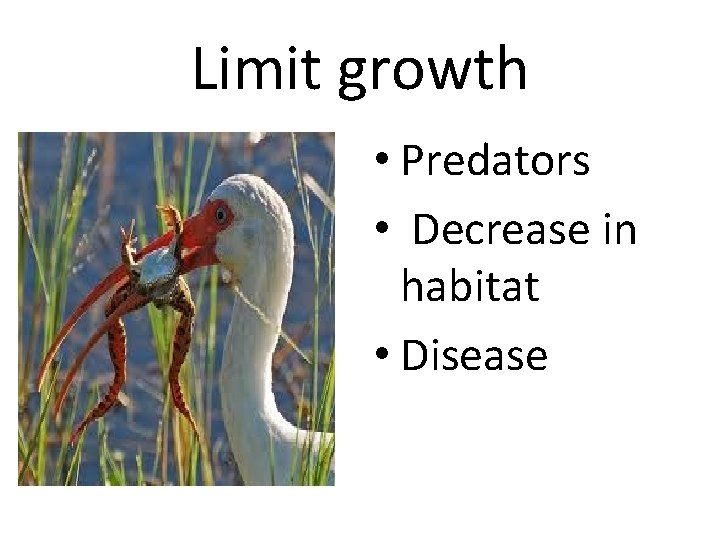
Limit growth • Predators • Decrease in habitat • Disease
Limiting factors Definition Examples Factor that causes the growth of a population to decrease • • • Food Water Predation Space Disease
The size of a mouse population in a natural ecosystem tends to remain relatively constant due to 1. the carrying capacity of the environment 2. the lack of natural predators 3. cycling of energy 4. increased numbers of decomposers
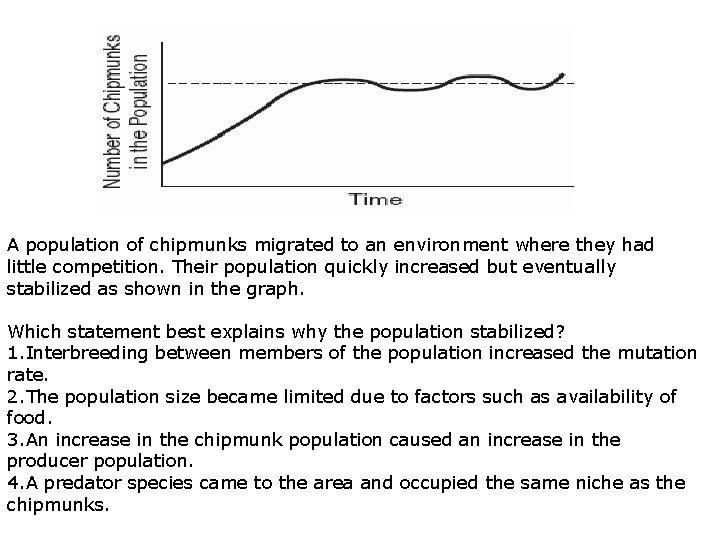
A population of chipmunks migrated to an environment where they had little competition. Their population quickly increased but eventually stabilized as shown in the graph. Which statement best explains why the population stabilized? 1. Interbreeding between members of the population increased the mutation rate. 2. The population size became limited due to factors such as availability of food. 3. An increase in the chipmunk population caused an increase in the producer population. 4. A predator species came to the area and occupied the same niche as the chipmunks.
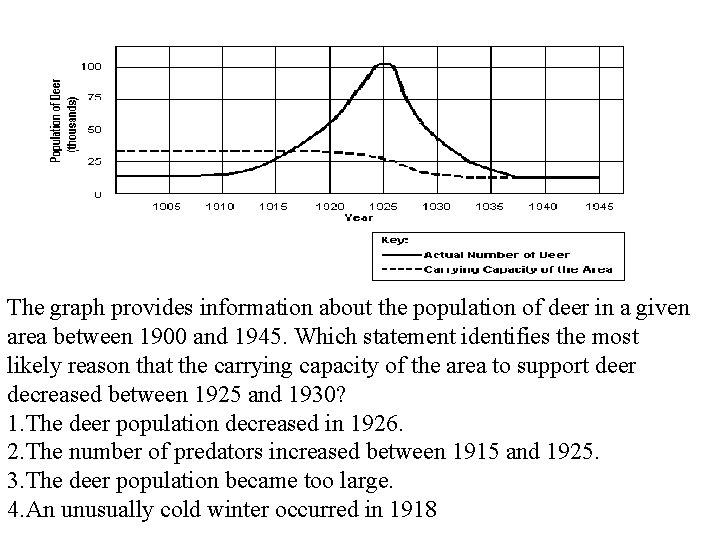
The graph provides information about the population of deer in a given area between 1900 and 1945. Which statement identifies the most likely reason that the carrying capacity of the area to support deer decreased between 1925 and 1930? 1. The deer population decreased in 1926. 2. The number of predators increased between 1915 and 1925. 3. The deer population became too large. 4. An unusually cold winter occurred in 1918
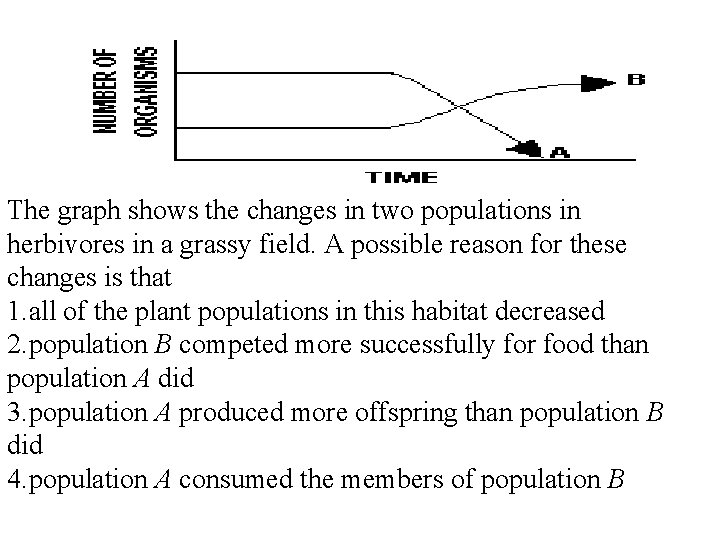
The graph shows the changes in two populations in herbivores in a grassy field. A possible reason for these changes is that 1. all of the plant populations in this habitat decreased 2. population B competed more successfully for food than population A did 3. population A produced more offspring than population B did 4. population A consumed the members of population B
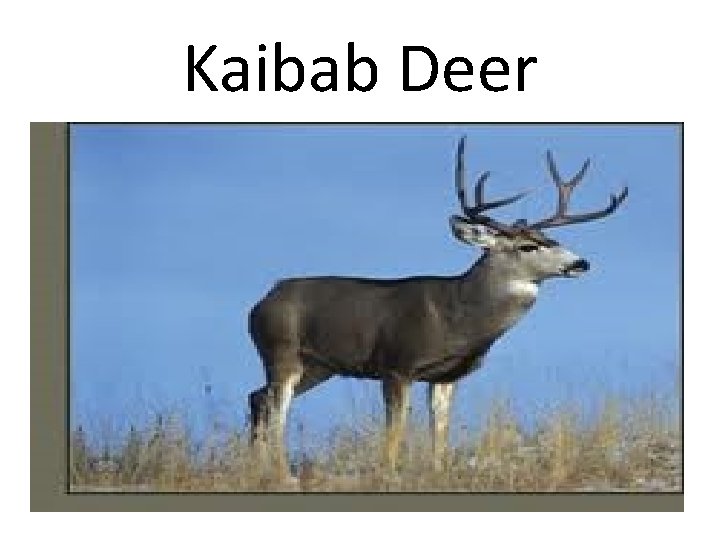
Kaibab Deer
Toco Toucan