What is panel data I have data from


 2) 3) 4) 5) 6) 7) 8) 9)")
 New respondents recruited in the two elections in")


")


- Slides: 36
What is panel data? • ”I have data from a web panel” ≠ panel data • When the same people respond twice (t>1) • AND at least one variable are measured twice
www. mod. gu. se
www. mod. gu. se
www. mod. gu. se
www. mod. gu. se
www. mod. gu. se
www. mod. gu. se
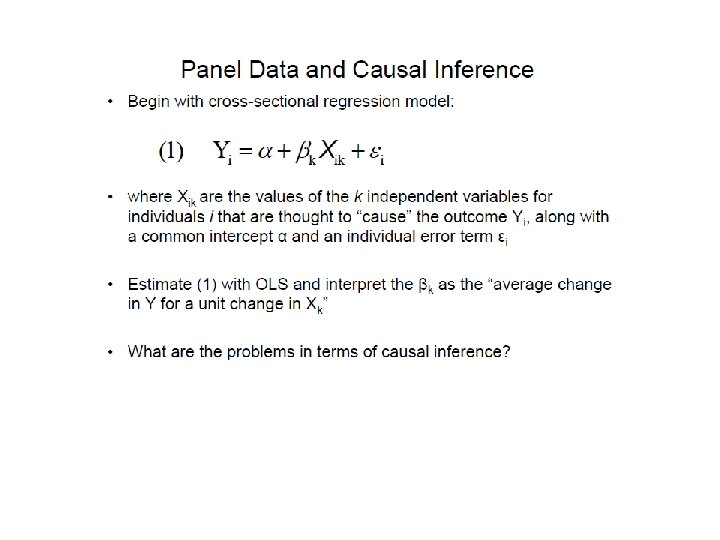
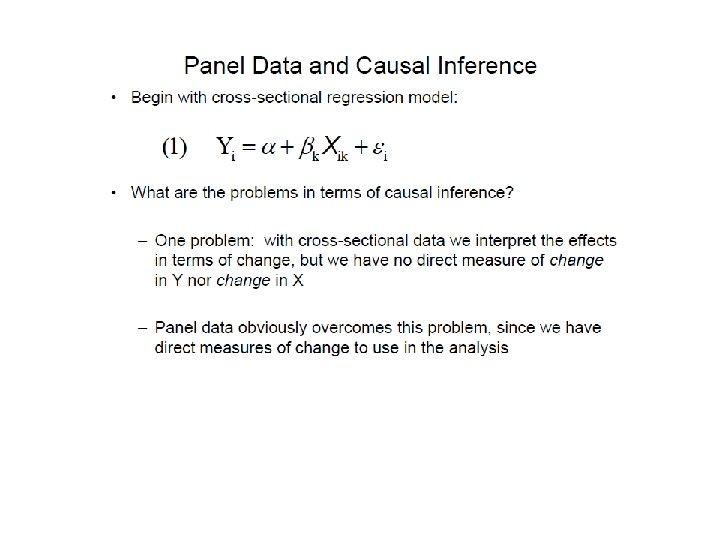
- traditionally, the main use of panel data has been to improve causal inference in observational studies www. mod. gu. se
• But the problems of causal inference also go deeper • Maybe some Xs are not exogeneous to your Y?
EU
EU EU EU
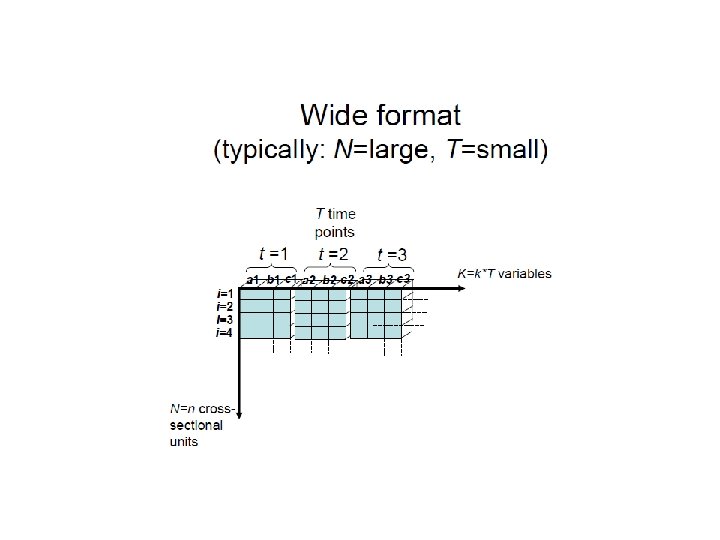
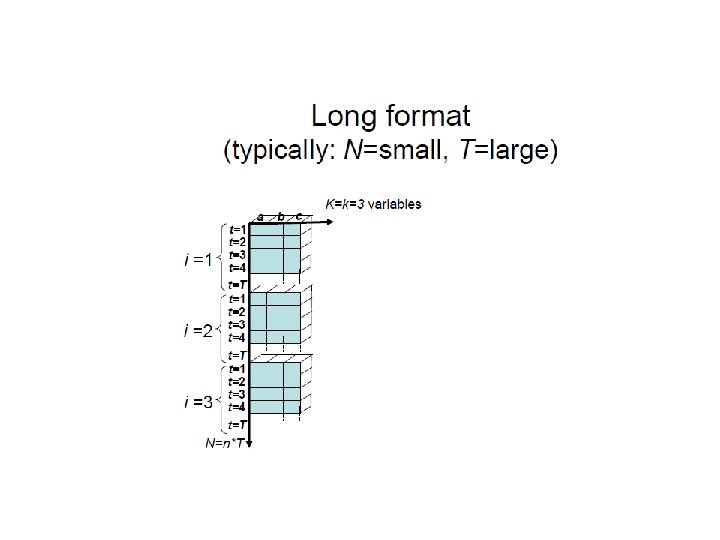
• With T=2 it doesnt matter • With T>2 long format is often prefered • Wide format is easier to understand, and some descriptive statistics is easier to get • For causal analysis through panel regression models, long format is necessary
Collection of panel data through VAAs • The VAAs main function here is to collect e-mailadresses • So primarily a way to recruit a web panel • Or simply to start a specific panel data collection
The swedish panel data example 1) 2) 3) 4) 5) 6) 7) 8) 9) sample recruited in 2009 and 2010 Wave 1 in early 2014 Wave 2 spring 2014 Wave 3 just before the EUP election in May 2014 Wave 4 just after the EUP election in May 2014 Wave 5 before the national election in September 2014 Wave 6 right after the national election in 2014 Wave 7. . probably in late November 2014 (and all these people can be linked to the VAA user data)
The swedish panel data example 1) New respondents recruited in the two elections in 2014 2) In total approximately 30, 000
/1 4 10 /A ug /1 4 17 /A ug /1 4 24 /A ug /1 4 31 /A ug /1 4 07 /S ep /1 4 14 /S ep /1 4 /A ug 03 ul 27 /J /1 4 ul 20 /J /1 4 ul 13 /J 4 /1 4 ul 06 /J /1 /J un 29 4. 0% % of all users leaving their e-mailadress 3. 5% 3. 0% 2. 5% 2. 0% 1. 5% 1. 0% 0. 5% 0. 0%
9000 160000 Extra survey 140000 Surveys completed 7000 6000 nr recruited 120000 nr users 100000 5000 80000 4000 60000 3000 40000 20000 1000 /1 4 ep /S 07 14 /1 4 4 31 /A ug /1 4 24 /A ug /1 4 ug /A 17 /1 ug /A 10 /1 4 4 03 /A ug /1 4 27 /Ju l/1 4 l/1 /Ju 20 l/1 /Ju 13 06 /Ju l/1 14 /Ju n/ 29 4 0 Kompassanvändare 8000
Response rates in different panel waves 80% 70% 60% 50% europrofiler 40% valkompass (vaa) 30% Aftonbladet 2014 20% 10% 0% kp 1 kp 2 kp 3 kp 4 kp 5 kp 6
Response rates in a standard panel data project • An election panel started two years before the election (2012) • Total of five waves • Half probability based recruitment to the Citizen Panel at Uof. G • Half opt-recruits (partly also from VAAs in 2010, but not only) • Total approximately 5 -6000 respondents
90% 80% Participation rates 78% 75% 70% 71% 67% 68% 63% 60% 63% 56% 59% 53% 50% 49% 40% 43% 30% 20% 10% 0% wave 1 wave 2 wave 3 Opt-in wave 4 Probability wave 5 Answered all
60 Number of answered waves 56 50 43 40 30 18 20 13 10 9 10 0 1 12 16 15 9 2 Opt-in Probability 3 4 5
60 Political interest 50 40 30 20 10 0 Very interested wave 1 Rather interested Not very 2 interestedwave 3 Not interested at 4 all wave 5
Increased political interest from not interested to interested 4 3. 5 2. 9 3 2. 5 2. 8 2. 4 2. 2 2 1. 5 1. 1 1 0. 5 0 wave 2 wave 3 Opt-in wave 4 Probability wave 5
100 Increased political interest from not interested to interested 94. 6 89. 3 90 80 70 60 50 40 30 20 10. 7 5. 4 10 0 0 1 Opt-in Probability
70 Swedish economy today 60 50 40 30 20 10 0 wave 1 wave 2 Good wave 3 Bad wave 4 wave 5
40 Change in coming year: The Swedish economy 35 30 25 20 15 10 5 0 wave 1 Will wave 2 improve wave 3 Get worse wave 4 wave 5
4. 5 4 Turned positive regarding economic situation in Sweden 4 3. 3 3. 5 3 2. 9 2. 5 2 2 1. 5 2 1. 8 1. 4 1. 3 wave 4 wave 5 1 0. 5 0 wave 2 wave 3 Opt-in Probability
3 2. 5 Turned negative regarding economic situation in Sweden 2. 3 2. 4 2 1. 7 1. 6 1. 5 1. 3 1. 2 1. 1 1 0. 5 0 wave 2 wave 3 Opt-in wave 4 Probability wave 5
www. mod. gu. se